Important Notice: The content of this report is from the preprint of a Bioinformatics Applications Note by Nils Gehlenborg, Michael S. Noble, Gad Getz, Lynda Chin
and Peter J. Park describing the Nozzle package. This Nozzle version of the preprint
was created to demonstrate features of the Nozzle package. Please view the final
article on the Bioinformatics website.
Summary: We have developed Nozzle, an R package that provides an API to generate HTML reports with dynamic user interface elements. Nozzle was designed to facilitate summarization and rapid browsing of complex results in data analysis pipelines where multiple analyses are performed frequently on big data sets. The package can be applied to any project where user-friendly reports need to be created.
Availability: The R package is available on CRAN at http://cran.r-project.org/package=Nozzle.R1. Examples and additional materials are available at http://gdac.broadinstitute.org/nozzle. The source code is also available at http://www.github.com/parklab/Nozzle.
Contact: peter_park@hms.harvard.edu
Supplementary Information: Supplementary data are available at Bioinformatics online.
Due to the increasing size and complexity of biological data, a considerable portion of bioinformatics analyses are implemented as (semi-)automated pipelines. The main task of these pipelines is to control the flow of large data sets through a series of analysis modules, which are often independent applications. These analyses typically need to be performed repeatedly over time as data are accumulated gradually.
GenePattern [1], Galaxy [2] and Taverna [3] are popular workflow management systems used to implement such pipelines for high-throughput analysis of genomics data. Another common approach is to use shell scripting to tie together different tools into an analysis pipeline. Whereas pipelines greatly reduce the effort required to apply different algorithms to large data sets, they often result in a multitude of figures, lists, and tables at varying levels of detail. This presents significant challenges for the biologists who must sift through a large amount of information to identify potentially interesting findings.
In the use case we describe, each run of the pipeline results in more than 11,000 figures and tables. In some cases, this problem can be addressed by feeding these results into a database with a dynamic query interface. While databases are capable of supporting powerful exploration tools and interactive visualizations, their development and maintenance require a significant investment of resources and their data model is less flexible than reports. This is particularly problematic when the tools in the pipeline are replaced as requirements change. Alternatively, the results can be summarized in reports.
Several R libraries exist that can be used to generate reports for analysis pipelines. R2HTML [4] and hwriter (http://cran.r-project.org/package=hwriter) are low-level libraries for writing HTML files. Sweave [5], knitr [6] and related tools for reproducible research can be used to generate PDF or HTML documents from within R scripts. However, none of these tools provide support in generating reports with dynamic user interface components for the presentation of extensive and complex analysis results. To address these limitations, we have developed the Nozzle R package, which supports pipeline developers in creating comprehensive and user-friendly HTML reports to describe the results of analysis pipelines.
Nozzle reports are generated bottom-up (Figure 1): in Phase 1 report elements are generated - e.g. a table and a paragraph of text, in Phase 2 they are assembled into larger structures - e.g. the table and the paragraph are added to a titled section, which is added to the report, and in Phase 3 the report is rendered into HTML.
Figure 1. Sample R script to create a basic Nozzle report that illustrates the three phases of the bottom-up approach. See Supplementary Result 1 for the HTML report.
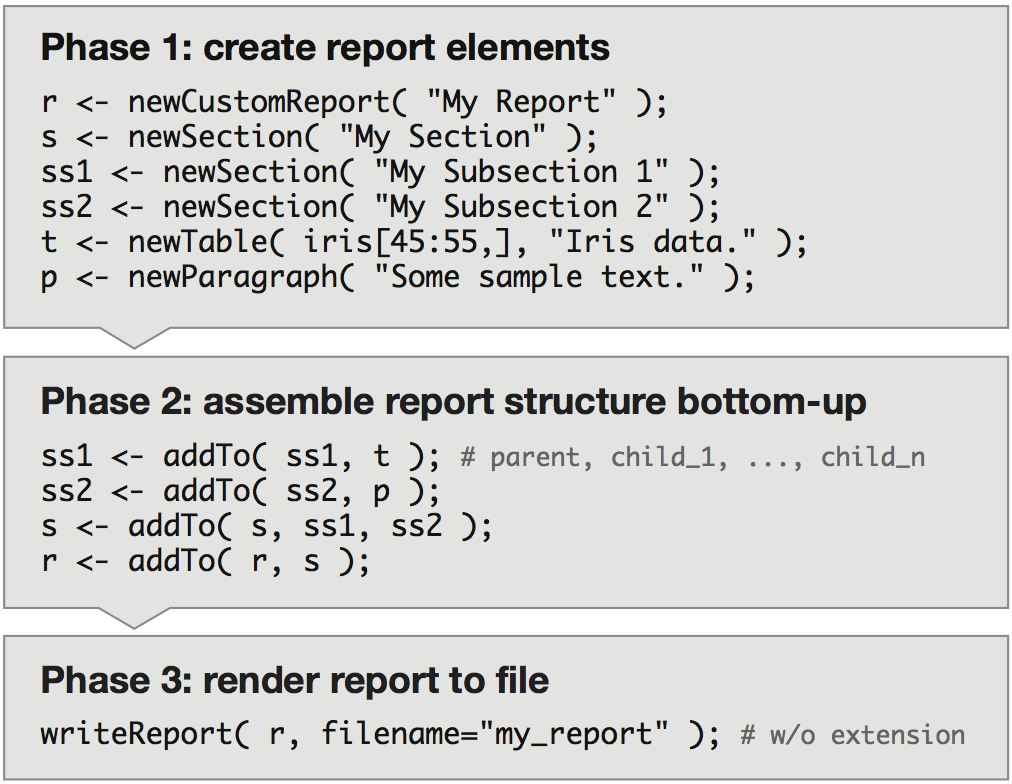
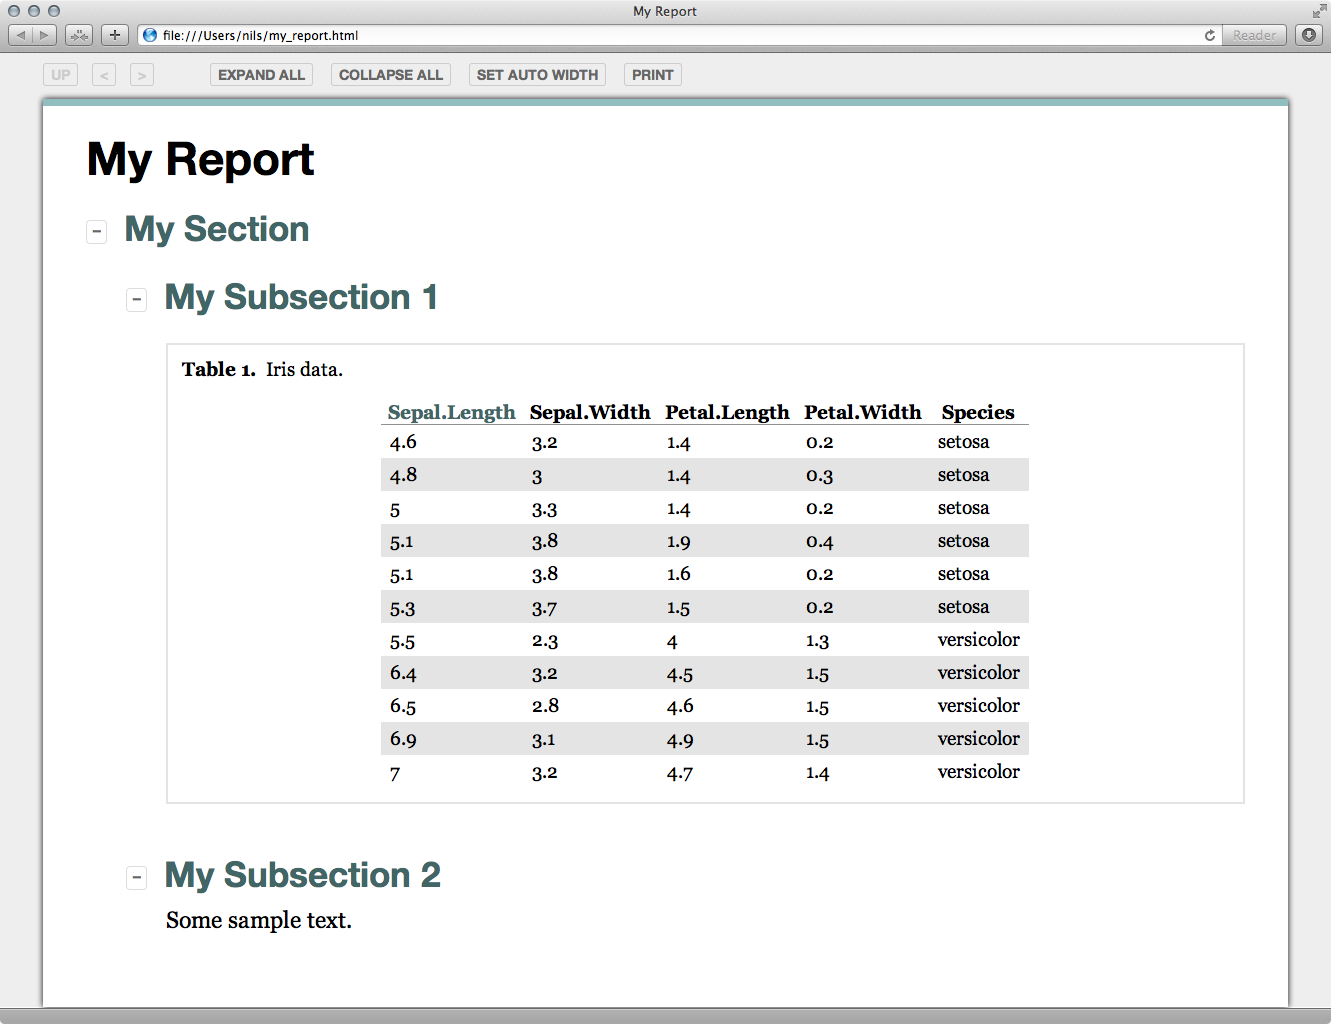
Figure S1. A basic Nozzle report generated with the R script shown in Figure 1. All sections and subsections are expanded. The table is sorted ascendingly by "Sepal.Length". The table can be sorted by other variables by clicking on the corresponding column headers.
The guiding principle for the design of the Nozzle package is to enable report authors - usually pipeline developers - to focus on the content rather than on the layout or generation of the report. We achieve this through the high-level R API that enables authors to create report elements such as figures, tables, paragraphs of text, bibliographic or web references, lists, sections and subsections using regular R commands without knowledge of the technologies used for the presentation of the final report.
Nozzle reports provide a rich user interface (Figure 2). All figures support dynamic switching between a thumbnail view and a detail view. They also have a caption and can be linked to a high-resolution or PDF version of the figure. All tables are sortable and support automatic trimming of floating point numbers to a user-defined number of significant digits. Tables also include a caption and can be linked to external files that contain additional information. Text and the content of table cells can be marked up semantically using the Nozzle-specific result style as well as common styles such as parameter, link or simply emphasis. The result markup indicates that the corresponding text represents an analysis result (Figure 2b). When a result is flagged as significant, Nozzle uses this information to guide readers to sections containing significant results by highlighting the corresponding section (Figure 2a). This is particularly useful in comprehensive reports with many sections or in situations when readers must frequently review large numbers of reports and would like to focus first on significant findings.
Figure 2. A sample Nozzle report. (a) Red markers indicate statistically significant - as defined by the report author - results in this section. (b) Red boxes indicate significant results. (c) Underlined results have associated supplementary information. Clicking opens the (d) supplementary infor-mation panel.
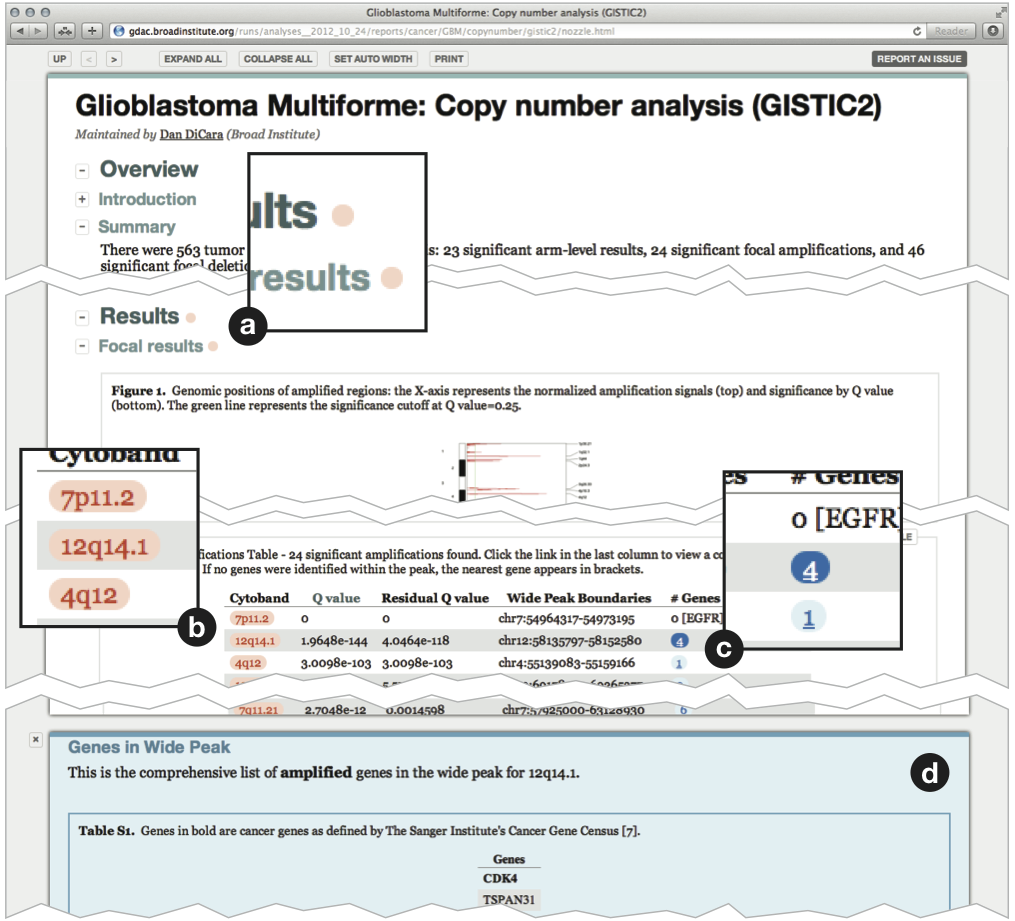
Results can also be linked to supplementary information (Figure 2c, Figure 2d), which may contain any report elements including sections, figures and tables. These are shown on demand using a split-screen approach, allowing the readers to view main results and supplementary information side by side. This is a powerful tool for creating reports that focus on the key findings while still providing access to more detailed information.
The Nozzle R API was intentionally kept simple with only four key classes of methods: constructor (e.g. newFigure, newSection) and formatter methods (e.g. asResult, asParameter) to create and format content during the first phase, assembly methods (e.g. addTo, addToResults) to combine elements during the second phase and finally a single writeReport method to render the assembled report in the third phase. Additionally, Nozzle provides a set of advanced features that give developers more control over the content and structure of reports. For example, the API contains several setter/getter methods to modify parameters of the report, e.g. maintainer or copyright information, logos, custom style information or Google Analytics tracking identifiers. Furthermore, developers can define the visibility of report elements using three privacy levels (private, group, public) and exclude pertinent sections in the final report by providing a corresponding visibility flag when rendering to HTML. This feature allows developers to easily censor sensitive information in public reports.
Nozzle works with R 2.10 or later. Internally, reports are repre-sented as a tree of report elements and implemented as nested R list objects. These lists are rendered into HTML files that include a set of JavaScript functions to support dynamic features of the user interface. For this purpose, JQuery (http://www.jquery.com) and the JQuery Table Sorter plugin (http://www.tablesorter.com) are embedded, making Nozzle reports independent of external library files. Likewise, Cascading Style Sheets (CSS) are embedded in the HTML and used for layout and styling of the reports. The reports are compatible with Firefox 4+, Chrome 12+, Safari 5+, Opera 11+ and Internet Explorer 9+.
We have deployed Nozzle in the context of the Firehose pipeline management system developed at the Broad Institute (http://gdac.broadinstitute.org). Firehose is used for comprehensive automated and reproducible analyses of the data generated by The Cancer Genome Atlas (TCGA, http://cancergenome.nih.gov). In December 2012, the analysis workflow comprised approximately 35 different modules. They cover a wide range of analyses on different data types, including clustering of mRNA, miRNA and methylation data, copy number analysis with GISTIC 2.0 [7], mutation analysis, correlation analyses between clinical and various molecular data, as well as pathway analyses. In this project, a team of ten software developers and computational biologists from four institutions (Broad Institute, Dana-Farber Cancer Institute, Harvard Medical School, Institute for Systems Biology) used Nozzle to implement reports for individual pipelines. The complete analysis workflow is currently run once per month for each of 27 disease cohorts studied in TCGA, generating close to 500 reports. These reports are publicly available on the website of the TCGA Genome Data Analysis Center (GDAC) at the Broad Institute (see above URL) and archived by the TCGA Data Coordination Center. Between 1 February 2012 and 31 December 2012, more than 2,700 viewers have accessed over 17,000 reports in approximately 6,000 visits.
We thank Dan DiCara, Lihua Zou, Douglas Voet and the members of the TCGA GDAC at the Broad Institute for helpful comments.
Funding: We acknowledge support from The Cancer Genome Atlas program of the National Cancer Institute, U24 CA143867.
Conflict of Interest: None declared.