This report serves to describe the mutational landscape and properties of a given individual set, as well as rank genes and genesets according to mutational significance. MutSig v1.5 was used to generate the results found in this report.
Working with individual set: LUAD.
Number of patients in set: 148
The input for this pipeline is a set of individuals with the following files associated for each:
1. An annotated .maf file describing the mutations called for the respective individual, and their properties.
2. A .wig file that contains information about the coverage of the sample.
Significantly mutated genes (q ≤ 0.1): 84
Mutations seen in COSMIC: 0
Significantly mutated genes in COSMIC territory: 1
Genes with clustered mutations (&le 3 aa apart): 1
Significantly mutated genesets: 74
Significantly mutated genesets: (excluding sig. mutated genes): 0
Table 1. Get Full Table Table representing breakdown of mutations by type.
| type | count |
|---|---|
| Frame_Shift_Del | 38 |
| Frame_Shift_Ins | 18 |
| In_Frame_Del | 3 |
| Missense_Mutation | 2126 |
| Nonsense_Mutation | 154 |
| Nonstop_Mutation | 2 |
| Silent | 702 |
| Splice_Site_DNP | 1 |
| Splice_Site_Del | 1 |
| Splice_Site_Ins | 5 |
| Splice_Site_SNP | 68 |
| Total | 3118 |
Table 2. Get Full Table A breakdown of mutation rates per category discovered for this individual set.
| category | n | N | rate | rate_per_mb | relative_rate |
|---|---|---|---|---|---|
| A->T | 609 | 67502974 | 9e-06 | 9 | 0.54 |
| C->(A/T) | 908 | 77308830 | 0.000012 | 12 | 0.7 |
| A->(C/G) | 447 | 67502974 | 6.6e-06 | 6.6 | 0.4 |
| C->G | 160 | 77308830 | 2.1e-06 | 2.1 | 0.12 |
| indel+null | 286 | 144811804 | 2e-06 | 2 | 0.12 |
| double_null | 6 | 144811804 | 4.1e-08 | 0.041 | 0.0025 |
| Total | 2416 | 144811804 | 0.000017 | 17 | 1 |
The x axis represents the samples. The y axis represents the exons, one row per exon, and they are sorted by average coverage across samples. For exons with exactly the same average coverage, they are sorted next by the %GC of the exon. (The secondary sort is especially useful for the zero-coverage exons at the bottom).
Figure 1.
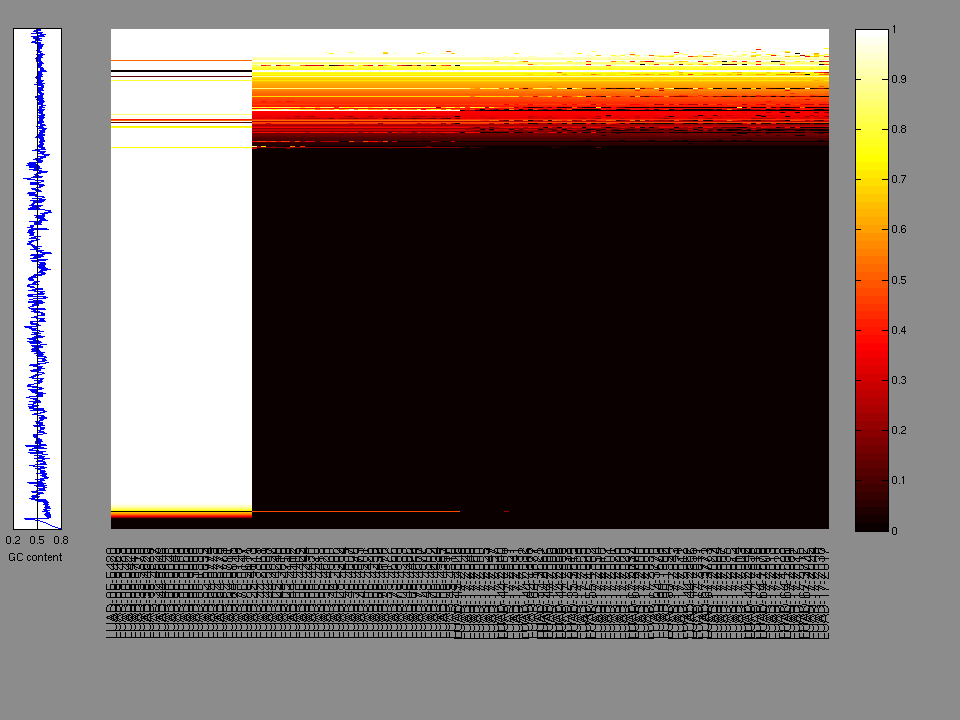
Figure 2.
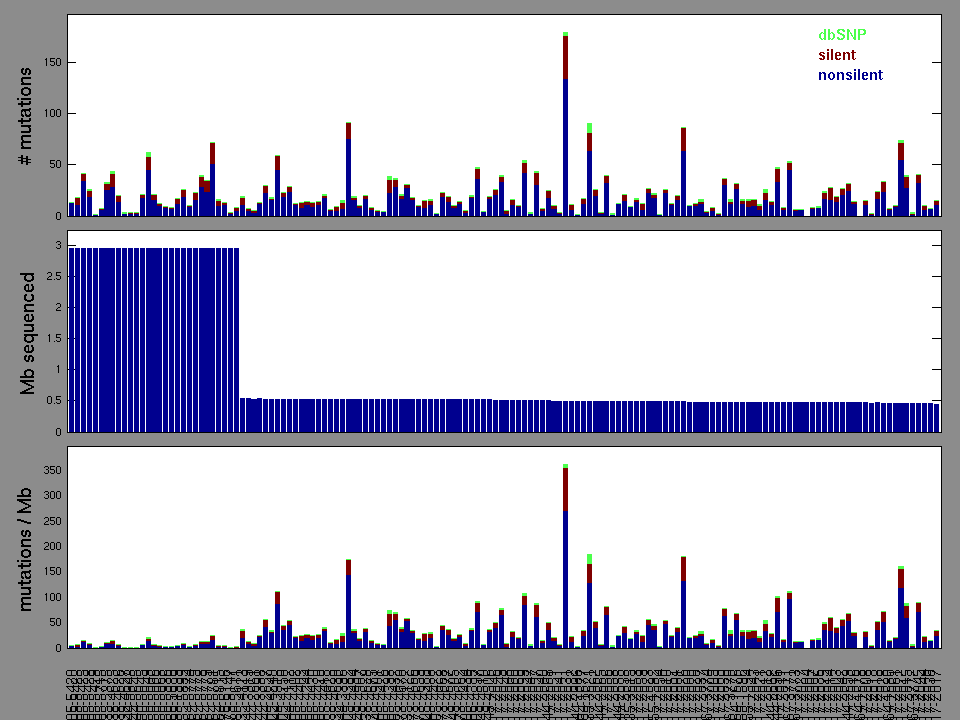
Table 3. Get Full Table A Ranked List of Significantly Mutated Genes. Number of significant genes found: 84. Number of genes displayed: 35
| rank | gene | description | N | n | npat | nsite | nsil | n1 | n2 | n3 | n4 | n5 | n6 | p | q |
|---|---|---|---|---|---|---|---|---|---|---|---|---|---|---|---|
| 1 | SPTA1 | spectrin, alpha, erythrocytic 1 (elliptocytosis 2) | 332193 | 35 | 29 | 35 | 7 | 11 | 11 | 4 | 1 | 6 | 2 | 3.7e-14 | 3.5e-11 |
| 2 | KEAP1 | kelch-like ECH-associated protein 1 | 73604 | 24 | 24 | 23 | 0 | 2 | 14 | 2 | 1 | 5 | 0 | 4.1e-14 | 3.5e-11 |
| 3 | MYH2 | myosin, heavy chain 2, skeletal muscle, adult | 223101 | 18 | 18 | 18 | 4 | 6 | 8 | 3 | 1 | 0 | 0 | 1.2e-11 | 6.7e-09 |
| 4 | EGFR | epidermal growth factor receptor (erythroblastic leukemia viral (v-erb-b) oncogene homolog, avian) | 149027 | 11 | 10 | 6 | 1 | 0 | 4 | 5 | 2 | 0 | 0 | 7.4e-11 | 3.1e-08 |
| 5 | EPHA6 | EPH receptor A6 | 155112 | 16 | 16 | 16 | 1 | 6 | 6 | 2 | 0 | 2 | 0 | 1.4e-10 | 4.6e-08 |
| 6 | MYH1 | myosin, heavy chain 1, skeletal muscle, adult | 254227 | 16 | 16 | 16 | 5 | 3 | 7 | 3 | 0 | 3 | 0 | 1.7e-10 | 4.8e-08 |
| 7 | ZAN | zonadhesin | 379001 | 25 | 20 | 22 | 5 | 7 | 6 | 5 | 1 | 4 | 2 | 2.2e-10 | 5.4e-08 |
| 8 | PTPRC | protein tyrosine phosphatase, receptor type, C | 155693 | 11 | 11 | 11 | 3 | 4 | 4 | 1 | 0 | 2 | 0 | 1.1e-08 | 2.3e-06 |
| 9 | FBN2 | fibrillin 2 (congenital contractural arachnodactyly) | 334477 | 18 | 17 | 18 | 2 | 11 | 4 | 1 | 0 | 2 | 0 | 1.4e-08 | 2.5e-06 |
| 10 | MYH8 | myosin, heavy chain 8, skeletal muscle, perinatal | 226905 | 15 | 15 | 15 | 1 | 5 | 4 | 3 | 0 | 3 | 0 | 1.5e-08 | 2.5e-06 |
| 11 | OLFM4 | olfactomedin 4 | 60982 | 10 | 9 | 9 | 0 | 3 | 4 | 2 | 0 | 1 | 0 | 6.2e-08 | 9.4e-06 |
| 12 | CHRNA1 | cholinergic receptor, nicotinic, alpha 1 (muscle) | 55117 | 6 | 6 | 6 | 0 | 2 | 0 | 0 | 2 | 2 | 0 | 1.2e-07 | 0.000016 |
| 13 | OR10Z1 | olfactory receptor, family 10, subfamily Z, member 1 | 50712 | 9 | 9 | 9 | 1 | 1 | 3 | 2 | 3 | 0 | 0 | 2.3e-07 | 3e-05 |
| 14 | PCDHGA3 | protocadherin gamma subfamily A, 3 | 122105 | 12 | 11 | 12 | 3 | 4 | 5 | 1 | 2 | 0 | 0 | 5.4e-07 | 0.000064 |
| 15 | THEMIS | 77473 | 8 | 8 | 8 | 0 | 5 | 2 | 1 | 0 | 0 | 0 | 1.4e-06 | 0.00016 | |
| 16 | DND1 | dead end homolog 1 (zebrafish) | 50800 | 4 | 4 | 1 | 2 | 0 | 0 | 0 | 0 | 4 | 0 | 3.2e-06 | 0.00034 |
| 17 | CLEC4F | C-type lectin domain family 4, member F | 69502 | 6 | 6 | 6 | 1 | 1 | 2 | 2 | 0 | 1 | 0 | 3.9e-06 | 0.00039 |
| 18 | FCRL2 | Fc receptor-like 2 | 59122 | 7 | 7 | 7 | 1 | 3 | 4 | 0 | 0 | 0 | 0 | 5.3e-06 | 0.00049 |
| 19 | FOXI1 | forkhead box I1 | 45005 | 5 | 5 | 5 | 1 | 1 | 2 | 1 | 1 | 0 | 0 | 6.4e-06 | 0.00056 |
| 20 | PCDHGA1 | protocadherin gamma subfamily A, 1 | 121583 | 8 | 8 | 8 | 3 | 0 | 7 | 0 | 1 | 0 | 0 | 6.8e-06 | 0.00057 |
| 21 | ABCB1 | ATP-binding cassette, sub-family B (MDR/TAP), member 1 | 148970 | 9 | 9 | 9 | 2 | 4 | 1 | 2 | 0 | 2 | 0 | 0.000013 | 0.001 |
| 22 | MEGF10 | multiple EGF-like-domains 10 | 131444 | 9 | 9 | 9 | 2 | 2 | 2 | 5 | 0 | 0 | 0 | 0.000014 | 0.001 |
| 23 | F2RL2 | coagulation factor II (thrombin) receptor-like 2 | 44276 | 5 | 5 | 5 | 0 | 1 | 2 | 1 | 1 | 0 | 0 | 0.000015 | 0.0011 |
| 24 | LSP1 | lymphocyte-specific protein 1 | 40652 | 5 | 5 | 5 | 0 | 2 | 2 | 0 | 0 | 1 | 0 | 0.000018 | 0.0013 |
| 25 | TRHDE | thyrotropin-releasing hormone degrading enzyme | 124301 | 11 | 9 | 11 | 2 | 2 | 4 | 0 | 5 | 0 | 0 | 0.000021 | 0.0014 |
| 26 | RBM10 | RNA binding motif protein 10 | 113954 | 5 | 5 | 5 | 1 | 0 | 0 | 0 | 0 | 5 | 0 | 0.000033 | 0.0021 |
| 27 | ZNF665 | zinc finger protein 665 | 77288 | 6 | 6 | 6 | 0 | 0 | 2 | 1 | 3 | 0 | 0 | 0.000043 | 0.0027 |
| 28 | ADH1B | alcohol dehydrogenase 1B (class I), beta polypeptide | 48750 | 6 | 6 | 6 | 0 | 2 | 4 | 0 | 0 | 0 | 0 | 5e-05 | 0.003 |
| 29 | RGS22 | regulator of G-protein signaling 22 | 147859 | 7 | 7 | 7 | 1 | 2 | 0 | 2 | 2 | 1 | 0 | 0.000074 | 0.0042 |
| 30 | DST | dystonin | 789876 | 18 | 16 | 18 | 1 | 1 | 8 | 6 | 1 | 2 | 0 | 0.000074 | 0.0042 |
| 31 | TKTL1 | transketolase-like 1 | 69055 | 4 | 4 | 4 | 1 | 0 | 0 | 2 | 0 | 2 | 0 | 0.000084 | 0.0045 |
| 32 | NRCAM | neuronal cell adhesion molecule | 152536 | 9 | 8 | 9 | 1 | 1 | 4 | 2 | 0 | 2 | 0 | 0.000085 | 0.0045 |
| 33 | TAP2 | transporter 2, ATP-binding cassette, sub-family B (MDR/TAP) | 90232 | 6 | 6 | 6 | 0 | 1 | 2 | 1 | 1 | 1 | 0 | 0.000088 | 0.0045 |
| 34 | WNK3 | WNK lysine deficient protein kinase 3 | 203681 | 7 | 6 | 7 | 0 | 3 | 1 | 1 | 0 | 2 | 0 | 0.00011 | 0.0055 |
| 35 | FCRL3 | Fc receptor-like 3 | 110546 | 8 | 8 | 8 | 3 | 0 | 4 | 2 | 1 | 1 | 0 | 0.00012 | 0.0055 |
Note:
N - number of sequenced bases in this gene across the individual set.
n - number of (nonsilent) mutations in this gene across the individual set.
npat - number of patients (individuals) with at least one nonsilent mutation.
nsite - number of unique sites having a non-silent mutation.
nsil - number of silent mutations in this gene across the individual set.
n1 - number of nonsilent mutations of type: A->T .
n2 - number of nonsilent mutations of type: C->(A/T) .
n3 - number of nonsilent mutations of type: A->(C/G) .
n4 - number of nonsilent mutations of type: C->G .
n5 - number of nonsilent mutations of type: indel+null .
null - mutation category that includes nonsense, frameshift, splice-site mutations
p_classic = p-value for the observed amount of nonsilent mutations being elevated in this gene
p_ns_s = p-value for the observed nonsilent/silent ratio being elevated in this gene
p = p-value (overall)
q = q-value, False Discovery Rate (Benjamini-Hochberg procedure)
In this analysis, COSMIC is used as a filter to increase power by restricting the territory of each gene. Cosmic version: v48.
Table 4. Get Full Table Significantly mutated genes (COSMIC territory only). To access the database please go to: COSMIC. Number of significant genes found: 1. Number of genes displayed: 10
| rank | gene | description | n | cos | n_cos | N_cos | cos_ev | p | q |
|---|---|---|---|---|---|---|---|---|---|
| 1 | ABCC10 | ATP-binding cassette, sub-family C (CFTR/MRP), member 10 | 0 | 0 | 0 | 0 | 0 | 1 | 1 |
| 2 | ACRBP | acrosin binding protein | 1 | 0 | 0 | 0 | 0 | 1 | 1 |
| 3 | ACTR1A | ARP1 actin-related protein 1 homolog A, centractin alpha (yeast) | 0 | 0 | 0 | 0 | 0 | 1 | 1 |
| 4 | ADA | adenosine deaminase | 1 | 0 | 0 | 0 | 0 | 1 | 1 |
| 5 | ADCY4 | adenylate cyclase 4 | 2 | 0 | 0 | 0 | 0 | 1 | 1 |
| 6 | ATP13A1 | ATPase type 13A1 | 2 | 0 | 0 | 0 | 0 | 1 | 1 |
| 7 | BRPF1 | bromodomain and PHD finger containing, 1 | 4 | 0 | 0 | 0 | 0 | 1 | 1 |
| 8 | BTAF1 | BTAF1 RNA polymerase II, B-TFIID transcription factor-associated, 170kDa (Mot1 homolog, S. cerevisiae) | 4 | 0 | 0 | 0 | 0 | 1 | 1 |
| 9 | C22orf24 | chromosome 22 open reading frame 24 | 0 | 0 | 0 | 0 | 0 | 1 | 1 |
| 10 | C6orf150 | chromosome 6 open reading frame 150 | 0 | 0 | 0 | 0 | 0 | 1 | 1 |
Note:
n - number of (nonsilent) mutations in this gene across the individual set.
cos = number of unique mutated sites in this gene in COSMIC
n_cos = overlap between n and cos.
N_cos = number of individuals times cos.
cos_ev = total evidence: number of reports in COSMIC for mutations seen in this gene.
p = p-value for seeing the observed amount of overlap in this gene)
q = q-value, False Discovery Rate (Benjamini-Hochberg procedure)
Table 5. Get Full Table Genes with Clustered Mutations
| num | gene | desc | n | mindist | npairs3 | npairs12 |
|---|---|---|---|---|---|---|
| 540 | NRAP | nebulin-related anchoring protein | 10 | 2 | 1 | 1 |
| 274 | FAT2 | FAT tumor suppressor homolog 2 (Drosophila) | 6 | 5 | 0 | 1 |
| 180 | COL7A1 | collagen, type VII, alpha 1 (epidermolysis bullosa, dystrophic, dominant and recessive) | 12 | 221 | 0 | 0 |
| 508 | MXRA5 | matrix-remodelling associated 5 | 14 | 248 | 0 | 0 |
| 830 | TLN1 | talin 1 | 6 | 460 | 0 | 0 |
| 213 | DNAH5 | dynein, axonemal, heavy chain 5 | 14 | 530 | 0 | 0 |
| 742 | SH3TC2 | SH3 domain and tetratricopeptide repeats 2 | 8 | 913 | 0 | 0 |
| 473 | MDN1 | MDN1, midasin homolog (yeast) | 5 | 927 | 0 | 0 |
| 621 | PDCD11 | programmed cell death 11 | 4 | 1401 | 0 | 0 |
| 1 | AAGAB | 2 | Inf | 0 | 0 |
Note:
n - number of mutations in this gene in the individual set.
mindist - distance (in aa) between closest pair of mutations in this gene
npairs3 - how many pairs of mutations are within 3 aa of each other.
npairs12 - how many pairs of mutations are within 12 aa of each other.
Table 6. Get Full Table A Ranked List of Significantly Mutated Genesets. (Source: MSigDB GSEA Cannonical Pathway Set).Number of significant genesets found: 74. Number of genesets displayed: 10
| rank | geneset | description | genes | N_genes | mut_tally | N | n | npat | nsite | nsil | n1 | n2 | n3 | n4 | n5 | n6 | p | q |
|---|---|---|---|---|---|---|---|---|---|---|---|---|---|---|---|---|---|---|
| 1 | HSA04530_TIGHT_JUNCTION | Genes involved in tight junction | ACTB, ACTG1, ACTN1, ACTN2, ACTN3, ACTN4, AKT1, AKT2, AKT3, AMOTL1, ASH1L, CASK, CDC42, CDK4, CGN, CLDN1, CLDN10, CLDN11, CLDN14, CLDN15, CLDN16, CLDN17, CLDN18, CLDN19, CLDN2, CLDN20, CLDN22, CLDN23, CLDN3, CLDN4, CLDN5, CLDN6, CLDN7, CLDN8, CLDN9, CRB3, CSDA, CSNK2A1, CSNK2A2, CSNK2B, CTNNA1, CTNNA2, CTNNA3, CTNNB1, CTTN, EPB41, EPB41L1, EPB41L2, EPB41L3, EXOC3, EXOC4, F11R, GNAI1, GNAI2, GNAI3, HCLS1, HRAS, IGSF5, INADL, JAM2, JAM3, KRAS, LLGL1, LLGL2, MAGI1, MAGI2, MAGI3, MLLT4, MPDZ, MPP5, MRAS, MRCL3, MRLC2, MYH1, MYH10, MYH11, MYH13, MYH14, MYH15, MYH2, MYH3, MYH4, MYH6, MYH7, MYH7B, MYH8, MYH9, MYL2, MYL5, MYL7, MYL8P, MYL9, MYLC2PL, MYLPF, NRAS, OCLN, PARD3, PARD6A, PARD6B, PARD6G, PPM1J, PPP2CA, PPP2CB, PPP2R1A, PPP2R1B, PPP2R2A, PPP2R2B, PPP2R2C, PPP2R3A, PPP2R3B, PPP2R4, PRKCA, PRKCB1, PRKCD, PRKCE, PRKCG, PRKCH, PRKCI, PRKCQ, PRKCZ, PTEN, RAB13, RAB3B, RHOA, RRAS, RRAS2, SPTAN1, SRC, SYMPK, TJAP1, TJP1, TJP2, TJP3, VAPA, YES1, ZAK | 13 | ACTN3(2), CDK4(1), EPB41L1(3), MYH1(16), MYH2(18), MYH4(8), MYH6(8), MYH8(15) | 1811589 | 71 | 56 | 71 | 23 | 18 | 34 | 10 | 2 | 7 | 0 | 6.7e-15 | 3.1e-12 |
| 2 | ARENRF2PATHWAY | Nrf1 and nrf2 are transcription factors that bind to antioxidant response elements (AREs), promoters of genes involved in oxidative damage control. | CREB1, FOS, FXYD2, JUN, KEAP1, MAFF, MAFG, MAFK, MAPK1, MAPK14, MAPK8, NFE2L2, PRKCA, PRKCB1 | 1 | KEAP1(24) | 73604 | 24 | 24 | 23 | 0 | 2 | 14 | 2 | 1 | 5 | 0 | 4.1e-14 | 9.8e-12 |
| 3 | HSA04514_CELL_ADHESION_MOLECULES | Genes involved in cell adhesion molecules (CAMs) | ALCAM, CADM1, CADM3, CD2, CD22, CD226, CD274, CD276, CD28, CD34, CD4, CD40, CD40LG, CD58, CD6, CD80, CD86, CD8A, CD8B, CD99, CDH1, CDH15, CDH2, CDH3, CDH4, CDH5, CLDN1, CLDN10, CLDN11, CLDN14, CLDN15, CLDN16, CLDN17, CLDN18, CLDN19, CLDN2, CLDN20, CLDN22, CLDN23, CLDN3, CLDN4, CLDN5, CLDN6, CLDN7, CLDN8, CLDN9, CNTN1, CNTN2, CNTNAP1, CNTNAP2, CTLA4, ESAM, F11R, GLG1, HLA-A, HLA-A29.1, HLA-B, HLA-C, HLA-DMA, HLA-DMB, HLA-DOA, HLA-DOB, HLA-DPA1, HLA-DPB1, HLA-DQA1, HLA-DQA2, HLA-DQB1, HLA-DQB2, HLA-DRA, HLA-DRB1, HLA-DRB3, HLA-DRB4, HLA-DRB5, HLA-E, HLA-F, HLA-G, ICAM1, ICAM2, ICAM3, ICOS, ICOSLG, ITGA4, ITGA6, ITGA8, ITGA9, ITGAL, ITGAM, ITGAV, ITGB1, ITGB2, ITGB7, ITGB8, JAM2, JAM3, L1CAM, MADCAM1, MAG, MPZ, MPZL1, NCAM1, NCAM2, NEGR1, NEO1, NFASC, NLGN1, NLGN2, NLGN3, NRCAM, NRXN1, NRXN2, NRXN3, OCLN, PDCD1, PDCD1LG2, PECAM1, PTPRC, PTPRF, PTPRM, PVR, PVRL1, PVRL2, PVRL3, SDC1, SDC2, SDC3, SDC4, SELE, SELL, SELP, SELPLG, SIGLEC1, SPN, VCAM1, VCAN | 16 | CD22(2), CDH1(2), CDH3(1), CDH5(2), CNTN1(7), ITGAL(7), NLGN2(3), NRCAM(9), PTPRC(11), PVRL1(1) | 1551279 | 45 | 38 | 45 | 18 | 13 | 15 | 6 | 3 | 8 | 0 | 5.4e-12 | 7.1e-10 |
| 4 | BLYMPHOCYTEPATHWAY | B cells express the major histocompatibility complex (class II MHC), immunoglobulins, adhesion proteins, and other factors on their cell surface. | CD80, CR1, CR2, FCGR2B, HLA-DRA, HLA-DRB1, ICAM1, ITGAL, ITGB2, PTPRC, TNFRSF5 | 2 | ITGAL(7), PTPRC(11) | 291192 | 18 | 16 | 18 | 4 | 8 | 4 | 3 | 0 | 3 | 0 | 9e-12 | 7.1e-10 |
| 5 | TCYTOTOXICPATHWAY | Cytotoxic T cells release perforin and granzyme to lyse foreign cell targets and express Fas ligand to promote Fas-induced apoptosis. | CD2, CD28, CD3D, CD3E, CD3G, CD3Z, CD8A, ICAM1, ITGAL, ITGB2, PTPRC, THY1, TRA@, TRB@ | 2 | ITGAL(7), PTPRC(11) | 291192 | 18 | 16 | 18 | 4 | 8 | 4 | 3 | 0 | 3 | 0 | 9e-12 | 7.1e-10 |
| 6 | THELPERPATHWAY | Helper T cells coordinate the actions of B cells, macrophages, and other immune cells via surface molecules such as T cell receptor/CD3 and their characteristic marker CD4. | CD2, CD28, CD3D, CD3E, CD3G, CD3Z, CD4, ICAM1, ITGAL, ITGB2, PTPRC, THY1, TRA@, TRB@ | 2 | ITGAL(7), PTPRC(11) | 291192 | 18 | 16 | 18 | 4 | 8 | 4 | 3 | 0 | 3 | 0 | 9e-12 | 7.1e-10 |
| 7 | CARDIACEGFPATHWAY | Cardiac hypertrophy, a response to high blood pressure, is stimulated by GPCR ligands such as angiotensin II that activate the EGF pathway. | ADAM12, AGT, AGTR2, ARHA, EDN1, EDNRA, EDNRB, EGF, EGFR, FOS, HRAS, JUN, MYC, NFKB1, PLCG1, PRKCA, PRKCB1, RELA | 1 | EGFR(11) | 149027 | 11 | 10 | 6 | 1 | 0 | 4 | 5 | 2 | 0 | 0 | 7.4e-11 | 3.2e-09 |
| 8 | CBLPATHWAY | Activated EGF receptors undergo endocytosis into clathrin-coated vesicles, where they are recycled to the membrane or ubiquitinated by Cbl. | CBL, CSF1R, EGF, EGFR, GRB2, MET, PDGFRA, PRKCA, PRKCB1, SH3GLB1, SH3GLB2, SH3KBP1, SRC | 1 | EGFR(11) | 149027 | 11 | 10 | 6 | 1 | 0 | 4 | 5 | 2 | 0 | 0 | 7.4e-11 | 3.2e-09 |
| 9 | EEA1PATHWAY | The FYVE-finger proteins EEA1 and HRS are localized to endosome membranes and regulate sorting and ubiquitination in the vesicle transport system. | EEA1, EGF, EGFR, HGS, RAB5A, TF, TFRC | 1 | EGFR(11) | 149027 | 11 | 10 | 6 | 1 | 0 | 4 | 5 | 2 | 0 | 0 | 7.4e-11 | 3.2e-09 |
| 10 | ERBB3PATHWAY | Neuregulins bind to the receptor tyrosine kinases ErbB3 and ErbB4, surface-localized receptors whose overexpression induces tumor formation. | EGF, EGFR, ERBB3, NRG1, UBE2D1 | 1 | EGFR(11) | 149027 | 11 | 10 | 6 | 1 | 0 | 4 | 5 | 2 | 0 | 0 | 7.4e-11 | 3.2e-09 |
Table 7. Get Full Table A Ranked List of Significantly Mutated Genesets (Excluding Significantly Mutated Genes). Number of significant genesets found: 0. Number of genesets displayed: 10
| rank | geneset | description | genes | N_genes | mut_tally | N | n | npat | nsite | nsil | n1 | n2 | n3 | n4 | n5 | n6 | p | q |
|---|---|---|---|---|---|---|---|---|---|---|---|---|---|---|---|---|---|---|
| 1 | SALMONELLAPATHWAY | Salmonella induces membrane ruffling in infected cells via bacterial proteins including SipA, SipC, and SopE, which alter actin structure. | ACTA1, ACTR2, ACTR3, ARPC1A, ARPC1B, ARPC2, ARPC3, ARPC4, CDC42, RAC1, WASF1, WASL | 2 | WASF1(3), WASL(2) | 143371 | 5 | 5 | 5 | 0 | 0 | 1 | 0 | 3 | 1 | 0 | 0.021 | 1 |
| 2 | HSA04664_FC_EPSILON_RI_SIGNALING_PATHWAY | Genes involved in Fc epsilon RI signaling pathway | AKT1, AKT2, AKT3, BTK, CSF2, FCER1A, FCER1G, FYN, GAB2, GRB2, HRAS, IL13, IL3, IL4, IL5, INPP5D, KRAS, LAT, LCP2, LYN, MAP2K1, MAP2K2, MAP2K3, MAP2K4, MAP2K6, MAP2K7, MAPK1, MAPK10, MAPK11, MAPK12, MAPK13, MAPK14, MAPK3, MAPK8, MAPK9, MS4A2, NRAS, PDK1, PIK3CA, PIK3CB, PIK3CD, PIK3CG, PIK3R1, PIK3R2, PIK3R3, PIK3R5, PLA2G10, PLA2G12A, PLA2G12B, PLA2G1B, PLA2G2A, PLA2G2D, PLA2G2E, PLA2G2F, PLA2G3, PLA2G4A, PLA2G5, PLA2G6, PLCG1, PLCG2, PRKCA, PRKCB1, PRKCD, PRKCE, RAC1, RAC2, RAC3, RAF1, SOS1, SOS2, SYK, TNF, VAV1, VAV2, VAV3 | 4 | LYN(2), MAP2K6(1), PIK3R5(4) | 259509 | 7 | 7 | 7 | 3 | 2 | 2 | 2 | 1 | 0 | 0 | 0.023 | 1 |
| 3 | VALINE_LEUCINE_AND_ISOLEUCINE_BIOSYNTHESIS | BCAT1, IARS, LARS, LARS2, PDHA1, PDHA2, PDHB | 1 | LARS(5) | 146161 | 5 | 5 | 5 | 0 | 1 | 2 | 1 | 1 | 0 | 0 | 0.033 | 1 | |
| 4 | HSA04330_NOTCH_SIGNALING_PATHWAY | Genes involved in Notch signaling pathway | ADAM17, APH1A, CIR, CREBBP, CTBP1, CTBP2, DLL1, DLL3, DLL4, DTX1, DTX2, DTX3, DTX3L, DTX4, DVL1, DVL2, DVL3, EP300, GCN5L2, HDAC1, HDAC2, HES1, JAG1, JAG2, LFNG, LOC652788, MAML1, MAML2, MAML3, MFNG, NCOR2, NCSTN, NOTCH1, NOTCH2, NOTCH3, NOTCH4, NUMB, NUMBL, PCAF, PSEN1, PSEN2, PSENEN, PTCRA, RBPJ, RBPJL, RFNG, SNW1 | 4 | ADAM17(1), HDAC2(3), PSENEN(1), RBPJL(2) | 233940 | 7 | 7 | 7 | 1 | 2 | 3 | 1 | 1 | 0 | 0 | 0.039 | 1 |
| 5 | RIBOFLAVIN_METABOLISM | ACP1, ACP2, ACP5, ACPP, ACPT, ENPP1, ENPP3, FLAD1, RFK, TYR | 1 | ACP5(2) | 40619 | 2 | 2 | 2 | 0 | 0 | 2 | 0 | 0 | 0 | 0 | 0.039 | 1 | |
| 6 | G1PATHWAY | CDK4/6-cyclin D and CDK2-cyclin E phosphorylate Rb, which allows the transcription of genes needed for the G1/S cell cycle transition. | ABL1, ATM, ATR, CCNA1, CCND1, CCNE1, CDC2, CDC25A, CDK2, CDK4, CDK6, CDKN1A, CDKN1B, CDKN2A, CDKN2B, DHFR, E2F1, GSK3B, HDAC1, MADH3, MADH4, RB1, SKP2, TFDP1, TGFB1, TGFB2, TGFB3, TP53 | 2 | CDK4(1), SKP2(2) | 99971 | 3 | 3 | 3 | 1 | 0 | 2 | 0 | 1 | 0 | 0 | 0.041 | 1 |
| 7 | C21_STEROID_HORMONE_METABOLISM | AKR1C4, AKR1D1, CYP11A1, CYP11B1, CYP11B2, CYP17A1, CYP21A2, HSD11B1, HSD11B2, HSD3B1, HSD3B2 | 2 | CYP11B1(2), CYP11B2(2) | 130510 | 4 | 4 | 4 | 8 | 0 | 3 | 0 | 1 | 0 | 0 | 0.044 | 1 | |
| 8 | HSA00140_C21_STEROID_HORMONE_METABOLISM | Genes involved in C21-steroid hormone metabolism | AKR1C4, AKR1D1, CYP11A1, CYP11B1, CYP11B2, CYP17A1, CYP21A2, HSD11B1, HSD11B2, HSD3B1, HSD3B2 | 2 | CYP11B1(2), CYP11B2(2) | 130510 | 4 | 4 | 4 | 8 | 0 | 3 | 0 | 1 | 0 | 0 | 0.044 | 1 |
| 9 | HSA04630_JAK_STAT_SIGNALING_PATHWAY | Genes involved in Jak-STAT signaling pathway | AKT1, AKT2, AKT3, BCL2L1, CBL, CBLB, CBLC, CCND1, CCND2, CCND3, CISH, CLCF1, CNTF, CNTFR, CREBBP, CRLF2, CSF2, CSF2RA, CSF2RB, CSF3, CSF3R, CTF1, EP300, EPO, EPOR, GH1, GH2, GHR, GRB2, IFNA1, IFNA10, IFNA13, IFNA14, IFNA16, IFNA17, IFNA2, IFNA21, IFNA4, IFNA5, IFNA6, IFNA7, IFNA8, IFNAR1, IFNAR2, IFNB1, IFNE1, IFNG, IFNGR1, IFNGR2, IFNK, IFNW1, IL10, IL10RA, IL10RB, IL11, IL11RA, IL12A, IL12B, IL12RB1, IL12RB2, IL13, IL13RA1, IL13RA2, IL15, IL15RA, IL19, IL2, IL20, IL20RA, IL21, IL21R, IL22, IL22RA1, IL22RA2, IL23A, IL23R, IL24, IL26, IL28A, IL28B, IL28RA, IL29, IL2RA, IL2RB, IL2RG, IL3, IL3RA, IL4, IL4R, IL5, IL5RA, IL6, IL6R, IL6ST, IL7, IL7R, IL9, IL9R, IRF9, JAK1, JAK2, JAK3, LEP, LEPR, LIF, LIFR, MPL, MYC, OSM, OSMR, PIAS1, PIAS2, PIAS3, PIAS4, PIK3CA, PIK3CB, PIK3CD, PIK3CG, PIK3R1, PIK3R2, PIK3R3, PIK3R5, PIM1, PRL, PRLR, PTPN11, PTPN6, SOCS1, SOCS2, SOCS3, SOCS4, SOCS5, SOCS7, SOS1, SOS2, SPRED1, SPRED2, SPRY1, SPRY2, SPRY3, SPRY4, STAM, STAM2, STAT1, STAT2, STAT3, STAT4, STAT5A, STAT5B, STAT6, TPO, TSLP, TYK2 | 9 | EPOR(1), IFNA16(2), PIAS4(1), PIK3R5(4), TSLP(1) | 569379 | 9 | 9 | 9 | 1 | 3 | 3 | 1 | 0 | 2 | 0 | 0.046 | 1 |
| 10 | ALTERNATIVEPATHWAY | The alternative complement pathway is an antibody-independent mechanism of immune activation that results in cell lysis via the membrane attack complex. | BF, C3, C5, C6, C7, C8A, C9, DF, PFC | 1 | C9(3) | 68084 | 3 | 3 | 3 | 2 | 1 | 1 | 1 | 0 | 0 | 0 | 0.05 | 1 |
In brief, we tabulate the number of mutations and the number of covered bases for each gene. The counts are broken down by mutation context category: four context categories that are discovered by MutSig, and one for indel and 'null' mutations, which include indels, nonsense mutations, splice-site mutations, and non-stop (read-through) mutations. For each gene, we calculate the probability of seeing the observed constellation of mutations, i.e. the product P1 x P2 x ... x Pm, or a more extreme one, given the background mutation rates calculated across the dataset.[1]
This is an experimental feature. The full results of the analysis summarized in this report can be downloaded from the TCGA Data Coordination Center.