This pipeline infers putative direct gene targets of miRs based on miR and gene expression profiles across multiple samples.
This pipeline use a relevance network approach to infer putative miR:mRNA regulatory connections. All miR:mRNA pairs that have correlations < -0.3 and have predicted interactions in three sequence prediction databases (Miranda, Pictar, Targetscan) define the final network.
Figure 1. Get High-res Image Distribution of miR:gene pairs by the number of sequence prediction databases that predict an interaction between the two molecules. Miranda, Targetscan and Pictar are the three databases used in the analysis. Only miR:gene pairs that have correlation values less than the threshold are shown.
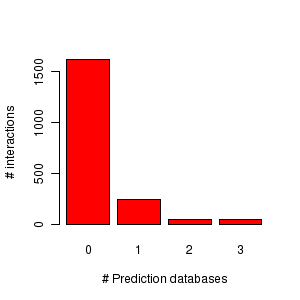
Figure 2. Get High-res Image Summary of miR counts by the number of associated genes in the putative direct target network

Figure 3. Get High-res Image Summary of gene counts by the number of associated miRs in the putative direct target network
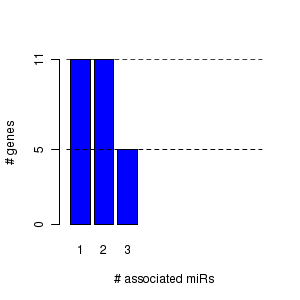
Table 1. Get Full Table List of miR:gene pairs with corr < -0.30 and prediction support in Miranda, Targetscan and Pictar
| miR | gene | corr | prediction databases | miranda | pictar | targetscan | total |
|---|---|---|---|---|---|---|---|
| hsa-mir-29b | MLLT11 | -0.46 | miranda,pictar,targetscan | 1 | 1 | 1 | 3 |
| hsa-mir-29b | TDG | -0.43 | miranda,pictar,targetscan | 1 | 1 | 1 | 3 |
| hsa-mir-29a | TDG | -0.43 | miranda,pictar,targetscan | 1 | 1 | 1 | 3 |
| hsa-mir-29a | MYBL2 | -0.42 | miranda,pictar,targetscan | 1 | 1 | 1 | 3 |
| hsa-mir-29b | MFAP2 | -0.41 | miranda,pictar,targetscan | 1 | 1 | 1 | 3 |
| hsa-mir-29a | DNMT3B | -0.4 | miranda,pictar,targetscan | 1 | 1 | 1 | 3 |
| hsa-mir-29a | MLLT11 | -0.4 | miranda,pictar,targetscan | 1 | 1 | 1 | 3 |
| hsa-mir-29b | VASH2 | -0.39 | miranda,pictar,targetscan | 1 | 1 | 1 | 3 |
| hsa-mir-29c | MFAP2 | -0.38 | miranda,pictar,targetscan | 1 | 1 | 1 | 3 |
| hsa-mir-29b | DNMT3B | -0.38 | miranda,pictar,targetscan | 1 | 1 | 1 | 3 |
Table 2. Get Full Table All miR hubs with their associated genes in the putative direct target network.
| Mir | Number.of.Genes | Genes |
|---|---|---|
| hsa-mir-29b | 18 | BLMH, COL2A1, COL4A2, DNMT3A, DNMT3B, EIF4E2, FAM130A1, GPX7, JARID2, MFAP2, MLLT11, MYBL2, TDG, TRIM37, TUBB, TUBB2B, VASH2,FSTL1 |
| hsa-mir-29a | 13 | BLMH, DNMT3A, DNMT3B, GPX7, JARID2, MFAP2, MLLT11, MYBL2, TDG, TRIM37, TUBB, VASH2,EIF4E2 |
| hsa-mir-29c | 7 | EIF4E2, GPX7, MFAP2, MLLT11, TUBB2B, VASH2,FSTL1 |
| hsa-mir-9 | 2 | LMNA,KCTD12 |
| hsa-mir-26b | 1 | TMEM2 |
| hsa-mir-183 | 1 | MEF2C |
| hsa-mir-18a | 1 | CRIM1 |
| hsa-mir-142-3p | 1 | HMGA2 |
| hsa-mir-182 | 1 | MMD |
| hsa-mir-200c | 1 | ZEB1 |
Table 3. Get Full Table All gene hubs with their associated miRs in the putative direct target network.
| Gene | Number.of.Mirs | Mirs |
|---|---|---|
| EIF4E2 | 3 | hsa-mir-29b, hsa-mir-29c,hsa-mir-29a |
| MFAP2 | 3 | hsa-mir-29b, hsa-mir-29c,hsa-mir-29a |
| GPX7 | 3 | hsa-mir-29b, hsa-mir-29c,hsa-mir-29a |
| VASH2 | 3 | hsa-mir-29b, hsa-mir-29c,hsa-mir-29a |
| MLLT11 | 3 | hsa-mir-29b, hsa-mir-29c,hsa-mir-29a |
| FSTL1 | 2 | hsa-mir-29c,hsa-mir-29b |
| MMD | 2 | hsa-mir-30c,hsa-mir-182 |
| DNMT3B | 2 | hsa-mir-29b,hsa-mir-29a |
| JARID2 | 2 | hsa-mir-29b,hsa-mir-29a |
| TDG | 2 | hsa-mir-29b,hsa-mir-29a |
This section should list the files that were used as input.
-
Level 3 miR expression file = /xchip/cga/gdac-prod/tcga-gdac/jobResults/GDAC_MergeDataFilesPipeline/OV/1216867/2.GDAC_MergeDataFiles.Finished/OV.mirna__h_mirna_8x15kv2__unc_edu__Level_3__unc_DWD_Batch_adjusted__data.data.txt
-
Level 3 gene expression file = /xchip/cga/gdac-prod/tcga-gdac/jobResults/GDAC_MergeDataFilesPipeline/OV/1216858/2.GDAC_MergeDataFiles.Finished/OV.transcriptome__ht_hg_u133a__broad_mit_edu__Level_3__gene_rma__data.data.txt
-
miR:gene predicted interactions file = /xchip/cga/reference/miR_predictions/human_interactions.predicted.v2.txt
-
Miranda = microrna.org Aug 2010 release, Microcosm version 5
-
Pictar = version 1
-
Targetscan = release 5.2
Pairwise Pearson correlations coefficients between all miR:gene pairs are first computed. All genes that have correlation values less than the user-defined threshold (-0.3) with a particular miR and have been predicted as targets of that miR in three sequence based prediction databases: Miranda[1][2] Pictar[3][4], TargetScan [5][6][7] are identified as putative direct targets of that miR. We infer a direct target miR:gene network which comprises all such putative direct associations.
-
threshold = -0.3
This is an experimental feature. The full results of the analysis summarized in this report can be downloaded from the TCGA Data Coordination Center.