GISTIC identifies genomic regions that are significantly gained or lost across a set of tumors. The pipeline first filters out normal samples from the segmented copy-number data by inspecting the TCGA barcodes and then executes GISTIC version 2.0.16 (cga svn revision 38839).
There were 85 tumor samples used in this analysis: 10 significant arm-level results, 2 significant focal amplifications, and 6 significant focal deletions were found.
Figure 1. Genomic positions of amplified regions: the X-axis represents the normalized amplification signals (top) and significance by Q value (bottom). The green line represents the significance cutoff at Q value=0.25.
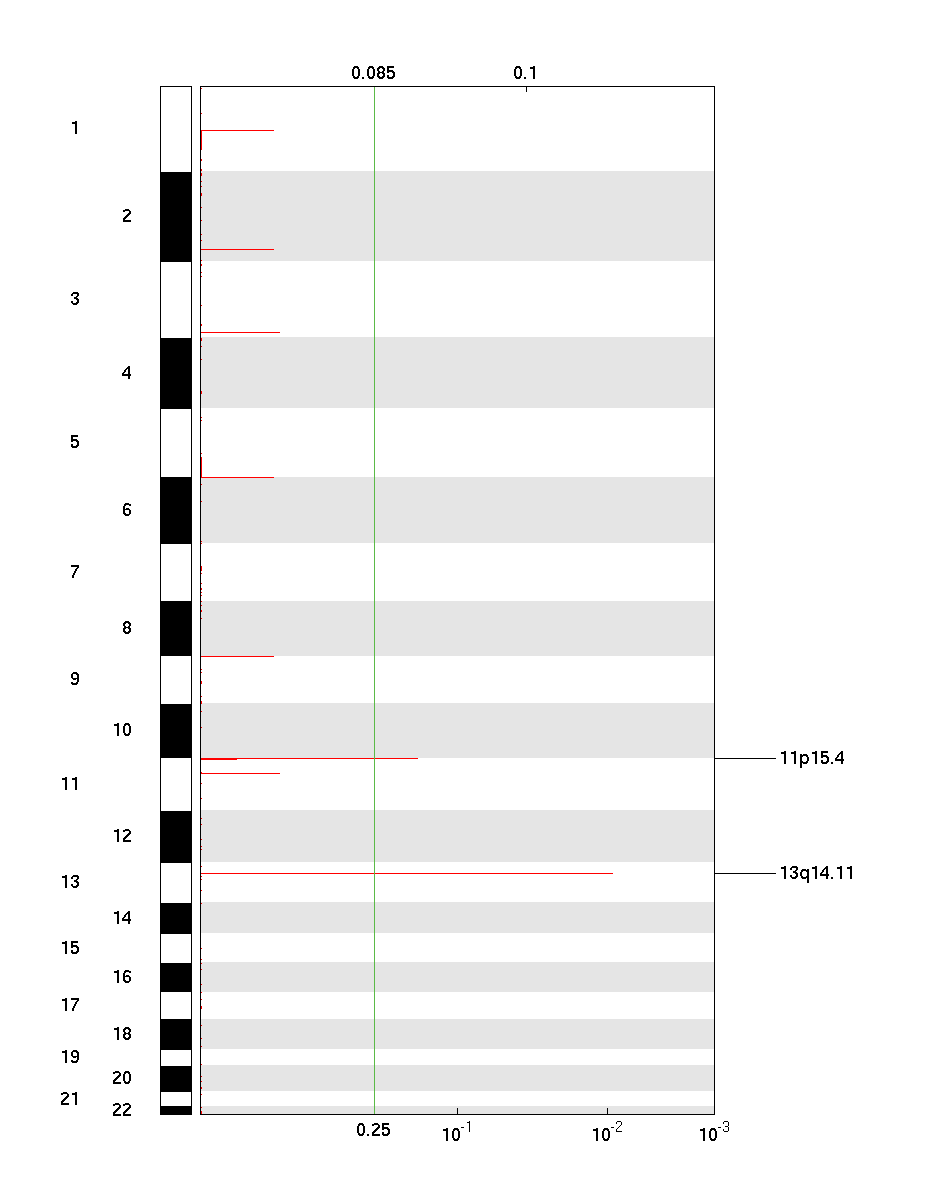
Table 1. Get Full Table Amplifications Table - 2 significant amplifications found. Click the link in the last column to view a comprehensive list of candidate genes. If no genes were identified within the peak, the nearest gene appears in brackets.
| Cytoband | Q value | Residual Q value | Wide Peak Boundaries | # Genes in Wide Peak |
|---|---|---|---|---|
| 13q14.11 | 0.0091372 | 0.0091372 | chr13:42429589-42688912 | 3 |
| 11p15.4 | 0.15982 | 0.15982 | chr11:3376079-3481387 | 1 |
This is the comprehensive list of amplified genes in the wide peak for 13q14.11.
Table S1. Genes in bold are cancer genes as defined by The Sanger Institute's Cancer Gene Census [7].
| Genes |
|---|
| DNAJC15 |
| ENOX1 |
| EPSTI1 |
This is the comprehensive list of amplified genes in the wide peak for 11p15.4.
Table S2. Genes in bold are cancer genes as defined by The Sanger Institute's Cancer Gene Census [7].
| Genes |
|---|
| LOC650368 |
Figure 2. Genomic positions of deleted regions: the X-axis represents the normalized deletion signals (top) and significance by Q value (bottom). The green line represents the significance cutoff at Q value=0.25.
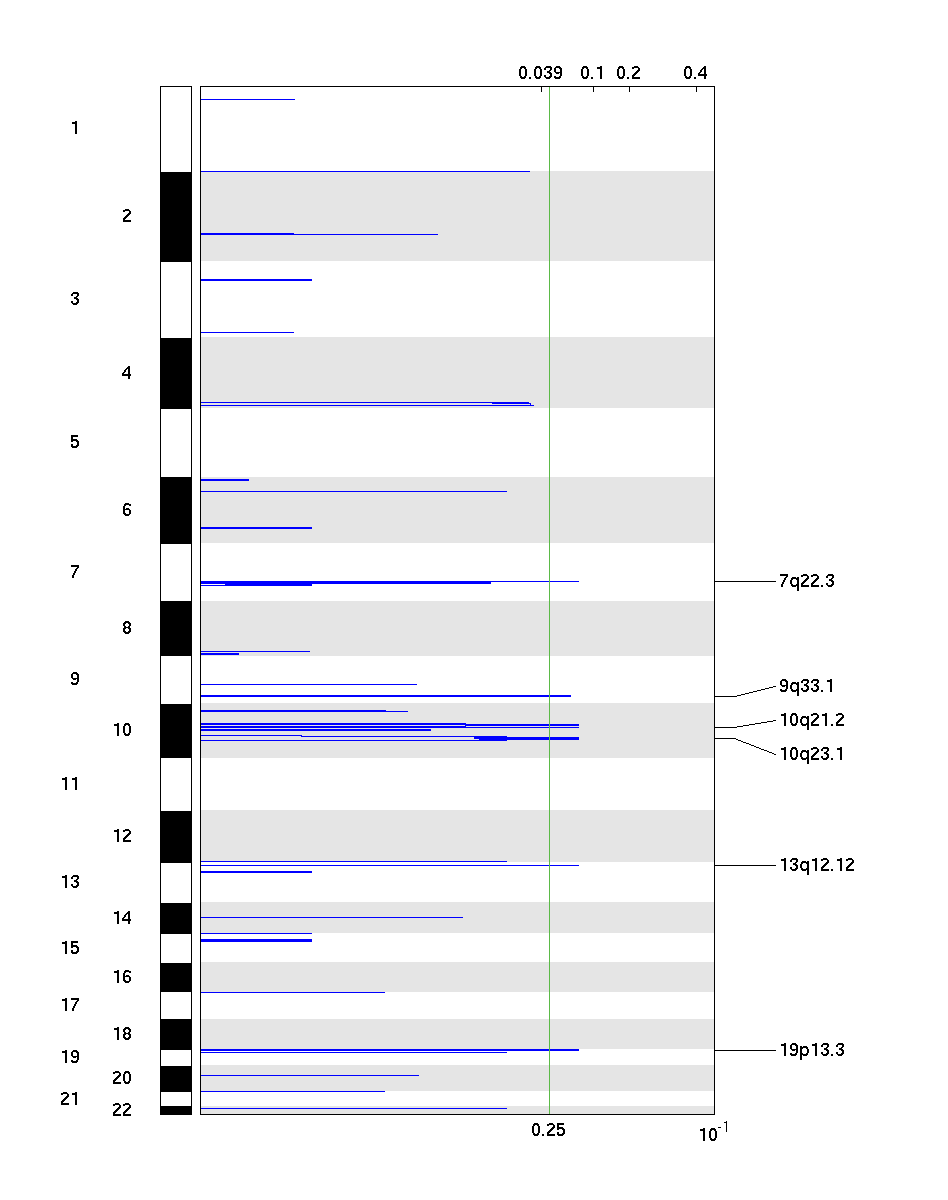
Table 2. Get Full Table Deletions Table - 6 significant deletions found. Click the link in the last column to view a comprehensive list of candidate genes. If no genes were identified within the peak, the nearest gene appears in brackets.
| Cytoband | Q value | Residual Q value | Wide Peak Boundaries | # Genes in Wide Peak |
|---|---|---|---|---|
| 7q22.3 | 0.21628 | 0.21628 | chr7:106587765-116611362 | 40 |
| 10q23.1 | 0.21628 | 0.21628 | chr10:82289828-94825202 | 74 |
| 10q21.2 | 0.21628 | 0.21628 | chr10:42596299-93781320 | 304 |
| 13q12.12 | 0.21628 | 0.21628 | chr13:23794594-24082673 | 2 |
| 19p13.3 | 0.21628 | 0.21628 | chr19:5774904-5865624 | 5 |
| 9q33.1 | 0.22496 | 0.22496 | chr9:1-140273252 | 890 |
This is the comprehensive list of deleted genes in the wide peak for 7q22.3.
Table S3. Genes in bold are cancer genes as defined by The Sanger Institute's Cancer Gene Census [7].
| Genes |
|---|
| MET |
| CAPZA2 |
| CAV1 |
| CAV2 |
| DLD |
| SLC26A3 |
| GPR22 |
| IFRD1 |
| LAMB1 |
| DNAJB9 |
| NRCAM |
| SLC26A4 |
| PPP1R3A |
| DOCK4 |
| COG5 |
| DUS4L |
| ZNF277 |
| TFEC |
| LAMB4 |
| TES |
| HBP1 |
| MDFIC |
| PNPLA8 |
| GPR85 |
| LRRN3 |
| BCAP29 |
| TMEM168 |
| CBLL1 |
| IMMP2L |
| ST7OT1 |
| ST7OT2 |
| FOXP2 |
| C7orf60 |
| C7orf66 |
| THAP5 |
| LOC286002 |
| C7orf53 |
| ST7OT4 |
| LOC401397 |
| EIF3IP1 |
This is the comprehensive list of deleted genes in the wide peak for 10q23.1.
Table S4. Genes in bold are cancer genes as defined by The Sanger Institute's Cancer Gene Census [7].
| Genes |
|---|
| BMPR1A |
| PTEN |
| hsa-mir-107 |
| hsa-mir-346 |
| ACTA2 |
| FAS |
| GLUD1 |
| GRID1 |
| HHEX |
| HTR7 |
| IDE |
| IFIT2 |
| IFIT1 |
| IFIT3 |
| KIF11 |
| LIPA |
| PPP1R3C |
| RGR |
| SNCG |
| LIPF |
| CH25H |
| BTAF1 |
| PAPSS2 |
| MINPP1 |
| KIF20B |
| RPP30 |
| NRG3 |
| C10orf116 |
| LDB3 |
| CPEB3 |
| WAPAL |
| IFIT5 |
| LRIT1 |
| ANKRD1 |
| GHITM |
| PANK1 |
| FAM190B |
| EXOC6 |
| FAM35A |
| MARCH5 |
| RNLS |
| STAMBPL1 |
| MMRN2 |
| TNKS2 |
| PCGF5 |
| ATAD1 |
| PCDH21 |
| OPN4 |
| ANKRD22 |
| NUDT9P1 |
| AGAP11 |
| LIPJ |
| CFLP1 |
| HECTD2 |
| FGFBP3 |
| FLJ37201 |
| LIPM |
| CYP26C1 |
| LRIT2 |
| SH2D4B |
| C10orf99 |
| SLC16A12 |
| MIR107 |
| LOC439994 |
| IFIT1L |
| MIR346 |
| FAM25A |
| LIPK |
| LIPN |
| FAM22A |
| FAM22D |
| LOC728190 |
| KILLIN |
| LOC100188947 |
This is the comprehensive list of deleted genes in the wide peak for 10q21.2.
Table S5. Genes in bold are cancer genes as defined by The Sanger Institute's Cancer Gene Census [7].
| Genes |
|---|
| BMPR1A |
| PRF1 |
| PTEN |
| RET |
| NCOA4 |
| MYST4 |
| hsa-mir-107 |
| hsa-mir-346 |
| hsa-mir-606 |
| hsa-mir-1254 |
| hsa-mir-1296 |
| hsa-mir-548f-1 |
| hsa-mir-605 |
| ACTA2 |
| ADK |
| ALOX5 |
| ANXA8L2 |
| ANK3 |
| ANXA2P3 |
| ANXA7 |
| ANXA11 |
| FAS |
| CAMK2G |
| CDC2 |
| CHAT |
| COL13A1 |
| DNA2 |
| EGR2 |
| EIF4EBP2 |
| ERCC6 |
| GDF2 |
| GDF10 |
| GLUD1 |
| GRID1 |
| HK1 |
| HNRNPF |
| HNRNPH3 |
| HTR7 |
| IFIT2 |
| IFIT1 |
| IFIT3 |
| KCNMA1 |
| LIPA |
| MAT1A |
| MBL2 |
| MSMB |
| NODAL |
| P4HA1 |
| PCBD1 |
| PLAU |
| PPA1 |
| PPP1R3C |
| PPP3CB |
| PPYR1 |
| SRGN |
| PRKG1 |
| MAPK8 |
| PSAP |
| RBP3 |
| RGR |
| RPS24 |
| CXCL12 |
| SFTPD |
| SLC18A3 |
| SNCG |
| SUPV3L1 |
| TACR2 |
| TFAM |
| UBE2D1 |
| VCL |
| VDAC2 |
| ZNF22 |
| ZNF32 |
| CCDC6 |
| SLC25A16 |
| ZNF239 |
| PARG |
| NDST2 |
| MBL1P1 |
| LIPF |
| SGPL1 |
| CH25H |
| BTAF1 |
| PAPSS2 |
| DDX21 |
| DLG5 |
| CHST3 |
| VPS26A |
| MINPP1 |
| KIF20B |
| SEC24C |
| GPRIN2 |
| BMS1 |
| SPOCK2 |
| RHOBTB1 |
| PPIF |
| HNRNPA3P1 |
| CBARA1 |
| TIMM23 |
| RPP30 |
| NRG3 |
| C10orf116 |
| C10orf10 |
| POLR3A |
| ZWINT |
| LDB3 |
| ECD |
| ZNF365 |
| DKK1 |
| KIAA0913 |
| WAPAL |
| DNAJC9 |
| CSTF2T |
| SIRT1 |
| TSPAN15 |
| IFIT5 |
| NUDT13 |
| HERC4 |
| PTPN20B |
| LRIT1 |
| KIAA1279 |
| AP3M1 |
| ANKRD1 |
| GHITM |
| KIAA1274 |
| CTNNA3 |
| A1CF |
| NRBF2 |
| NEUROG3 |
| ASCC1 |
| MRPS16 |
| DUSP13 |
| PANK1 |
| FXYD4 |
| FAM190B |
| FAM35A |
| DDIT4 |
| DNAJB12 |
| LRRC20 |
| SLC29A3 |
| RNLS |
| CSGALNACT2 |
| H2AFY2 |
| RUFY2 |
| FAM21B |
| CCAR1 |
| OGDHL |
| CISD1 |
| DNAJC12 |
| ASAH2 |
| SAR1A |
| ZMIZ1 |
| STAMBPL1 |
| WDFY4 |
| ARHGAP22 |
| MYOZ1 |
| CDH23 |
| PBLD |
| NPFFR1 |
| C10orf54 |
| PCDH15 |
| DDX50 |
| OR13A1 |
| MMRN2 |
| SYNPO2L |
| BICC1 |
| C10orf57 |
| HKDC1 |
| TET1 |
| TNKS2 |
| TSPAN14 |
| SYT15 |
| RASSF4 |
| C10orf11 |
| ARID5B |
| C10orf58 |
| DYDC2 |
| PCGF5 |
| PHYHIPL |
| PLA2G12B |
| MYPN |
| ZNF503 |
| AIFM2 |
| ADO |
| ATAD1 |
| LOC84989 |
| CCDC109A |
| PCDH21 |
| ANUBL1 |
| OPN4 |
| C10orf71 |
| CHCHD1 |
| ZMYND17 |
| TTC18 |
| ZNF488 |
| COMTD1 |
| ANKRD22 |
| AGAP4 |
| NUDT9P1 |
| AGAP11 |
| C10orf104 |
| ADAMTS14 |
| SAMD8 |
| LIPJ |
| CFLP1 |
| FRMPD2 |
| DYDC1 |
| EIF5AL1 |
| HECTD2 |
| FGFBP3 |
| USP54 |
| FAM170B |
| C10orf128 |
| FUT11 |
| OIT3 |
| ANTXRL |
| C10orf72 |
| LOC219347 |
| PLAC9 |
| C10orf107 |
| TMEM26 |
| ZCCHC24 |
| UNC5B |
| STOX1 |
| C10orf35 |
| TYSND1 |
| RTKN2 |
| C10orf27 |
| ATOH7 |
| SLC16A9 |
| FAM13C |
| MARCH8 |
| C10orf25 |
| ZNF485 |
| RASGEF1A |
| REEP3 |
| JMJD1C |
| IPMK |
| FAM21C |
| SGMS1 |
| PGBD3 |
| C10orf53 |
| FLJ37201 |
| C10orf40 |
| LOC283050 |
| FAM149B1 |
| DUPD1 |
| LIPM |
| LRIT2 |
| LRRTM3 |
| FAM21A |
| SH2D4B |
| C10orf99 |
| SLC16A12 |
| LOC399753 |
| BMS1P5 |
| MIR107 |
| C10orf105 |
| AGAP6 |
| C10orf55 |
| FAM35B |
| FAM35B2 |
| LOC439994 |
| IFIT1L |
| MIR346 |
| LRRC18 |
| LOC642361 |
| ZNF487 |
| LOC642826 |
| FAM25A |
| TMEM72 |
| LIPK |
| LIPN |
| FAM25C |
| DRGX |
| LOC650623 |
| PTPN20A |
| ANXA8 |
| AGAP7 |
| ASAH2B |
| SFTPA1 |
| SNORD98 |
| MIR605 |
| BMS1P1 |
| ANXA8L1 |
| FAM22A |
| FAM22D |
| LOC728190 |
| AGAP8 |
| LOC728407 |
| FRMPD2L2 |
| LOC728640 |
| LOC728643 |
| FRMPD2L1 |
| AGAP5 |
| BMS1P4 |
| SFTPA2 |
| LOC100128292 |
| C10orf41 |
| FAM25B |
| FAM25G |
| LOC100133308 |
| KILLIN |
| LOC100188947 |
This is the comprehensive list of deleted genes in the wide peak for 13q12.12.
Table S6. Genes in bold are cancer genes as defined by The Sanger Institute's Cancer Gene Census [7].
| Genes |
|---|
| PARP4 |
| LOC374491 |
This is the comprehensive list of deleted genes in the wide peak for 19p13.3.
Table S7. Genes in bold are cancer genes as defined by The Sanger Institute's Cancer Gene Census [7].
| Genes |
|---|
| FUT3 |
| FUT5 |
| FUT6 |
| NDUFA11 |
| VMAC |
This is the comprehensive list of deleted genes in the wide peak for 9q33.1.
Table S8. Genes in bold are cancer genes as defined by The Sanger Institute's Cancer Gene Census [7].
| Genes |
|---|
| ABL1 |
| FANCC |
| FANCG |
| GNAQ |
| JAK2 |
| MLLT3 |
| NFIB |
| NOTCH1 |
| OMD |
| PAX5 |
| RALGDS |
| SET |
| SYK |
| TAL2 |
| TSC1 |
| XPA |
| NR4A3 |
| BRD3 |
| NUP214 |
| FNBP1 |
| CD274 |
| hsa-mir-602 |
| hsa-mir-126 |
| hsa-mir-219-2 |
| hsa-mir-199b |
| hsa-mir-181b-2 |
| hsa-mir-601 |
| hsa-mir-600 |
| hsa-mir-147 |
| hsa-mir-455 |
| hsa-mir-32 |
| hsa-mir-1302-8 |
| hsa-mir-24-1 |
| hsa-let-7d |
| hsa-mir-7-1 |
| hsa-mir-204 |
| hsa-mir-1299 |
| hsa-mir-873 |
| hsa-mir-31 |
| hsa-mir-491 |
| hsa-mir-101-2 |
| hsa-mir-1302-2 |
| ABCA1 |
| ABCA2 |
| ABO |
| ACO1 |
| PLIN2 |
| AK1 |
| ALAD |
| ALDH1A1 |
| ALDH1B1 |
| ALDOB |
| AMBP |
| ANXA1 |
| ANXA2P2 |
| NUDT2 |
| APBA1 |
| AQP3 |
| AQP7 |
| ASS1 |
| AUH |
| BAAT |
| BAG1 |
| KLF9 |
| C5 |
| C8G |
| CA9 |
| CACNA1B |
| CCIN |
| CCBL1 |
| TNFSF8 |
| ENTPD2 |
| CD72 |
| CDK9 |
| CDKN2A |
| CDKN2B |
| CEL |
| CELP |
| CKS2 |
| CLTA |
| CNTFR |
| COL5A1 |
| COL15A1 |
| SLC31A1 |
| SLC31A2 |
| CRAT |
| CTSL1 |
| CTSL2 |
| CYLC2 |
| DAPK1 |
| DBC1 |
| DBH |
| SARDH |
| DNM1 |
| DMRT1 |
| ECM2 |
| TOR1A |
| LPAR1 |
| S1PR3 |
| MEGF9 |
| ELAVL2 |
| ENDOG |
| ENG |
| STOM |
| FBP1 |
| FKTN |
| FCN1 |
| FCN2 |
| FOXD4 |
| FOXE1 |
| MLANA |
| FPGS |
| FXN |
| NR5A1 |
| FUT7 |
| GALT |
| GAS1 |
| NR6A1 |
| GCNT1 |
| GGTA1 |
| B4GALT1 |
| GLDC |
| GLE1 |
| GNG10 |
| GOLGA1 |
| GOLGA2 |
| GPR21 |
| RAPGEF1 |
| GRIN1 |
| GSN |
| HNRNPK |
| HSD17B3 |
| DNAJA1 |
| HSPA5 |
| TNC |
| IARS |
| IFNA1 |
| IFNA2 |
| IFNA4 |
| IFNA5 |
| IFNA6 |
| IFNA7 |
| IFNA8 |
| IFNA10 |
| IFNA13 |
| IFNA14 |
| IFNA16 |
| IFNA17 |
| IFNA21 |
| IFNB1 |
| IFNW1 |
| IL11RA |
| INSL4 |
| LCN1 |
| LCN2 |
| LMX1B |
| MTAP |
| MUSK |
| NCBP1 |
| NDUFA8 |
| NDUFB6 |
| NFIL3 |
| NFX1 |
| NINJ1 |
| NPR2 |
| NTRK2 |
| ROR2 |
| ODF2 |
| OGN |
| ORM1 |
| ORM2 |
| PAEP |
| PAPPA |
| PDCL |
| PBX3 |
| PCSK5 |
| PGM5 |
| PHF2 |
| PPP2R4 |
| PPP3R2 |
| PPP6C |
| PRKACG |
| PRSS3 |
| PSMB7 |
| PSMD5 |
| PTCH1 |
| PTGDS |
| PTGS1 |
| PTPN3 |
| PTPRD |
| RAD23B |
| RFX3 |
| RGS3 |
| RLN1 |
| RLN2 |
| RMRP |
| RORB |
| RPL7A |
| RPL12 |
| RPS6 |
| RXRA |
| CCL19 |
| CCL21 |
| SH3GL2 |
| SHB |
| SLC1A1 |
| SMARCA2 |
| SNAPC3 |
| SNAPC4 |
| SPTAN1 |
| STXBP1 |
| SURF1 |
| SURF2 |
| SURF4 |
| MED22 |
| SURF6 |
| TEK |
| TESK1 |
| TGFBR1 |
| TLE1 |
| TLE4 |
| TLN1 |
| TLR4 |
| TMOD1 |
| TPM2 |
| TRAF1 |
| TRAF2 |
| TTF1 |
| TXN |
| TYRP1 |
| UGCG |
| VAV2 |
| VCP |
| VLDLR |
| CORO2A |
| ZFP37 |
| ZNF79 |
| ZNF189 |
| ZFAND5 |
| LHX3 |
| GFI1B |
| PIP5K1B |
| RECK |
| IKBKAP |
| CDC14B |
| TMEFF1 |
| SSNA1 |
| EDF1 |
| CTNNAL1 |
| MPDZ |
| FBP2 |
| DPM2 |
| FUBP3 |
| CLIC3 |
| PRPF4 |
| KLF4 |
| GTF3C5 |
| GTF3C4 |
| CER1 |
| LHX2 |
| PLAA |
| GRHPR |
| FAM189A2 |
| TJP2 |
| MED27 |
| PTGES |
| ATP6V1G1 |
| GABBR2 |
| GDA |
| GNA14 |
| RALGPS1 |
| ADAMTSL2 |
| RGP1 |
| TRIM14 |
| MELK |
| RUSC2 |
| KIAA0649 |
| SEC16A |
| ZBTB5 |
| KIAA0020 |
| TNFSF15 |
| ROD1 |
| GNE |
| SH2D3C |
| RCL1 |
| TOPORS |
| RABEPK |
| SIGMAR1 |
| LAMC3 |
| TUBB2C |
| UBAC1 |
| OLFM1 |
| ZER1 |
| CREB3 |
| UNC13B |
| SEMA4D |
| ANP32B |
| AGPAT2 |
| SPTLC1 |
| POMT1 |
| SMC2 |
| DMRT2 |
| RRAGA |
| ZBTB6 |
| NEK6 |
| SDCCAG3 |
| NOXA1 |
| CCL27 |
| USP20 |
| ACTL7B |
| ACTL7A |
| GADD45G |
| SPIN1 |
| SEC61B |
| SLC27A4 |
| SLC35D2 |
| CEP110 |
| WDR5 |
| C9orf9 |
| ADAMTS13 |
| C9orf7 |
| PSIP1 |
| INSL6 |
| SLC2A6 |
| PTENP1 |
| AKAP2 |
| RPL35 |
| MAN1B1 |
| DCTN3 |
| FRMPD1 |
| DOLK |
| ZNF510 |
| HABP4 |
| PTGR1 |
| TRIM32 |
| SETX |
| ERP44 |
| KDM4C |
| ZBTB43 |
| SMC5 |
| KANK1 |
| FAM120A |
| PMPCA |
| VPS13A |
| ASTN2 |
| AGTPBP1 |
| BICD2 |
| FKBP15 |
| KIAA1045 |
| KIAA0368 |
| EXOSC2 |
| FREQ |
| TDRD7 |
| SLC44A1 |
| ANGPTL2 |
| NUP188 |
| CCRK |
| DDX58 |
| RABGAP1 |
| TMEM2 |
| C9orf5 |
| C9orf4 |
| SLC24A2 |
| CIZ1 |
| DNAJB5 |
| DCAF12 |
| DFNB31 |
| COBRA1 |
| NIPSNAP3A |
| NELF |
| GPSM1 |
| LOC26102 |
| GAPVD1 |
| PHF19 |
| ZNF658 |
| FAM75A7 |
| FBXW2 |
| SPAG8 |
| OR1J4 |
| OR2K2 |
| FBXO10 |
| GBGT1 |
| LHX6 |
| OSTF1 |
| OR1L3 |
| OR1L1 |
| OR1J2 |
| SNORA65 |
| SNORD62A |
| SNORD36C |
| SNORD36B |
| SNORD36A |
| SNORD24 |
| RANBP6 |
| TRUB2 |
| DNAI1 |
| ST6GALNAC4 |
| INVS |
| NDOR1 |
| SIT1 |
| SPINK4 |
| TOR1B |
| TOR2A |
| METTL11A |
| PHPT1 |
| ANAPC2 |
| PKN3 |
| DPP7 |
| PSAT1 |
| UBQLN1 |
| SLC2A8 |
| OBP2B |
| OBP2A |
| ST6GALNAC6 |
| STOML2 |
| DEC1 |
| PCA3 |
| AK3 |
| EXOSC3 |
| FAM108B1 |
| MRPS2 |
| COQ4 |
| CERCAM |
| EGFL7 |
| C9orf53 |
| UBAP1 |
| GOLM1 |
| PRRX2 |
| C9orf114 |
| CHMP5 |
| C9orf156 |
| RAB14 |
| TMEM8B |
| C9orf78 |
| SHC3 |
| POLE3 |
| NANS |
| FBXW5 |
| MRPL50 |
| RC3H2 |
| EPB41L4B |
| C9orf11 |
| TBC1D13 |
| FAM22F |
| DIRAS2 |
| BNC2 |
| HAUS6 |
| ASPN |
| BSPRY |
| APTX |
| C9orf167 |
| CNTLN |
| TEX10 |
| LPPR1 |
| KIAA1797 |
| UBE2R2 |
| EXD3 |
| C9orf6 |
| C9orf95 |
| STX17 |
| NOL8 |
| C9orf68 |
| C9orf40 |
| TMEM38B |
| SMU1 |
| RFK |
| NIPSNAP3B |
| STRBP |
| TBC1D2 |
| HEMGN |
| KIF27 |
| CDC37L1 |
| DENND4C |
| C9orf86 |
| CDK5RAP2 |
| UBAP2 |
| C9orf46 |
| CBWD1 |
| KLHL9 |
| BARX1 |
| RNF20 |
| LRRC8A |
| INPP5E |
| NPDC1 |
| OR2S2 |
| BARHL1 |
| IFNK |
| SH3GLB2 |
| REXO4 |
| DOLPP1 |
| KIAA1161 |
| KCNT1 |
| KIAA1432 |
| KIAA1529 |
| ZBTB26 |
| GBA2 |
| DENND1A |
| GPR107 |
| SLC46A2 |
| C9orf27 |
| C9orf80 |
| ZNF462 |
| DMRT3 |
| PRDM12 |
| MAK10 |
| DMRTA1 |
| SLC28A3 |
| CARD9 |
| SUSD1 |
| POLR1E |
| IPPK |
| DDX31 |
| FAM129B |
| LRRC19 |
| MRPL41 |
| NOL6 |
| WNK2 |
| SECISBP2 |
| C9orf16 |
| MAPKAP1 |
| DCAF10 |
| ZCCHC6 |
| GALNT12 |
| EHMT1 |
| MOBKL2B |
| C9orf82 |
| CNTNAP3 |
| ERMP1 |
| SVEP1 |
| RMI1 |
| TRPM3 |
| PTGES2 |
| IFT74 |
| KIAA1539 |
| GKAP1 |
| PDCD1LG2 |
| AKNA |
| C9orf45 |
| URM1 |
| ISCA1 |
| DOCK8 |
| ARPC5L |
| HDHD3 |
| AIF1L |
| UCK1 |
| ZNF484 |
| FSD1L |
| CEP78 |
| ZCCHC7 |
| ANKRD20A1 |
| GARNL3 |
| HSDL2 |
| C9orf64 |
| C9orf89 |
| HIATL2 |
| C9orf125 |
| NTNG2 |
| HIATL1 |
| HINT2 |
| C9orf24 |
| PIGO |
| BAT2L |
| PPAPDC3 |
| C9orf70 |
| ZDHHC12 |
| FAM73B |
| C9orf100 |
| C9orf3 |
| FIBCD1 |
| KIAA1984 |
| SNHG7 |
| TMEM141 |
| C9orf37 |
| COL27A1 |
| ALG2 |
| FGD3 |
| FAM125B |
| TPD52L3 |
| WDR34 |
| C9orf140 |
| C9orf69 |
| LRSAM1 |
| IL33 |
| C9orf123 |
| C9orf30 |
| UAP1L1 |
| MCART1 |
| MRRF |
| RBM18 |
| ARRDC1 |
| WDR85 |
| ADAMTSL1 |
| LOC92973 |
| TMEM203 |
| KIF12 |
| PALM2 |
| SLC25A25 |
| WDR31 |
| ZNF618 |
| UHRF2 |
| FAM122A |
| ZMYND19 |
| GRIN3A |
| TMC1 |
| RNF183 |
| NACC2 |
| C9orf116 |
| C9orf41 |
| C9orf57 |
| C9orf85 |
| C9orf135 |
| LCN8 |
| FAM69B |
| PTRH1 |
| PIP5KL1 |
| TAF1L |
| PTPDC1 |
| ANKRD19 |
| ARID3C |
| C9orf23 |
| C9orf131 |
| OR13C5 |
| OR13C8 |
| OR13C3 |
| OR13C4 |
| OR13F1 |
| OR1L8 |
| OR1N2 |
| OR1N1 |
| ASB6 |
| TRPM6 |
| SLC34A3 |
| RNF38 |
| GLIPR2 |
| DAB2IP |
| CAMSAP1 |
| C9orf66 |
| NCRNA00032 |
| LINGO2 |
| NXNL2 |
| C9orf163 |
| MAMDC4 |
| LCN6 |
| C9orf98 |
| OR1Q1 |
| TTLL11 |
| RASEF |
| TTC39B |
| C9orf122 |
| RG9MTD3 |
| TTC16 |
| FAM120AOS |
| FAM154A |
| C9orf44 |
| FREM1 |
| KIAA2026 |
| LOC158376 |
| LOC158381 |
| ZNF483 |
| C9orf84 |
| KIAA1958 |
| TSTD2 |
| ZNF782 |
| PRUNE2 |
| C9orf96 |
| KCNV2 |
| OLFML2A |
| C9orf71 |
| QSOX2 |
| GLIS3 |
| LOC169834 |
| ZNF169 |
| C9orf21 |
| ZNF367 |
| C9orf91 |
| C9orf72 |
| C9orf93 |
| NAIF1 |
| C9orf25 |
| CCDC107 |
| ANKS6 |
| SUSD3 |
| CBWD5 |
| CDC26 |
| LOC253039 |
| PHYHD1 |
| MORN5 |
| OR1L4 |
| TXNDC8 |
| MAMDC2 |
| FRMD3 |
| C9orf43 |
| C9orf144B |
| NCRNA00094 |
| CRB2 |
| SCAI |
| C9orf117 |
| C9orf47 |
| C9orf79 |
| LOC286238 |
| LCN12 |
| C9orf142 |
| C9orf75 |
| TUSC1 |
| C9orf109 |
| FAM78A |
| C9orf150 |
| LOC286359 |
| OR13C9 |
| OR13D1 |
| LOC286367 |
| FOXD4L3 |
| IFNE |
| ZDHHC21 |
| ACER2 |
| LOC340508 |
| GPR144 |
| FLJ43950 |
| QRFP |
| OR1J1 |
| OR1B1 |
| KIF24 |
| IGFBPL1 |
| MURC |
| FOXD4L4 |
| GLT6D1 |
| ENHO |
| AQP7P1 |
| PTAR1 |
| C9orf102 |
| C9orf119 |
| C9orf50 |
| PNPLA7 |
| C9orf169 |
| ENTPD8 |
| ZNF322B |
| KGFLP1 |
| LOC389705 |
| C9orf144 |
| FAM75A6 |
| MGC21881 |
| AQP7P2 |
| FLJ43859 |
| FLJ44082 |
| FLJ46321 |
| LOC389765 |
| C9orf153 |
| LOC389791 |
| IER5L |
| C9orf171 |
| LCN15 |
| C9orf172 |
| LRRC26 |
| TMEM8C |
| C9orf128 |
| OR13J1 |
| CTSL3 |
| OR13C2 |
| OR1L6 |
| OR5C1 |
| OR1K1 |
| LCN9 |
| FAM102A |
| FLJ35024 |
| PTPLAD2 |
| TMEM215 |
| TOMM5 |
| FAM74A1 |
| FAM74A4 |
| ZNF658B |
| C9orf170 |
| CENPP |
| C9orf152 |
| SNX30 |
| WDR38 |
| LCNL1 |
| C9orf139 |
| FAM166A |
| LOC402377 |
| SOHLH1 |
| PPAPDC2 |
| ZBTB34 |
| MIRLET7A1 |
| MIRLET7D |
| MIRLET7F1 |
| MIR101-2 |
| MIR126 |
| MIR147 |
| MIR181A2 |
| MIR181B2 |
| MIR199B |
| MIR204 |
| MIR219-2 |
| MIR23B |
| MIR24-1 |
| MIR27B |
| MIR31 |
| MIR32 |
| MIR7-1 |
| C9orf106 |
| C9orf103 |
| LCN10 |
| LOC415056 |
| LOC440173 |
| LOC440839 |
| LOC440896 |
| SUGT1P |
| ANKRD20A3 |
| ANKRD20A2 |
| AQP7P3 |
| FAM75C1 |
| LOC441454 |
| LOC441455 |
| FAM22G |
| C9orf173 |
| NRARP |
| LOC442421 |
| FOXB2 |
| CBWD3 |
| C9orf129 |
| PALM2-AKAP2 |
| FAM27A |
| DNAJC25 |
| DNAJC25-GNG10 |
| LOC554202 |
| LOC572558 |
| MIR491 |
| PGM5P2 |
| MIR455 |
| FAM138F |
| FAM75A2 |
| LOC642313 |
| LOC642929 |
| FAM163B |
| FLJ40292 |
| TUBBP5 |
| CBWD6 |
| FAM138A |
| LOC645961 |
| HRCT1 |
| FAM75A1 |
| RPSAP9 |
| FOXD4L6 |
| FOXD4L5 |
| LOC653501 |
| KGFLP2 |
| FAM138C |
| SCARNA8 |
| SNORA17 |
| SNORA43 |
| SNORD62B |
| MSMP |
| SNORD90 |
| MIR548D1 |
| MIR600 |
| MIR601 |
| MIR602 |
| RNF208 |
| FAM75A3 |
| FAM75A5 |
| DNLZ |
| FAM74A3 |
| ANKRD20A4 |
| CCDC29 |
| FAM166B |
| FOXD4L2 |
| CDKN2BAS |
| SNORD121A |
| SNORD121B |
| SNORA84 |
| SNORA70C |
| MIR876 |
| MIR873 |
| LOC100128076 |
| C9orf110 |
| C9orf130 |
| LOC100129034 |
| LOC100129066 |
| LOC100130426 |
| LOC100131193 |
| FAM157B |
| FAM27C |
| FAM95B1 |
| FAM27B |
| LOC100133920 |
| RNU6ATAC |
| NCRNA00092 |
| LOC100272217 |
| WASH1 |
| LOC100289341 |
Table 3. Get Full Table Arm-level significance table - 10 significant results found.
| Arm | # Genes | Amp Frequency | Amp Z score | Amp Q value | Del Frequency | Del Z score | Del Q value |
|---|---|---|---|---|---|---|---|
| 1p | 1731 | 0.01 | -0.408 | 0.879 | 0.01 | -0.408 | 0.884 |
| 1q | 1572 | 0.04 | 1.3 | 0.38 | 0.01 | -0.354 | 0.884 |
| 2p | 753 | 0.00 | -1.11 | 0.879 | 0.02 | 0.675 | 0.884 |
| 2q | 1235 | 0.00 | -1.17 | 0.879 | 0.02 | 0.533 | 0.884 |
| 3p | 853 | 0.00 | -1.13 | 0.879 | 0.01 | -0.247 | 0.884 |
| 3q | 917 | 0.00 | -1.13 | 0.879 | 0.02 | 0.625 | 0.884 |
| 4p | 366 | 0.02 | 0.82 | 0.711 | 0.01 | -0.114 | 0.884 |
| 4q | 865 | 0.02 | 0.658 | 0.711 | 0.01 | -0.225 | 0.884 |
| 5p | 207 | 0.05 | 2.77 | 0.0843 | 0.00 | -1.03 | 0.884 |
| 5q | 1246 | 0.05 | 2.24 | 0.0981 | 0.00 | -1.16 | 0.884 |
| 6p | 937 | 0.01 | -0.253 | 0.879 | 0.01 | -0.253 | 0.884 |
| 6q | 692 | 0.00 | -1.11 | 0.879 | 0.02 | 0.695 | 0.884 |
| 7p | 508 | 0.04 | 1.68 | 0.227 | 0.00 | -1.08 | 0.884 |
| 7q | 1071 | 0.05 | 2.32 | 0.0981 | 0.00 | -1.14 | 0.884 |
| 8p | 495 | 0.00 | -1.09 | 0.879 | 0.01 | -0.168 | 0.884 |
| 8q | 697 | 0.00 | -1.11 | 0.879 | 0.01 | -0.213 | 0.884 |
| 9p | 343 | 0.01 | -0.109 | 0.879 | 0.02 | 0.828 | 0.884 |
| 9q | 916 | 0.01 | -0.224 | 0.879 | 0.04 | 1.53 | 0.791 |
| 10p | 312 | 0.01 | -0.113 | 0.879 | 0.01 | -0.113 | 0.884 |
| 10q | 1050 | 0.01 | -0.264 | 0.879 | 0.02 | 0.603 | 0.884 |
| 11p | 731 | 0.01 | -0.197 | 0.879 | 0.02 | 0.7 | 0.884 |
| 11q | 1279 | 0.01 | -0.298 | 0.879 | 0.04 | 1.4 | 0.791 |
| 12p | 484 | 0.04 | 1.69 | 0.227 | 0.00 | -1.07 | 0.884 |
| 12q | 1162 | 0.04 | 1.42 | 0.338 | 0.00 | -1.15 | 0.884 |
| 13q | 554 | 0.01 | -0.133 | 0.879 | 0.05 | 2.61 | 0.0887 |
| 14q | 1144 | 0.01 | -0.307 | 0.879 | 0.00 | -1.17 | 0.884 |
| 15q | 1132 | 0.00 | -1.17 | 0.879 | 0.01 | -0.305 | 0.884 |
| 16p | 719 | 0.02 | 0.686 | 0.711 | 0.00 | -1.11 | 0.884 |
| 16q | 562 | 0.01 | -0.183 | 0.879 | 0.00 | -1.1 | 0.884 |
| 17p | 575 | 0.05 | 2.63 | 0.0843 | 0.02 | 0.803 | 0.884 |
| 17q | 1321 | 0.05 | 2.24 | 0.0981 | 0.01 | -0.293 | 0.884 |
| 18p | 117 | 0.00 | -1.04 | 0.879 | 0.01 | -0.0777 | 0.884 |
| 18q | 340 | 0.00 | -1.07 | 0.879 | 0.01 | -0.132 | 0.884 |
| 19p | 870 | 0.01 | -0.251 | 0.879 | 0.00 | -1.13 | 0.884 |
| 19q | 1452 | 0.02 | 0.473 | 0.827 | 0.00 | -1.19 | 0.884 |
| 20p | 295 | 0.04 | 1.77 | 0.227 | 0.00 | -1.05 | 0.884 |
| 20q | 627 | 0.02 | 0.715 | 0.711 | 0.00 | -1.1 | 0.884 |
| 21q | 422 | 0.00 | -1.08 | 0.879 | 0.01 | -0.151 | 0.884 |
| 22q | 764 | 0.00 | -1.05 | 0.879 | 0.14 | 9.67 | 0 |
List of inputs used for this run of GISTIC2. All files listed should be included in the archived results.
-
Segmentation File = /xchip/cga/gdac-prod/tcga-gdac/jobResults/GDAC_MergeDataFilesPipeline/THCA/1217058/2.GDAC_MergeDataFiles.Finished/THCA.snp__genome_wide_snp_6__broad_mit_edu__Level_3__segmented_cna__seg.seg.txt
-
Markers File = /xchip/tcga/CancerGenomeAnalysisData/trunk/markerfiles/gistic_ovarian/broad.probes.txt
-
Reference Genome = /xchip/cga/reference/gistic/hg18_with_miR_20091116.mat
-
CNV Files = /xchip/cga/reference/gistic2/pan_TCGA_blood_uber_filter_list.Jan-07-2011.txt,/xchip/cga/reference/gistic2/xchip_tcga_gbm_analysis_mokelly_080429_convert_CNV_to_BED__CNV.verified_080606.combined.txt
-
Amplification Threshold = 0.30
-
Deletion Threshold = 0.30
-
Cap Values = 2.0
-
Broad Length Cutoff = 0.5
-
Remove X-Chromosome = 1
-
Confidence Level = 0.99
-
Join Segment Size = 10
-
Arm Level Peel Off = 1
-
Maximum Sample Segments = 10000
Table 4. Get Full Table First 10 out of 85 Input Tumor Samples.
| Tumor Sample Names |
|---|
| TCGA-BJ-A0YZ-01A-11D-A10T-01 |
| TCGA-BJ-A0Z0-01A-11D-A10T-01 |
| TCGA-BJ-A0Z2-01A-11D-A10T-01 |
| TCGA-BJ-A0Z3-01A-11D-A13V-01 |
| TCGA-BJ-A0Z5-01A-11D-A10T-01 |
| TCGA-BJ-A0Z9-01A-11D-A10T-01 |
| TCGA-BJ-A0ZA-01A-11D-A10T-01 |
| TCGA-BJ-A0ZB-01A-11D-A10T-01 |
| TCGA-BJ-A0ZC-01A-12D-A13V-01 |
| TCGA-BJ-A0ZE-01A-11D-A10T-01 |
Figure 3. Segmented copy number profiles in the input data
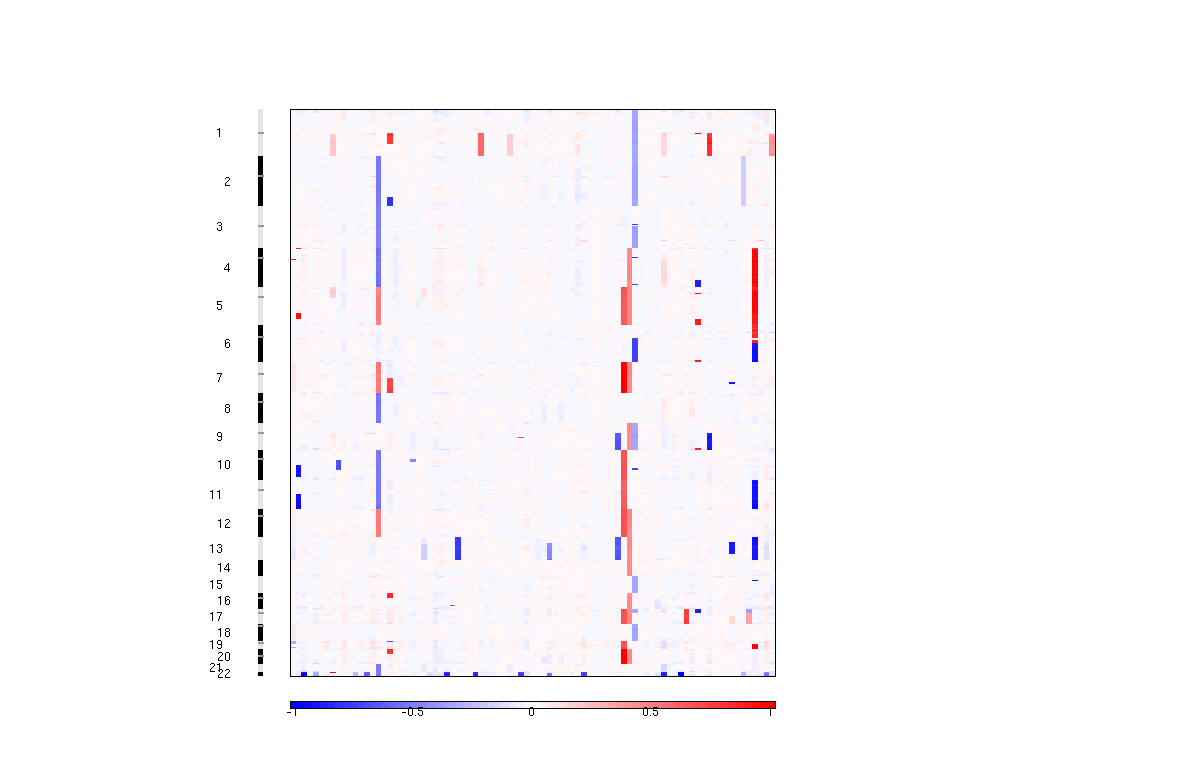
GISTIC identifies genomic regions that are significantly gained or lost across a set of tumors. It takes segmented copy number ratios as input, separates arm-level events from focal events, and then performs two tests: (i) identifies significantly amplified/deleted chromosome arms; and (ii) identifies regions that are significantly focally amplified or deleted. For the focal analysis, the significance levels (Q values) are calculated by comparing the observed gains/losses at each locus to those obtained by randomly permuting the events along the genome to reflect the null hypothesis that they are all 'passengers' and could have occurred anywhere. The locus-specific significance levels are then corrected for multiple hypothesis testing. The arm-level significance is calculated by comparing the frequency of gains/losses of each arm to the expected rate given its size. The method outputs genomic views of significantly amplified and deleted regions, as well as a table of genes with gain or loss scores. A more in depth discussion of the GISTIC algorithm and its utility is given in [1], [3], and [5].
Regions of the genome that are prone to germ line variations in copy number are excluded from the GISTIC analysis using a list of germ line copy number variations (CNVs). A CNV is a DNA sequence that may be found at different copy numbers in the germ line of two different individuals. Such germ line variations can confound a GISTIC analysis, which finds significant somatic copy number variations in cancer. A more in depth discussion is provided in [6]. GISTIC currently uses two CNV exclusion lists. One is based on the literature describing copy number variation, and a second one comes from an analysis of significant variations among the blood normals in the TCGA data set.
This is an experimental feature. The full results of the analysis summarized in this report can be downloaded from the TCGA Data Coordination Center.