This pipeline computes the correlation between cancer subtypes identified by different molecular patterns and selected clinical features.
Testing the association between subtypes identified by 7 different clustering approaches and 5 clinical features across 828 patients, 16 significant findings detected with P value < 0.05.
-
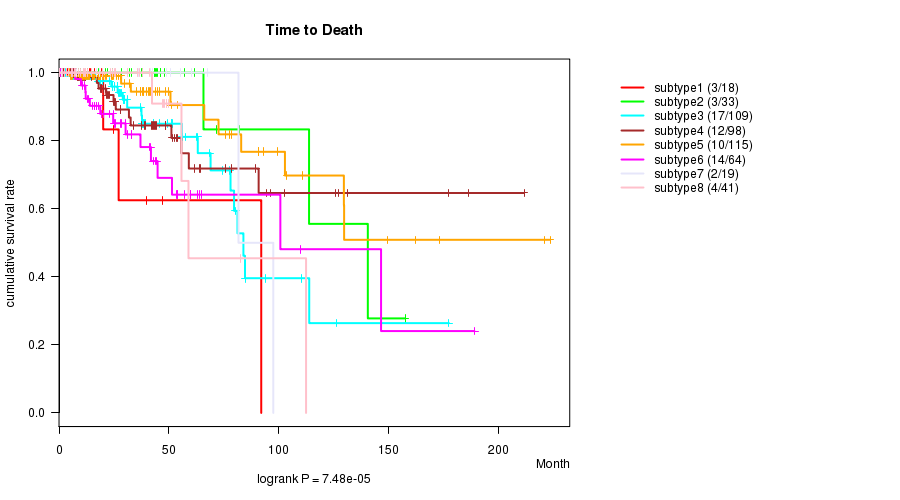
CNMF clustering analysis on array-based mRNA expression data identified 8 subtypes that correlate to 'Time to Death', 'AGE', and 'GENDER'.
-
Consensus hierarchical clustering analysis on array-based mRNA expression data identified 3 subtypes that correlate to 'AGE'.
-
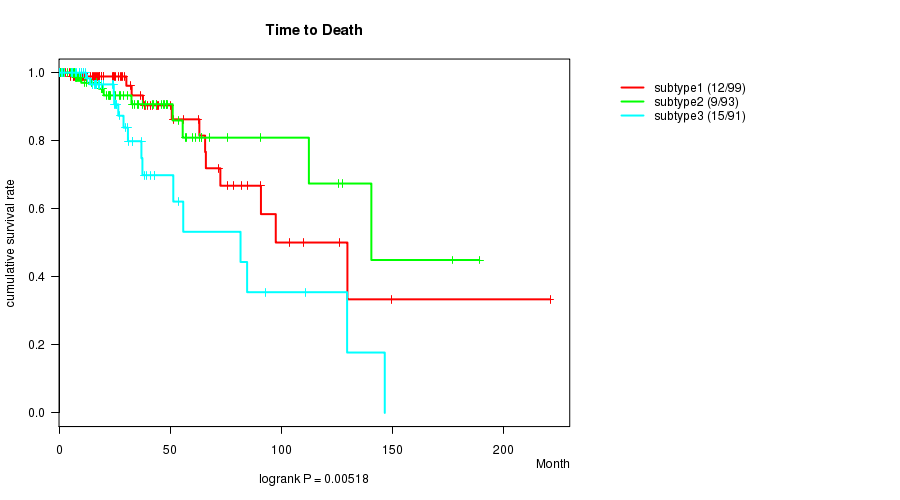
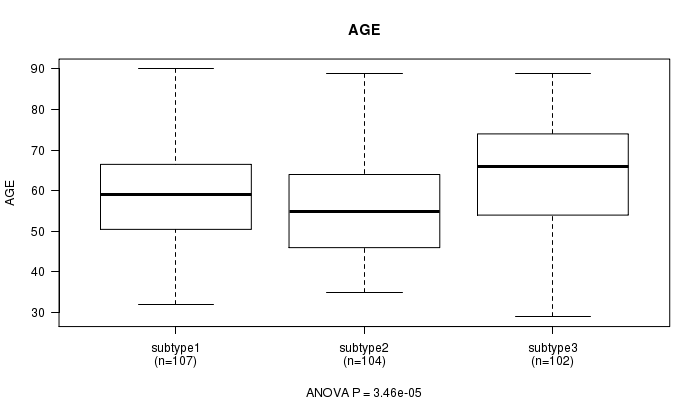
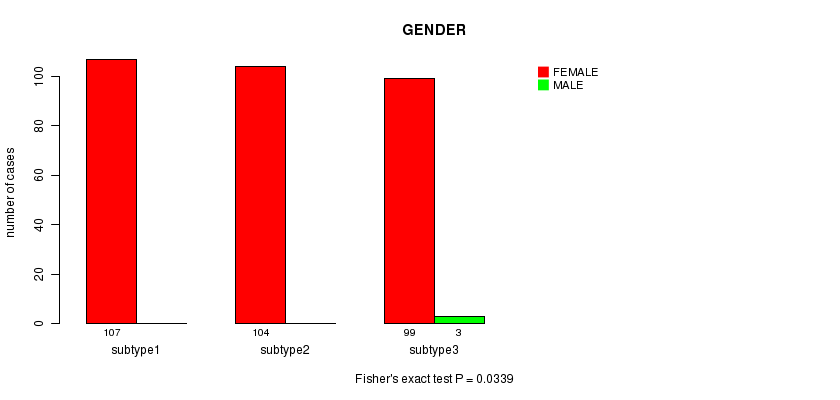
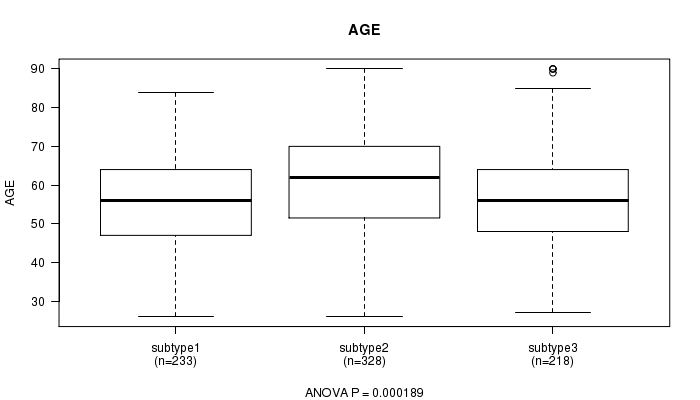
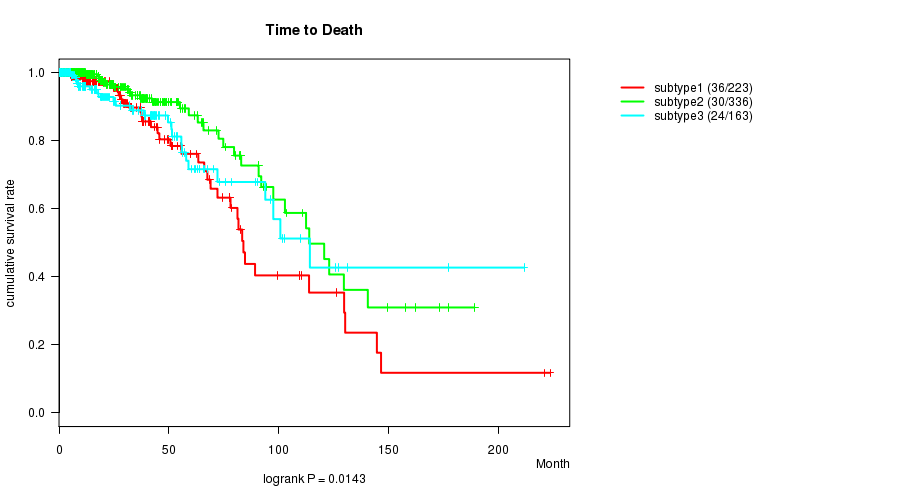
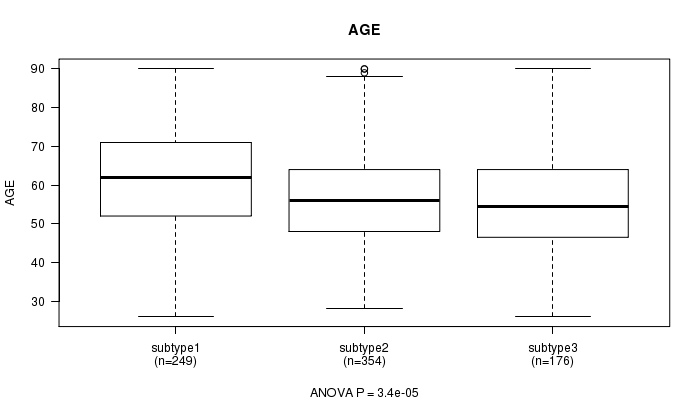
3 subtypes identified in current cancer cohort by 'METHLYATION CNMF'. These subtypes correlate to 'Time to Death', 'AGE', 'GENDER', 'RADIATIONS.RADIATION.REGIMENINDICATION', and 'NEOADJUVANT.THERAPY'.
-
CNMF clustering analysis on sequencing-based mRNA expression data identified 3 subtypes that correlate to 'AGE'.
-
Consensus hierarchical clustering analysis on sequencing-based mRNA expression data identified 3 subtypes that correlate to 'Time to Death', 'AGE', and 'GENDER'.
-
CNMF clustering analysis on sequencing-based miR expression data identified 3 subtypes that correlate to 'AGE'.
-
Consensus hierarchical clustering analysis on sequencing-based miR expression data identified 3 subtypes that correlate to 'Time to Death' and 'AGE'.
Table 1. Get Full Table Overview of the association between subtypes identified by 7 different clustering approaches and 5 clinical features. Shown in the table are P values from statistical tests. Thresholded by P value < 0.05, 16 significant findings detected.
|
Clinical Features |
Time to Death |
AGE | GENDER |
RADIATIONS RADIATION REGIMENINDICATION |
NEOADJUVANT THERAPY |
| Statistical Tests | logrank test | ANOVA | Fisher's exact test | Fisher's exact test | Fisher's exact test |
| mRNA CNMF subtypes | 7.48e-05 | 5.88e-06 | 0.0354 | 0.848 | 0.454 |
| mRNA cHierClus subtypes | 0.445 | 0.00183 | 0.323 | 0.224 | 0.323 |
| METHLYATION CNMF | 0.00518 | 3.46e-05 | 0.0339 | 0.0059 | 0.00153 |
| RNAseq CNMF subtypes | 0.215 | 0.0115 | 0.0875 | 0.285 | 0.214 |
| RNAseq cHierClus subtypes | 0.0273 | 0.00847 | 0.0266 | 0.127 | 0.0735 |
| MIRseq CNMF subtypes | 0.102 | 0.000189 | 0.296 | 0.63 | 0.367 |
| MIRseq cHierClus subtypes | 0.0143 | 3.4e-05 | 0.0666 | 0.574 | 0.446 |
Table S1. Get Full Table Description of clustering approach #1: 'mRNA CNMF subtypes'
| Cluster Labels | 1 | 2 | 3 | 4 | 5 | 6 | 7 | 8 |
|---|---|---|---|---|---|---|---|---|
| Number of samples | 20 | 34 | 117 | 103 | 120 | 73 | 20 | 42 |
P value = 7.48e-05 (logrank test)
Table S2. Clustering Approach #1: 'mRNA CNMF subtypes' versus Clinical Feature #1: 'Time to Death'
| nPatients | nDeath | Duration Range (Median), Month | |
|---|---|---|---|
| ALL | 497 | 65 | 0.1 - 223.4 (24.1) |
| subtype1 | 18 | 3 | 0.3 - 92.0 (14.2) |
| subtype2 | 33 | 3 | 0.1 - 157.4 (43.4) |
| subtype3 | 109 | 17 | 0.1 - 177.4 (25.1) |
| subtype4 | 98 | 12 | 0.1 - 211.5 (21.9) |
| subtype5 | 115 | 10 | 0.3 - 223.4 (19.0) |
| subtype6 | 64 | 14 | 0.1 - 189.0 (24.6) |
| subtype7 | 19 | 2 | 0.2 - 97.5 (36.3) |
| subtype8 | 41 | 4 | 0.3 - 112.4 (20.0) |
Figure S1. Get High-res Image Clustering Approach #1: 'mRNA CNMF subtypes' versus Clinical Feature #1: 'Time to Death'
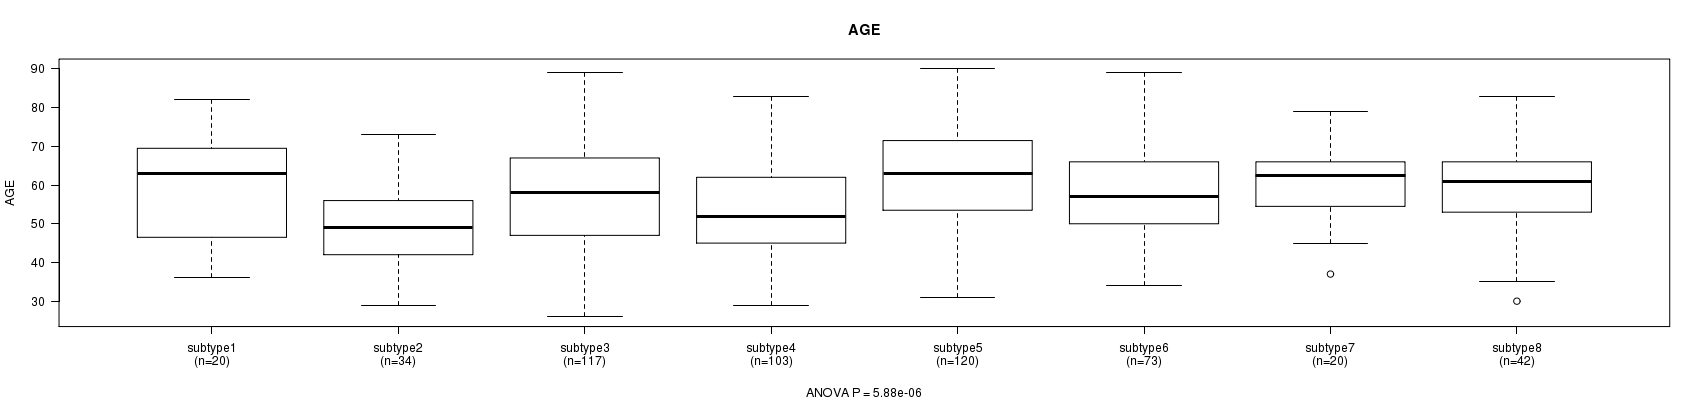
P value = 5.88e-06 (ANOVA)
Table S3. Clustering Approach #1: 'mRNA CNMF subtypes' versus Clinical Feature #2: 'AGE'
| nPatients | Mean (Std.Dev) | |
|---|---|---|
| ALL | 529 | 57.9 (13.2) |
| subtype1 | 20 | 59.6 (14.1) |
| subtype2 | 34 | 49.9 (10.1) |
| subtype3 | 117 | 58.0 (14.3) |
| subtype4 | 103 | 53.8 (12.6) |
| subtype5 | 120 | 62.0 (12.7) |
| subtype6 | 73 | 58.2 (12.7) |
| subtype7 | 20 | 60.4 (9.9) |
| subtype8 | 42 | 59.9 (12.8) |
Figure S2. Get High-res Image Clustering Approach #1: 'mRNA CNMF subtypes' versus Clinical Feature #2: 'AGE'
P value = 0.0354 (Chi-square test)
Table S4. Clustering Approach #1: 'mRNA CNMF subtypes' versus Clinical Feature #3: 'GENDER'
| nPatients | FEMALE | MALE |
|---|---|---|
| ALL | 523 | 6 |
| subtype1 | 19 | 1 |
| subtype2 | 34 | 0 |
| subtype3 | 113 | 4 |
| subtype4 | 103 | 0 |
| subtype5 | 120 | 0 |
| subtype6 | 73 | 0 |
| subtype7 | 19 | 1 |
| subtype8 | 42 | 0 |
Figure S3. Get High-res Image Clustering Approach #1: 'mRNA CNMF subtypes' versus Clinical Feature #3: 'GENDER'

P value = 0.848 (Chi-square test)
Table S5. Clustering Approach #1: 'mRNA CNMF subtypes' versus Clinical Feature #4: 'RADIATIONS.RADIATION.REGIMENINDICATION'
| nPatients | NO | YES |
|---|---|---|
| ALL | 382 | 147 |
| subtype1 | 17 | 3 |
| subtype2 | 25 | 9 |
| subtype3 | 86 | 31 |
| subtype4 | 69 | 34 |
| subtype5 | 86 | 34 |
| subtype6 | 54 | 19 |
| subtype7 | 15 | 5 |
| subtype8 | 30 | 12 |
Figure S4. Get High-res Image Clustering Approach #1: 'mRNA CNMF subtypes' versus Clinical Feature #4: 'RADIATIONS.RADIATION.REGIMENINDICATION'
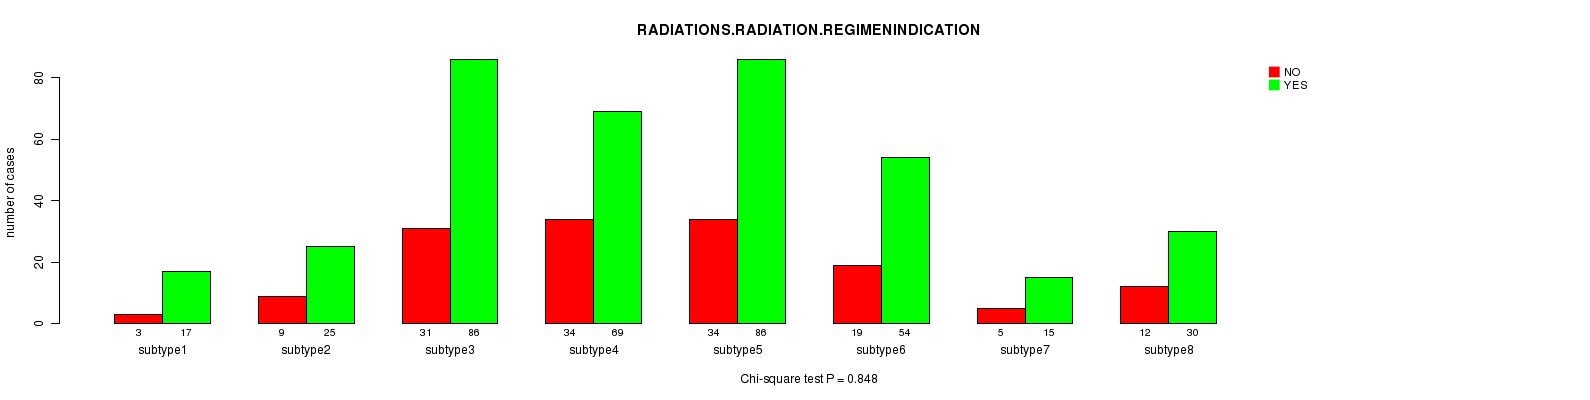
P value = 0.454 (Chi-square test)
Table S6. Clustering Approach #1: 'mRNA CNMF subtypes' versus Clinical Feature #5: 'NEOADJUVANT.THERAPY'
| nPatients | NO | YES |
|---|---|---|
| ALL | 308 | 221 |
| subtype1 | 15 | 5 |
| subtype2 | 18 | 16 |
| subtype3 | 66 | 51 |
| subtype4 | 55 | 48 |
| subtype5 | 71 | 49 |
| subtype6 | 47 | 26 |
| subtype7 | 14 | 6 |
| subtype8 | 22 | 20 |
Figure S5. Get High-res Image Clustering Approach #1: 'mRNA CNMF subtypes' versus Clinical Feature #5: 'NEOADJUVANT.THERAPY'
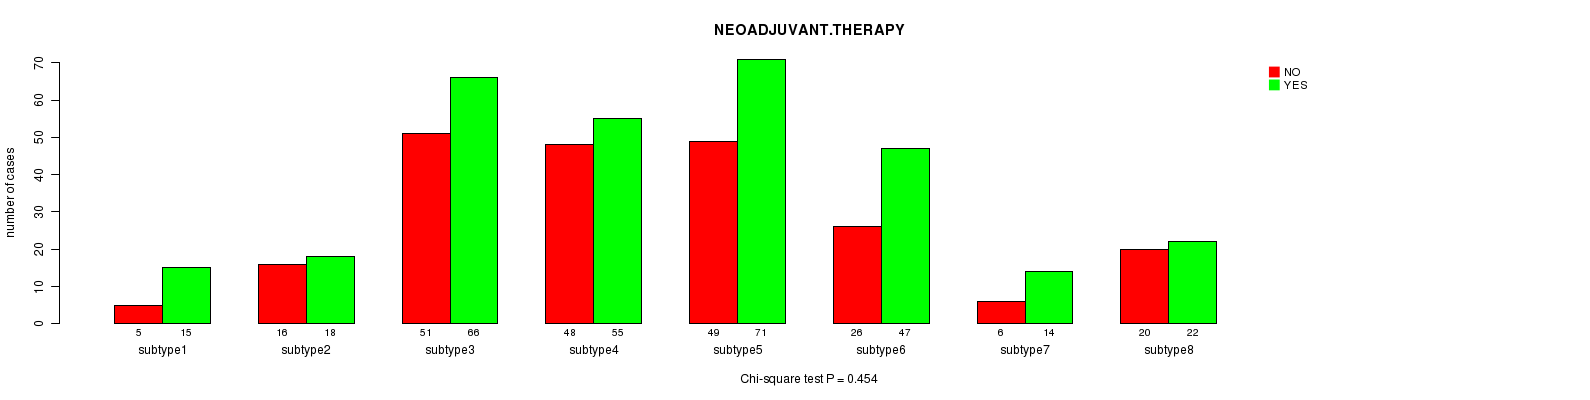
Table S7. Get Full Table Description of clustering approach #2: 'mRNA cHierClus subtypes'
| Cluster Labels | 1 | 2 | 3 |
|---|---|---|---|
| Number of samples | 129 | 136 | 264 |
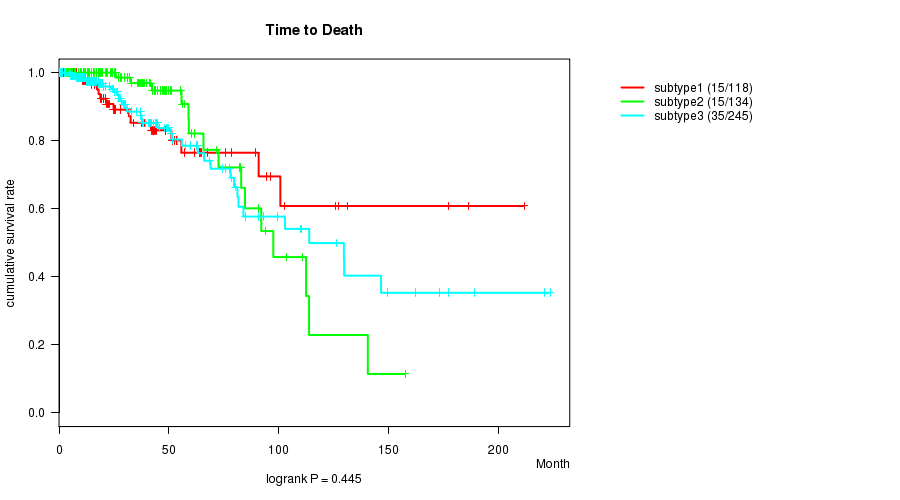
P value = 0.445 (logrank test)
Table S8. Clustering Approach #2: 'mRNA cHierClus subtypes' versus Clinical Feature #1: 'Time to Death'
| nPatients | nDeath | Duration Range (Median), Month | |
|---|---|---|---|
| ALL | 497 | 65 | 0.1 - 223.4 (24.1) |
| subtype1 | 118 | 15 | 0.1 - 211.5 (21.6) |
| subtype2 | 134 | 15 | 0.3 - 157.4 (27.6) |
| subtype3 | 245 | 35 | 0.1 - 223.4 (21.1) |
Figure S6. Get High-res Image Clustering Approach #2: 'mRNA cHierClus subtypes' versus Clinical Feature #1: 'Time to Death'
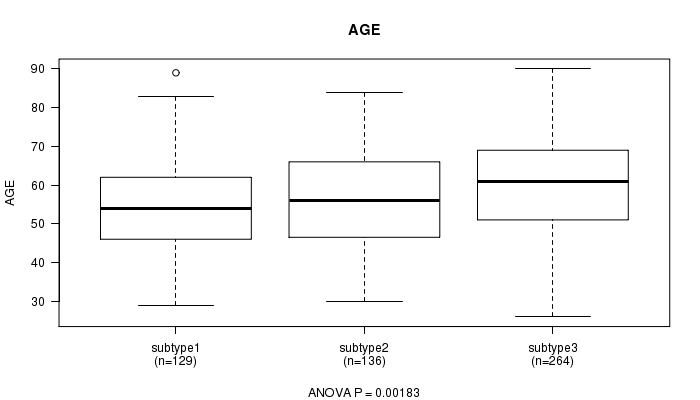
P value = 0.00183 (ANOVA)
Table S9. Clustering Approach #2: 'mRNA cHierClus subtypes' versus Clinical Feature #2: 'AGE'
| nPatients | Mean (Std.Dev) | |
|---|---|---|
| ALL | 529 | 57.9 (13.2) |
| subtype1 | 129 | 55.1 (12.6) |
| subtype2 | 136 | 56.8 (13.0) |
| subtype3 | 264 | 59.8 (13.4) |
Figure S7. Get High-res Image Clustering Approach #2: 'mRNA cHierClus subtypes' versus Clinical Feature #2: 'AGE'
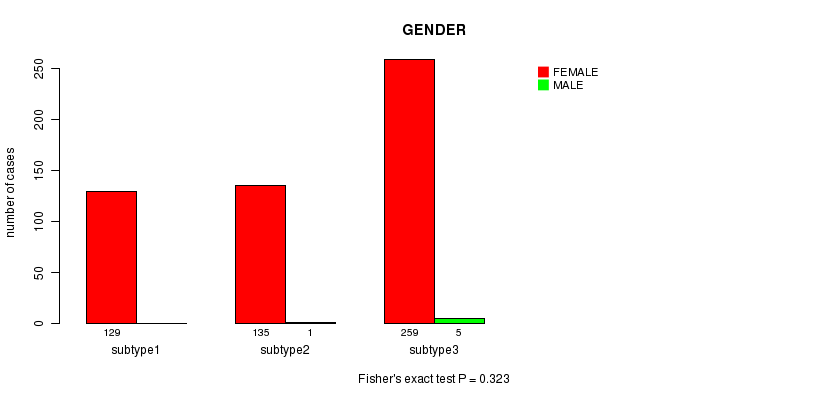
P value = 0.323 (Fisher's exact test)
Table S10. Clustering Approach #2: 'mRNA cHierClus subtypes' versus Clinical Feature #3: 'GENDER'
| nPatients | FEMALE | MALE |
|---|---|---|
| ALL | 523 | 6 |
| subtype1 | 129 | 0 |
| subtype2 | 135 | 1 |
| subtype3 | 259 | 5 |
Figure S8. Get High-res Image Clustering Approach #2: 'mRNA cHierClus subtypes' versus Clinical Feature #3: 'GENDER'
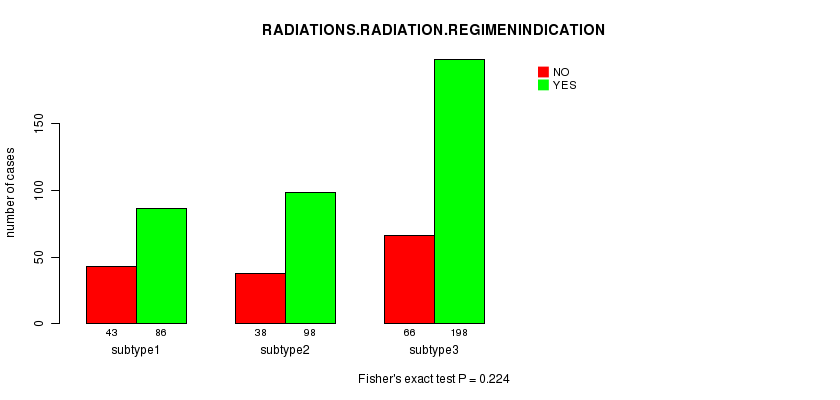
P value = 0.224 (Fisher's exact test)
Table S11. Clustering Approach #2: 'mRNA cHierClus subtypes' versus Clinical Feature #4: 'RADIATIONS.RADIATION.REGIMENINDICATION'
| nPatients | NO | YES |
|---|---|---|
| ALL | 382 | 147 |
| subtype1 | 86 | 43 |
| subtype2 | 98 | 38 |
| subtype3 | 198 | 66 |
Figure S9. Get High-res Image Clustering Approach #2: 'mRNA cHierClus subtypes' versus Clinical Feature #4: 'RADIATIONS.RADIATION.REGIMENINDICATION'
P value = 0.323 (Fisher's exact test)
Table S12. Clustering Approach #2: 'mRNA cHierClus subtypes' versus Clinical Feature #5: 'NEOADJUVANT.THERAPY'
| nPatients | NO | YES |
|---|---|---|
| ALL | 308 | 221 |
| subtype1 | 70 | 59 |
| subtype2 | 76 | 60 |
| subtype3 | 162 | 102 |
Figure S10. Get High-res Image Clustering Approach #2: 'mRNA cHierClus subtypes' versus Clinical Feature #5: 'NEOADJUVANT.THERAPY'
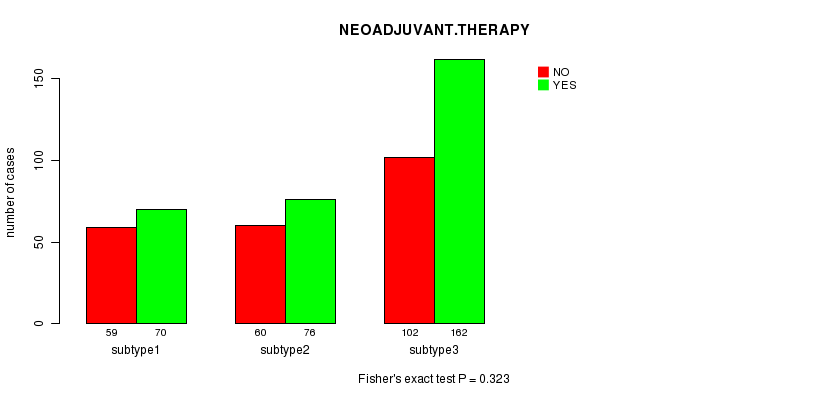
Table S13. Get Full Table Description of clustering approach #3: 'METHLYATION CNMF'
| Cluster Labels | 1 | 2 | 3 |
|---|---|---|---|
| Number of samples | 107 | 104 | 102 |
P value = 0.00518 (logrank test)
Table S14. Clustering Approach #3: 'METHLYATION CNMF' versus Clinical Feature #1: 'Time to Death'
| nPatients | nDeath | Duration Range (Median), Month | |
|---|---|---|---|
| ALL | 283 | 36 | 0.1 - 220.9 (19.0) |
| subtype1 | 99 | 12 | 0.6 - 220.9 (19.1) |
| subtype2 | 93 | 9 | 0.1 - 189.0 (22.0) |
| subtype3 | 91 | 15 | 0.1 - 146.5 (16.5) |
Figure S11. Get High-res Image Clustering Approach #3: 'METHLYATION CNMF' versus Clinical Feature #1: 'Time to Death'
P value = 3.46e-05 (ANOVA)
Table S15. Clustering Approach #3: 'METHLYATION CNMF' versus Clinical Feature #2: 'AGE'
| nPatients | Mean (Std.Dev) | |
|---|---|---|
| ALL | 313 | 59.5 (13.4) |
| subtype1 | 107 | 58.7 (13.3) |
| subtype2 | 104 | 55.7 (12.4) |
| subtype3 | 102 | 64.0 (13.2) |
Figure S12. Get High-res Image Clustering Approach #3: 'METHLYATION CNMF' versus Clinical Feature #2: 'AGE'
P value = 0.0339 (Fisher's exact test)
Table S16. Clustering Approach #3: 'METHLYATION CNMF' versus Clinical Feature #3: 'GENDER'
| nPatients | FEMALE | MALE |
|---|---|---|
| ALL | 310 | 3 |
| subtype1 | 107 | 0 |
| subtype2 | 104 | 0 |
| subtype3 | 99 | 3 |
Figure S13. Get High-res Image Clustering Approach #3: 'METHLYATION CNMF' versus Clinical Feature #3: 'GENDER'
P value = 0.0059 (Fisher's exact test)
Table S17. Clustering Approach #3: 'METHLYATION CNMF' versus Clinical Feature #4: 'RADIATIONS.RADIATION.REGIMENINDICATION'
| nPatients | NO | YES |
|---|---|---|
| ALL | 246 | 67 |
| subtype1 | 74 | 33 |
| subtype2 | 83 | 21 |
| subtype3 | 89 | 13 |
Figure S14. Get High-res Image Clustering Approach #3: 'METHLYATION CNMF' versus Clinical Feature #4: 'RADIATIONS.RADIATION.REGIMENINDICATION'

P value = 0.00153 (Fisher's exact test)
Table S18. Clustering Approach #3: 'METHLYATION CNMF' versus Clinical Feature #5: 'NEOADJUVANT.THERAPY'
| nPatients | NO | YES |
|---|---|---|
| ALL | 201 | 112 |
| subtype1 | 58 | 49 |
| subtype2 | 64 | 40 |
| subtype3 | 79 | 23 |
Figure S15. Get High-res Image Clustering Approach #3: 'METHLYATION CNMF' versus Clinical Feature #5: 'NEOADJUVANT.THERAPY'
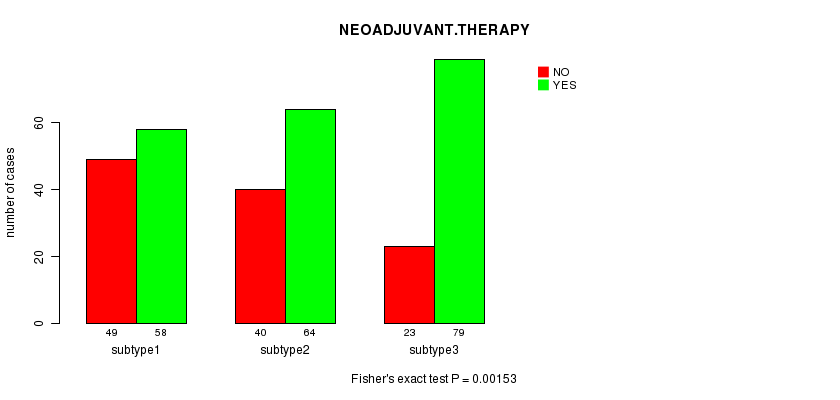
Table S19. Get Full Table Description of clustering approach #4: 'RNAseq CNMF subtypes'
| Cluster Labels | 1 | 2 | 3 |
|---|---|---|---|
| Number of samples | 215 | 131 | 431 |
P value = 0.215 (logrank test)
Table S20. Clustering Approach #4: 'RNAseq CNMF subtypes' versus Clinical Feature #1: 'Time to Death'
| nPatients | nDeath | Duration Range (Median), Month | |
|---|---|---|---|
| ALL | 723 | 89 | 0.0 - 223.4 (18.2) |
| subtype1 | 198 | 28 | 0.0 - 211.5 (17.6) |
| subtype2 | 126 | 13 | 0.3 - 157.4 (31.1) |
| subtype3 | 399 | 48 | 0.0 - 223.4 (17.0) |
Figure S16. Get High-res Image Clustering Approach #4: 'RNAseq CNMF subtypes' versus Clinical Feature #1: 'Time to Death'

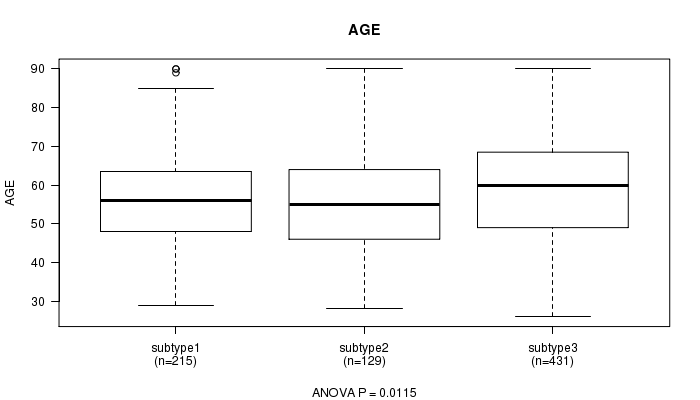
P value = 0.0115 (ANOVA)
Table S21. Clustering Approach #4: 'RNAseq CNMF subtypes' versus Clinical Feature #2: 'AGE'
| nPatients | Mean (Std.Dev) | |
|---|---|---|
| ALL | 775 | 57.8 (13.2) |
| subtype1 | 215 | 56.7 (12.7) |
| subtype2 | 129 | 55.7 (12.7) |
| subtype3 | 431 | 59.1 (13.5) |
Figure S17. Get High-res Image Clustering Approach #4: 'RNAseq CNMF subtypes' versus Clinical Feature #2: 'AGE'
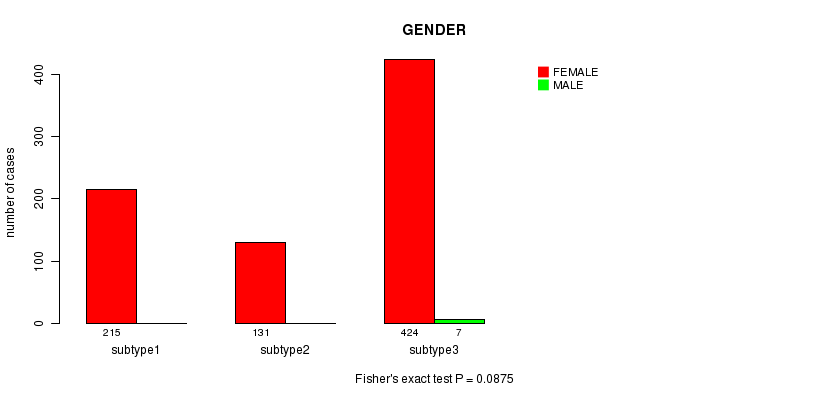
P value = 0.0875 (Fisher's exact test)
Table S22. Clustering Approach #4: 'RNAseq CNMF subtypes' versus Clinical Feature #3: 'GENDER'
| nPatients | FEMALE | MALE |
|---|---|---|
| ALL | 770 | 7 |
| subtype1 | 215 | 0 |
| subtype2 | 131 | 0 |
| subtype3 | 424 | 7 |
Figure S18. Get High-res Image Clustering Approach #4: 'RNAseq CNMF subtypes' versus Clinical Feature #3: 'GENDER'
P value = 0.285 (Fisher's exact test)
Table S23. Clustering Approach #4: 'RNAseq CNMF subtypes' versus Clinical Feature #4: 'RADIATIONS.RADIATION.REGIMENINDICATION'
| nPatients | NO | YES |
|---|---|---|
| ALL | 598 | 179 |
| subtype1 | 163 | 52 |
| subtype2 | 95 | 36 |
| subtype3 | 340 | 91 |
Figure S19. Get High-res Image Clustering Approach #4: 'RNAseq CNMF subtypes' versus Clinical Feature #4: 'RADIATIONS.RADIATION.REGIMENINDICATION'

P value = 0.214 (Fisher's exact test)
Table S24. Clustering Approach #4: 'RNAseq CNMF subtypes' versus Clinical Feature #5: 'NEOADJUVANT.THERAPY'
| nPatients | NO | YES |
|---|---|---|
| ALL | 507 | 270 |
| subtype1 | 141 | 74 |
| subtype2 | 77 | 54 |
| subtype3 | 289 | 142 |
Figure S20. Get High-res Image Clustering Approach #4: 'RNAseq CNMF subtypes' versus Clinical Feature #5: 'NEOADJUVANT.THERAPY'
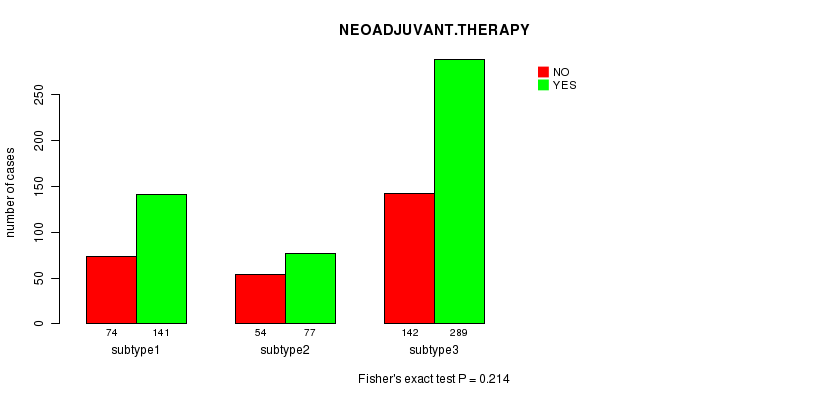
Table S25. Get Full Table Description of clustering approach #5: 'RNAseq cHierClus subtypes'
| Cluster Labels | 1 | 2 | 3 |
|---|---|---|---|
| Number of samples | 222 | 187 | 368 |
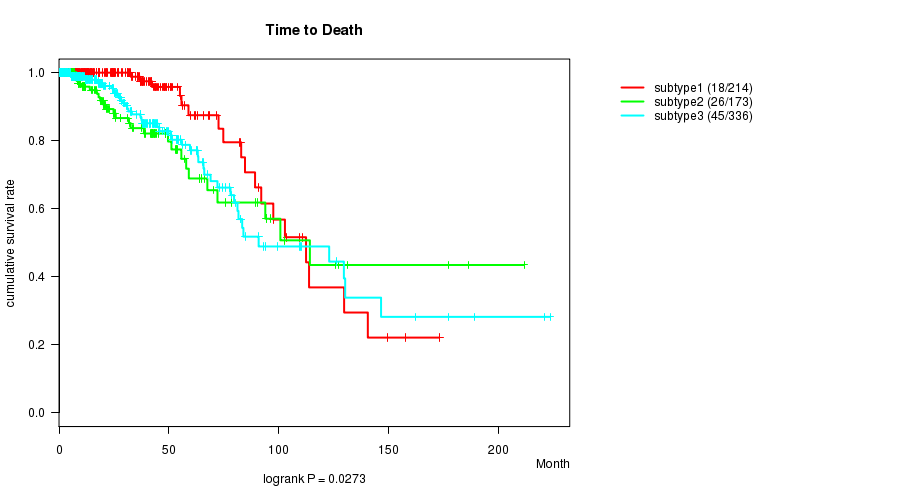
P value = 0.0273 (logrank test)
Table S26. Clustering Approach #5: 'RNAseq cHierClus subtypes' versus Clinical Feature #1: 'Time to Death'
| nPatients | nDeath | Duration Range (Median), Month | |
|---|---|---|---|
| ALL | 723 | 89 | 0.0 - 223.4 (18.2) |
| subtype1 | 214 | 18 | 0.1 - 173.0 (21.9) |
| subtype2 | 173 | 26 | 0.0 - 211.5 (18.8) |
| subtype3 | 336 | 45 | 0.0 - 223.4 (17.7) |
Figure S21. Get High-res Image Clustering Approach #5: 'RNAseq cHierClus subtypes' versus Clinical Feature #1: 'Time to Death'
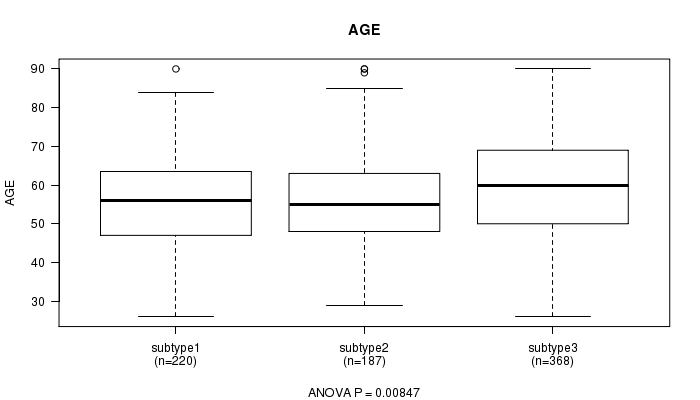
P value = 0.00847 (ANOVA)
Table S27. Clustering Approach #5: 'RNAseq cHierClus subtypes' versus Clinical Feature #2: 'AGE'
| nPatients | Mean (Std.Dev) | |
|---|---|---|
| ALL | 775 | 57.8 (13.2) |
| subtype1 | 220 | 56.5 (12.1) |
| subtype2 | 187 | 56.4 (12.8) |
| subtype3 | 368 | 59.4 (13.9) |
Figure S22. Get High-res Image Clustering Approach #5: 'RNAseq cHierClus subtypes' versus Clinical Feature #2: 'AGE'
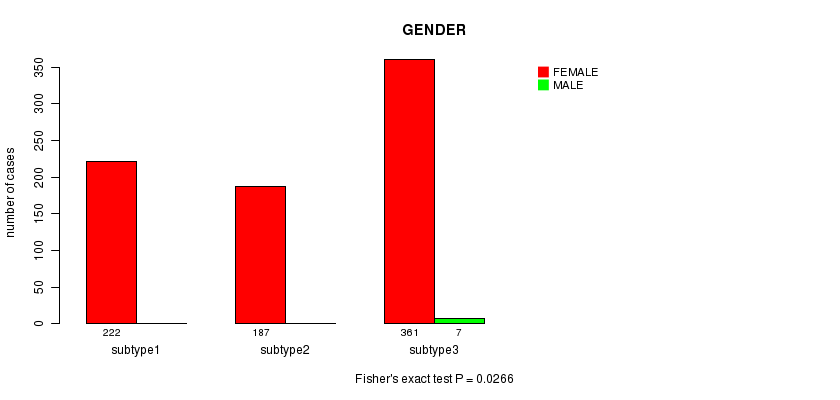
P value = 0.0266 (Fisher's exact test)
Table S28. Clustering Approach #5: 'RNAseq cHierClus subtypes' versus Clinical Feature #3: 'GENDER'
| nPatients | FEMALE | MALE |
|---|---|---|
| ALL | 770 | 7 |
| subtype1 | 222 | 0 |
| subtype2 | 187 | 0 |
| subtype3 | 361 | 7 |
Figure S23. Get High-res Image Clustering Approach #5: 'RNAseq cHierClus subtypes' versus Clinical Feature #3: 'GENDER'
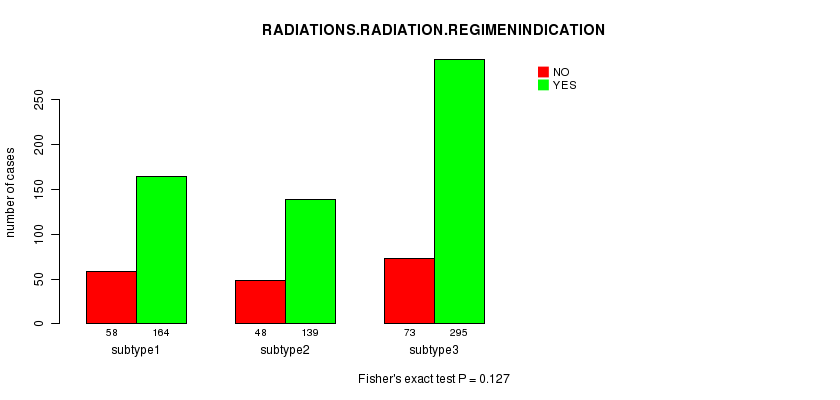
P value = 0.127 (Fisher's exact test)
Table S29. Clustering Approach #5: 'RNAseq cHierClus subtypes' versus Clinical Feature #4: 'RADIATIONS.RADIATION.REGIMENINDICATION'
| nPatients | NO | YES |
|---|---|---|
| ALL | 598 | 179 |
| subtype1 | 164 | 58 |
| subtype2 | 139 | 48 |
| subtype3 | 295 | 73 |
Figure S24. Get High-res Image Clustering Approach #5: 'RNAseq cHierClus subtypes' versus Clinical Feature #4: 'RADIATIONS.RADIATION.REGIMENINDICATION'
P value = 0.0735 (Fisher's exact test)
Table S30. Clustering Approach #5: 'RNAseq cHierClus subtypes' versus Clinical Feature #5: 'NEOADJUVANT.THERAPY'
| nPatients | NO | YES |
|---|---|---|
| ALL | 507 | 270 |
| subtype1 | 132 | 90 |
| subtype2 | 122 | 65 |
| subtype3 | 253 | 115 |
Figure S25. Get High-res Image Clustering Approach #5: 'RNAseq cHierClus subtypes' versus Clinical Feature #5: 'NEOADJUVANT.THERAPY'

Table S31. Get Full Table Description of clustering approach #6: 'MIRseq CNMF subtypes'
| Cluster Labels | 1 | 2 | 3 |
|---|---|---|---|
| Number of samples | 235 | 328 | 218 |
P value = 0.102 (logrank test)
Table S32. Clustering Approach #6: 'MIRseq CNMF subtypes' versus Clinical Feature #1: 'Time to Death'
| nPatients | nDeath | Duration Range (Median), Month | |
|---|---|---|---|
| ALL | 722 | 90 | 0.0 - 223.4 (18.2) |
| subtype1 | 224 | 24 | 0.2 - 189.0 (21.7) |
| subtype2 | 301 | 35 | 0.0 - 223.4 (17.0) |
| subtype3 | 197 | 31 | 0.0 - 211.5 (17.2) |
Figure S26. Get High-res Image Clustering Approach #6: 'MIRseq CNMF subtypes' versus Clinical Feature #1: 'Time to Death'

P value = 0.000189 (ANOVA)
Table S33. Clustering Approach #6: 'MIRseq CNMF subtypes' versus Clinical Feature #2: 'AGE'
| nPatients | Mean (Std.Dev) | |
|---|---|---|
| ALL | 779 | 58.2 (13.4) |
| subtype1 | 233 | 56.1 (12.4) |
| subtype2 | 328 | 60.5 (14.0) |
| subtype3 | 218 | 56.9 (13.0) |
Figure S27. Get High-res Image Clustering Approach #6: 'MIRseq CNMF subtypes' versus Clinical Feature #2: 'AGE'
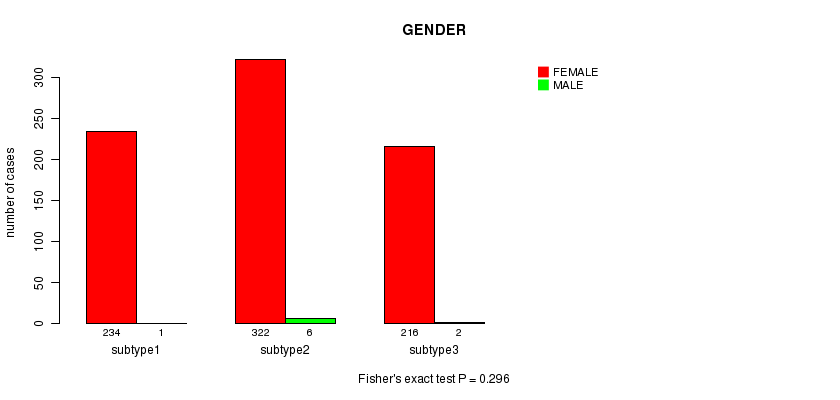
P value = 0.296 (Fisher's exact test)
Table S34. Clustering Approach #6: 'MIRseq CNMF subtypes' versus Clinical Feature #3: 'GENDER'
| nPatients | FEMALE | MALE |
|---|---|---|
| ALL | 772 | 9 |
| subtype1 | 234 | 1 |
| subtype2 | 322 | 6 |
| subtype3 | 216 | 2 |
Figure S28. Get High-res Image Clustering Approach #6: 'MIRseq CNMF subtypes' versus Clinical Feature #3: 'GENDER'
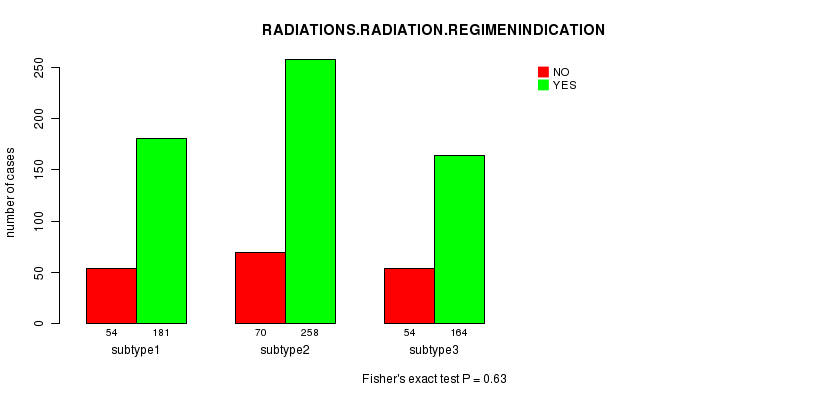
P value = 0.63 (Fisher's exact test)
Table S35. Clustering Approach #6: 'MIRseq CNMF subtypes' versus Clinical Feature #4: 'RADIATIONS.RADIATION.REGIMENINDICATION'
| nPatients | NO | YES |
|---|---|---|
| ALL | 603 | 178 |
| subtype1 | 181 | 54 |
| subtype2 | 258 | 70 |
| subtype3 | 164 | 54 |
Figure S29. Get High-res Image Clustering Approach #6: 'MIRseq CNMF subtypes' versus Clinical Feature #4: 'RADIATIONS.RADIATION.REGIMENINDICATION'
P value = 0.367 (Fisher's exact test)
Table S36. Clustering Approach #6: 'MIRseq CNMF subtypes' versus Clinical Feature #5: 'NEOADJUVANT.THERAPY'
| nPatients | NO | YES |
|---|---|---|
| ALL | 506 | 275 |
| subtype1 | 144 | 91 |
| subtype2 | 220 | 108 |
| subtype3 | 142 | 76 |
Figure S30. Get High-res Image Clustering Approach #6: 'MIRseq CNMF subtypes' versus Clinical Feature #5: 'NEOADJUVANT.THERAPY'
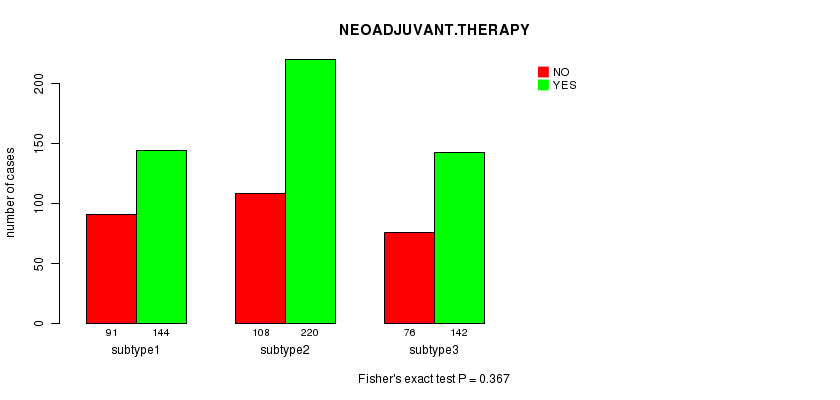
Table S37. Get Full Table Description of clustering approach #7: 'MIRseq cHierClus subtypes'
| Cluster Labels | 1 | 2 | 3 |
|---|---|---|---|
| Number of samples | 249 | 356 | 176 |
P value = 0.0143 (logrank test)
Table S38. Clustering Approach #7: 'MIRseq cHierClus subtypes' versus Clinical Feature #1: 'Time to Death'
| nPatients | nDeath | Duration Range (Median), Month | |
|---|---|---|---|
| ALL | 722 | 90 | 0.0 - 223.4 (18.2) |
| subtype1 | 223 | 36 | 0.1 - 223.4 (17.9) |
| subtype2 | 336 | 30 | 0.0 - 189.0 (18.0) |
| subtype3 | 163 | 24 | 0.1 - 211.5 (20.0) |
Figure S31. Get High-res Image Clustering Approach #7: 'MIRseq cHierClus subtypes' versus Clinical Feature #1: 'Time to Death'
P value = 3.4e-05 (ANOVA)
Table S39. Clustering Approach #7: 'MIRseq cHierClus subtypes' versus Clinical Feature #2: 'AGE'
| nPatients | Mean (Std.Dev) | |
|---|---|---|
| ALL | 779 | 58.2 (13.4) |
| subtype1 | 249 | 61.3 (14.3) |
| subtype2 | 354 | 57.1 (12.5) |
| subtype3 | 176 | 56.1 (13.0) |
Figure S32. Get High-res Image Clustering Approach #7: 'MIRseq cHierClus subtypes' versus Clinical Feature #2: 'AGE'
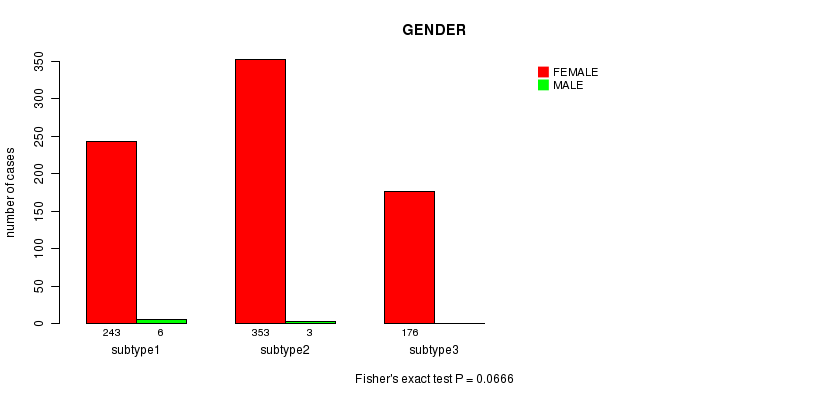
P value = 0.0666 (Fisher's exact test)
Table S40. Clustering Approach #7: 'MIRseq cHierClus subtypes' versus Clinical Feature #3: 'GENDER'
| nPatients | FEMALE | MALE |
|---|---|---|
| ALL | 772 | 9 |
| subtype1 | 243 | 6 |
| subtype2 | 353 | 3 |
| subtype3 | 176 | 0 |
Figure S33. Get High-res Image Clustering Approach #7: 'MIRseq cHierClus subtypes' versus Clinical Feature #3: 'GENDER'
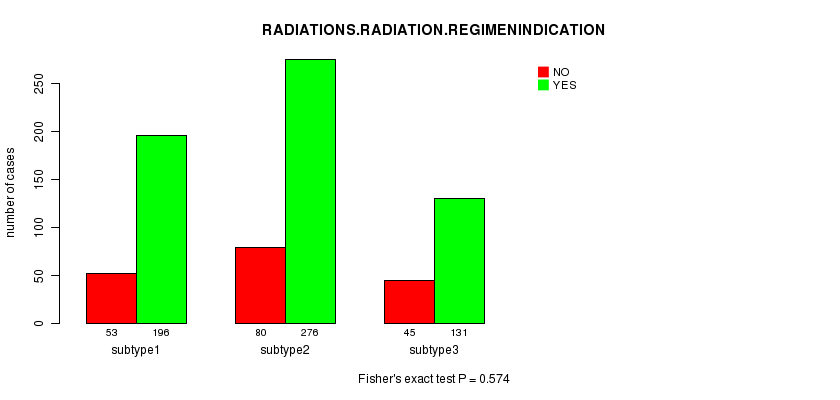
P value = 0.574 (Fisher's exact test)
Table S41. Clustering Approach #7: 'MIRseq cHierClus subtypes' versus Clinical Feature #4: 'RADIATIONS.RADIATION.REGIMENINDICATION'
| nPatients | NO | YES |
|---|---|---|
| ALL | 603 | 178 |
| subtype1 | 196 | 53 |
| subtype2 | 276 | 80 |
| subtype3 | 131 | 45 |
Figure S34. Get High-res Image Clustering Approach #7: 'MIRseq cHierClus subtypes' versus Clinical Feature #4: 'RADIATIONS.RADIATION.REGIMENINDICATION'
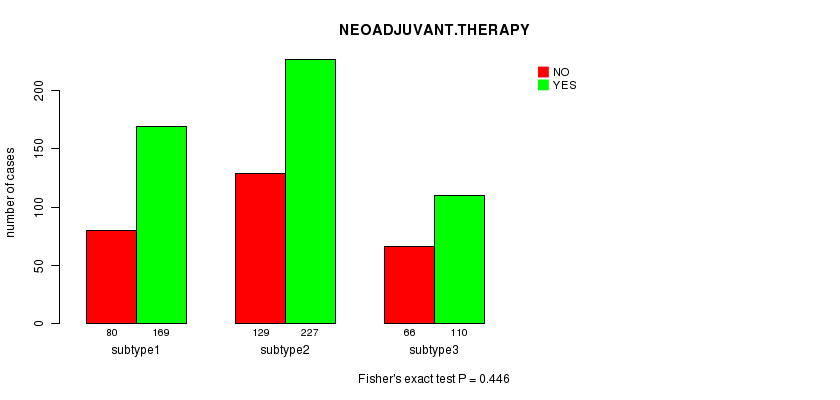
P value = 0.446 (Fisher's exact test)
Table S42. Clustering Approach #7: 'MIRseq cHierClus subtypes' versus Clinical Feature #5: 'NEOADJUVANT.THERAPY'
| nPatients | NO | YES |
|---|---|---|
| ALL | 506 | 275 |
| subtype1 | 169 | 80 |
| subtype2 | 227 | 129 |
| subtype3 | 110 | 66 |
Figure S35. Get High-res Image Clustering Approach #7: 'MIRseq cHierClus subtypes' versus Clinical Feature #5: 'NEOADJUVANT.THERAPY'
-
Cluster data file = BRCA.mergedcluster.txt
-
Clinical data file = BRCA.clin.merged.picked.txt
-
Number of patients = 828
-
Number of clustering approaches = 7
-
Number of selected clinical features = 5
-
Exclude small clusters that include fewer than K patients, K = 3
consensus non-negative matrix factorization clustering approach (Brunet et al. 2004)
Resampling-based clustering method (Monti et al. 2003)
For survival clinical features, the Kaplan-Meier survival curves of tumors with and without gene mutations were plotted and the statistical significance P values were estimated by logrank test (Bland and Altman 2004) using the 'survdiff' function in R
For continuous numerical clinical features, one-way analysis of variance (Howell 2002) was applied to compare the clinical values between tumor subtypes using 'anova' function in R
For multi-class clinical features (nominal or ordinal), Chi-square tests (Greenwood and Nikulin 1996) were used to estimate the P values using the 'chisq.test' function in R
For binary clinical features, two-tailed Fisher's exact tests (Fisher 1922) were used to estimate the P values using the 'fisher.test' function in R
This is an experimental feature. Location of data archives could not be determined.