This pipeline uses various statistical tests to identify mRNAs whose expression levels correlated to selected clinical features.
Testing the association between 17814 genes and 9 clinical features across 223 samples, statistically thresholded by Q value < 0.05, 7 clinical features related to at least one genes.
-
38 genes correlated to 'PRIMARY.SITE.OF.DISEASE'.
-
PRAC , CEACAM5 , GPX2 , LGALS4 , ZNF529 , ...
-
30 genes correlated to 'GENDER'.
-
DDX3Y , EIF1AY , JARID1D , RPS4Y1 , RPS4Y2 , ...
-
386 genes correlated to 'HISTOLOGICAL.TYPE'.
-
SLC11A1 , PLAGL2 , C20ORF177 , PDGFRL , ZNF529 , ...
-
1 gene correlated to 'PATHOLOGY.T'.
-
RBP7
-
1 gene correlated to 'PATHOLOGY.N'.
-
LUZP2
-
4 genes correlated to 'PATHOLOGICSPREAD(M)'.
-
KCNC2 , FLJ44894 , ZNF273 , MFNG
-
2 genes correlated to 'NEOADJUVANT.THERAPY'.
-
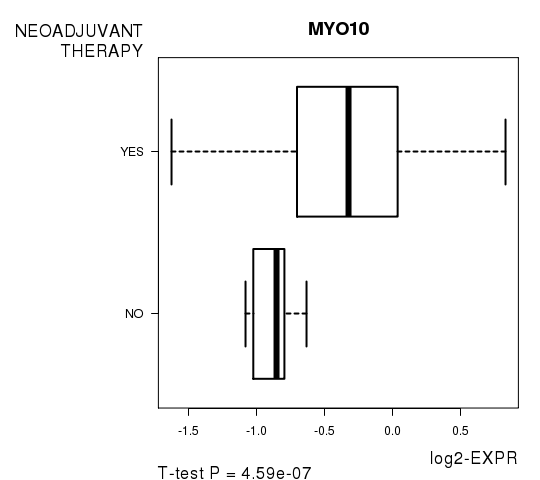
MYO10 , ELAVL2
-
No genes correlated to 'Time to Death', and 'AGE'.
Complete statistical result table is provided in Supplement Table 1
Table 1. Get Full Table This table shows the clinical features, statistical methods used, and the number of genes that are significantly associated with each clinical feature at Q value < 0.05.
| Clinical feature | Statistical test | Significant genes | Associated with | Associated with | ||
|---|---|---|---|---|---|---|
| Time to Death | Cox regression test | N=0 | ||||
| AGE | Spearman correlation test | N=0 | ||||
| PRIMARY SITE OF DISEASE | t test | N=38 | rectum | N=26 | colon | N=12 |
| GENDER | t test | N=30 | male | N=14 | female | N=16 |
| HISTOLOGICAL TYPE | ANOVA test | N=386 | ||||
| PATHOLOGY T | Spearman correlation test | N=1 | higher pT | N=1 | lower pT | N=0 |
| PATHOLOGY N | Spearman correlation test | N=1 | higher pN | N=1 | lower pN | N=0 |
| PATHOLOGICSPREAD(M) | ANOVA test | N=4 | ||||
| NEOADJUVANT THERAPY | t test | N=2 | yes | N=2 | no | N=0 |
Table S1. Basic characteristics of clinical feature: 'Time to Death'
| Time to Death | Duration (Months) | 0.9-52 (median=5) |
| censored | N = 98 | |
| death | N = 15 | |
| Significant markers | N = 0 |
Table S2. Basic characteristics of clinical feature: 'AGE'
| AGE | Mean (SD) | 69.45 (11) |
| Significant markers | N = 0 |
Table S3. Basic characteristics of clinical feature: 'PRIMARY.SITE.OF.DISEASE'
| PRIMARY.SITE.OF.DISEASE | Labels | N |
| COLON | 153 | |
| RECTUM | 68 | |
| Significant markers | N = 38 | |
| Higher in RECTUM | 26 | |
| Higher in COLON | 12 |
Table S4. Get Full Table List of top 10 genes differentially expressed by 'PRIMARY.SITE.OF.DISEASE'
| T(pos if higher in 'RECTUM') | ttestP | Q | AUC | |
|---|---|---|---|---|
| PRAC | 7.52 | 4.268e-12 | 7.6e-08 | 0.7813 |
| CEACAM5 | 7.33 | 5.253e-12 | 9.36e-08 | 0.7743 |
| GPX2 | 7.26 | 6.735e-12 | 1.2e-07 | 0.7876 |
| LGALS4 | 7.22 | 1.489e-11 | 2.65e-07 | 0.7568 |
| ZNF529 | 6.33 | 1.349e-09 | 2.4e-05 | 0.6845 |
| HSP90B3P | -6 | 1.173e-08 | 0.000209 | 0.732 |
| MLH1 | 5.93 | 1.182e-08 | 0.000211 | 0.6718 |
| PPP1R1B | 5.7 | 4.525e-08 | 0.000806 | 0.7362 |
| CFTR | 5.72 | 4.526e-08 | 0.000806 | 0.7652 |
| PDZK1IP1 | 5.78 | 4.667e-08 | 0.000831 | 0.7427 |
Figure S1. Get High-res Image As an example, this figure shows the association of PRAC to 'PRIMARY.SITE.OF.DISEASE'. P value = 4.27e-12 with T-test analysis.
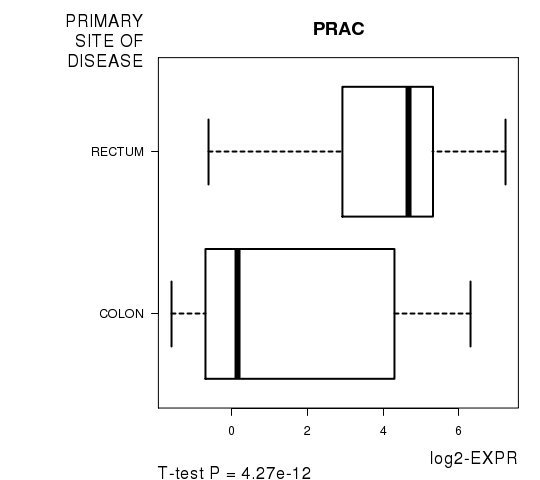
Table S5. Basic characteristics of clinical feature: 'GENDER'
| GENDER | Labels | N |
| FEMALE | 107 | |
| MALE | 116 | |
| Significant markers | N = 30 | |
| Higher in MALE | 14 | |
| Higher in FEMALE | 16 |
Table S6. Get Full Table List of top 10 genes differentially expressed by 'GENDER'
| T(pos if higher in 'MALE') | ttestP | Q | AUC | |
|---|---|---|---|---|
| DDX3Y | 25.36 | 2.249e-67 | 4.01e-63 | 0.9712 |
| EIF1AY | 22.87 | 1.045e-59 | 1.86e-55 | 0.9641 |
| JARID1D | 22.57 | 3.627e-59 | 6.46e-55 | 0.9705 |
| RPS4Y1 | 22.36 | 1.145e-57 | 2.04e-53 | 0.9425 |
| RPS4Y2 | 21.49 | 9.222e-55 | 1.64e-50 | 0.9647 |
| CYORF15A | 20.81 | 5.304e-53 | 9.45e-49 | 0.954 |
| UTY | 18.83 | 2.168e-46 | 3.86e-42 | 0.9451 |
| CYORF15B | 17.17 | 6.976e-42 | 1.24e-37 | 0.9328 |
| ZFY | 16.82 | 2.958e-41 | 5.27e-37 | 0.9303 |
| NLGN4Y | 12.26 | 9.627e-26 | 1.71e-21 | 0.8677 |
Figure S2. Get High-res Image As an example, this figure shows the association of DDX3Y to 'GENDER'. P value = 2.25e-67 with T-test analysis.
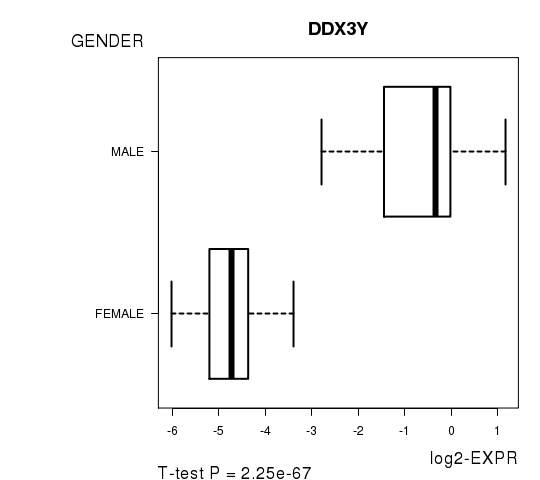
Table S7. Basic characteristics of clinical feature: 'HISTOLOGICAL.TYPE'
| HISTOLOGICAL.TYPE | Labels | N |
| COLON ADENOCARCINOMA | 127 | |
| COLON MUCINOUS ADENOCARCINOMA | 24 | |
| RECTAL ADENOCARCINOMA | 58 | |
| RECTAL MUCINOUS ADENOCARCINOMA | 7 | |
| Significant markers | N = 386 |
Table S8. Get Full Table List of top 10 genes differentially expressed by 'HISTOLOGICAL.TYPE'
| ANOVA_P | Q | |
|---|---|---|
| SLC11A1 | 2.234e-12 | 3.98e-08 |
| PLAGL2 | 3.095e-12 | 5.51e-08 |
| C20ORF177 | 1.135e-11 | 2.02e-07 |
| PDGFRL | 1.209e-11 | 2.15e-07 |
| ZNF529 | 8.193e-11 | 1.46e-06 |
| AGR2 | 8.375e-11 | 1.49e-06 |
| DUSP4 | 8.525e-11 | 1.52e-06 |
| SLC19A3 | 1.039e-10 | 1.85e-06 |
| PRAC | 1.314e-10 | 2.34e-06 |
| HPSE | 1.504e-10 | 2.68e-06 |
Figure S3. Get High-res Image As an example, this figure shows the association of SLC11A1 to 'HISTOLOGICAL.TYPE'. P value = 2.23e-12 with ANOVA analysis.
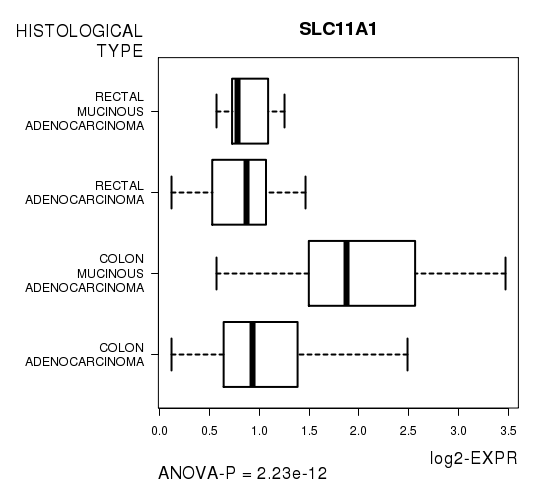
Table S9. Basic characteristics of clinical feature: 'PATHOLOGY.T'
| PATHOLOGY.T | Mean (SD) | 2.79 (0.64) |
| N | ||
| T1 | 9 | |
| T2 | 46 | |
| T3 | 149 | |
| T4 | 17 | |
| Significant markers | N = 1 | |
| pos. correlated | 1 | |
| neg. correlated | 0 |
Table S10. Get Full Table List of one gene significantly correlated to 'PATHOLOGY.T' by Spearman correlation test
| SpearmanCorr | corrP | Q | |
|---|---|---|---|
| RBP7 | 0.3128 | 2.105e-06 | 0.0375 |
Figure S4. Get High-res Image As an example, this figure shows the association of RBP7 to 'PATHOLOGY.T'. P value = 2.11e-06 with Spearman correlation analysis.
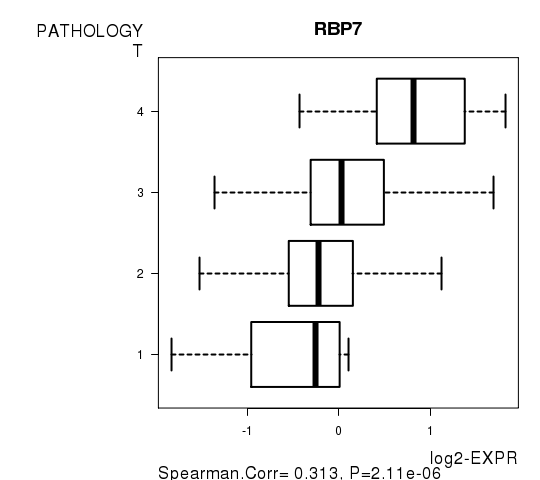
Table S11. Basic characteristics of clinical feature: 'PATHOLOGY.N'
| PATHOLOGY.N | Mean (SD) | 0.59 (0.8) |
| N | ||
| N0 | 136 | |
| N1 | 43 | |
| N2 | 44 | |
| Significant markers | N = 1 | |
| pos. correlated | 1 | |
| neg. correlated | 0 |
Table S12. Get Full Table List of one gene significantly correlated to 'PATHOLOGY.N' by Spearman correlation test
| SpearmanCorr | corrP | Q | |
|---|---|---|---|
| LUZP2 | 0.3107 | 2.224e-06 | 0.0396 |
Figure S5. Get High-res Image As an example, this figure shows the association of LUZP2 to 'PATHOLOGY.N'. P value = 2.22e-06 with Spearman correlation analysis.
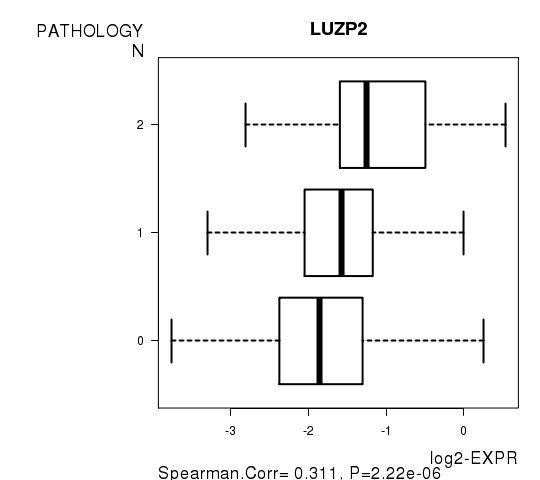
Table S13. Basic characteristics of clinical feature: 'PATHOLOGICSPREAD(M)'
| PATHOLOGICSPREAD(M) | Labels | N |
| M0 | 185 | |
| M1 | 34 | |
| M1A | 1 | |
| Significant markers | N = 4 |
Table S14. Get Full Table List of 4 genes differentially expressed by 'PATHOLOGICSPREAD(M)'
| ANOVA_P | Q | |
|---|---|---|
| KCNC2 | 1.081e-10 | 1.93e-06 |
| FLJ44894 | 1.59e-06 | 0.0283 |
| ZNF273 | 2.13e-06 | 0.0379 |
| MFNG | 2.188e-06 | 0.039 |
Figure S6. Get High-res Image As an example, this figure shows the association of KCNC2 to 'PATHOLOGICSPREAD(M)'. P value = 1.08e-10 with ANOVA analysis.
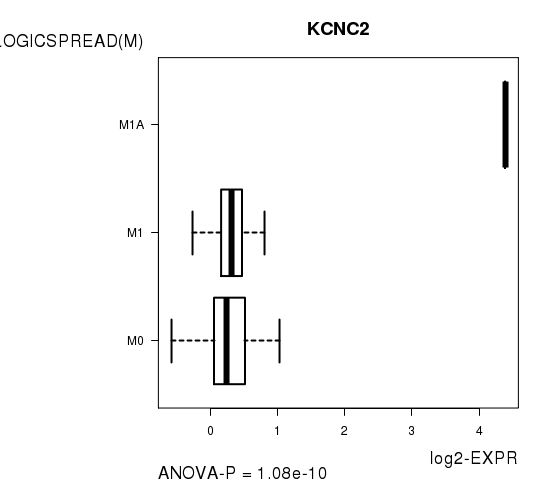
Table S15. Basic characteristics of clinical feature: 'NEOADJUVANT.THERAPY'
| NEOADJUVANT.THERAPY | Labels | N |
| NO | 8 | |
| YES | 215 | |
| Significant markers | N = 2 | |
| Higher in YES | 2 | |
| Higher in NO | 0 |
Table S16. Get Full Table List of 2 genes differentially expressed by 'NEOADJUVANT.THERAPY'
| T(pos if higher in 'YES') | ttestP | Q | AUC | |
|---|---|---|---|---|
| MYO10 | 8.53 | 4.588e-07 | 0.00817 | 0.8302 |
| ELAVL2 | 6.3 | 1.433e-06 | 0.0255 | 0.7483 |
Figure S7. Get High-res Image As an example, this figure shows the association of MYO10 to 'NEOADJUVANT.THERAPY'. P value = 4.59e-07 with T-test analysis.
-
Expresson data file = COADREAD.medianexp.txt
-
Clinical data file = COADREAD.clin.merged.picked.txt
-
Number of patients = 223
-
Number of genes = 17814
-
Number of clinical features = 9
For survival clinical features, Wald's test in univariate Cox regression analysis with proportional hazards model (Andersen and Gill 1982) was used to estimate the P values using the 'coxph' function in R. Kaplan-Meier survival curves were plot using the four quartile subgroups of patients based on expression levels
For continuous numerical clinical features, Spearman's rank correlation coefficients (Spearman 1904) and two-tailed P values were estimated using 'cor.test' function in R
For two-class clinical features, two-tailed Student's t test with unequal variance (Lehmann and Romano 2005) was applied to compare the log2-expression levels between the two clinical classes using 't.test' function in R
For multi-class clinical features (ordinal or nominal), one-way analysis of variance (Howell 2002) was applied to compare the log2-expression levels between different clinical classes using 'anova' function in R
For multiple hypothesis correction, Q value is the False Discovery Rate (FDR) analogue of the P value (Benjamini and Hochberg 1995), defined as the minimum FDR at which the test may be called significant. We used the 'Benjamini and Hochberg' method of 'p.adjust' function in R to convert P values into Q values.
This is an experimental feature. Location of data archives could not be determined.