This pipeline computes the correlation between cancer subtypes identified by different molecular patterns and selected clinical features.
Testing the association between subtypes identified by 7 different clustering approaches and 9 clinical features across 275 patients, 17 significant findings detected with P value < 0.05.
-
CNMF clustering analysis on array-based mRNA expression data identified 4 subtypes that correlate to 'PRIMARY.SITE.OF.DISEASE', 'HISTOLOGICAL.TYPE', 'PATHOLOGY.N', and 'PATHOLOGICSPREAD(M)'.
-
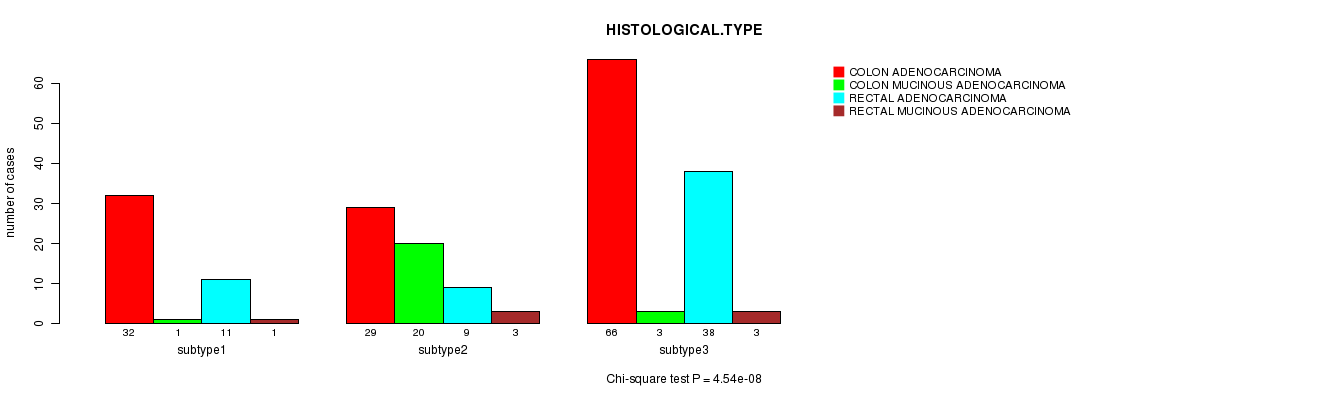
Consensus hierarchical clustering analysis on array-based mRNA expression data identified 3 subtypes that correlate to 'PRIMARY.SITE.OF.DISEASE' and 'HISTOLOGICAL.TYPE'.
-
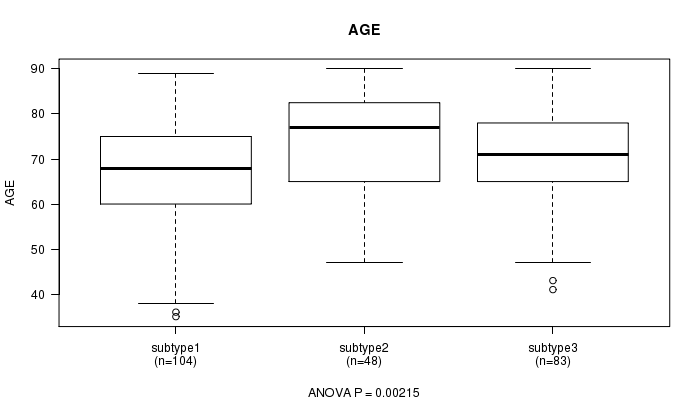
3 subtypes identified in current cancer cohort by 'METHLYATION CNMF'. These subtypes correlate to 'AGE', 'PRIMARY.SITE.OF.DISEASE', and 'HISTOLOGICAL.TYPE'.
-
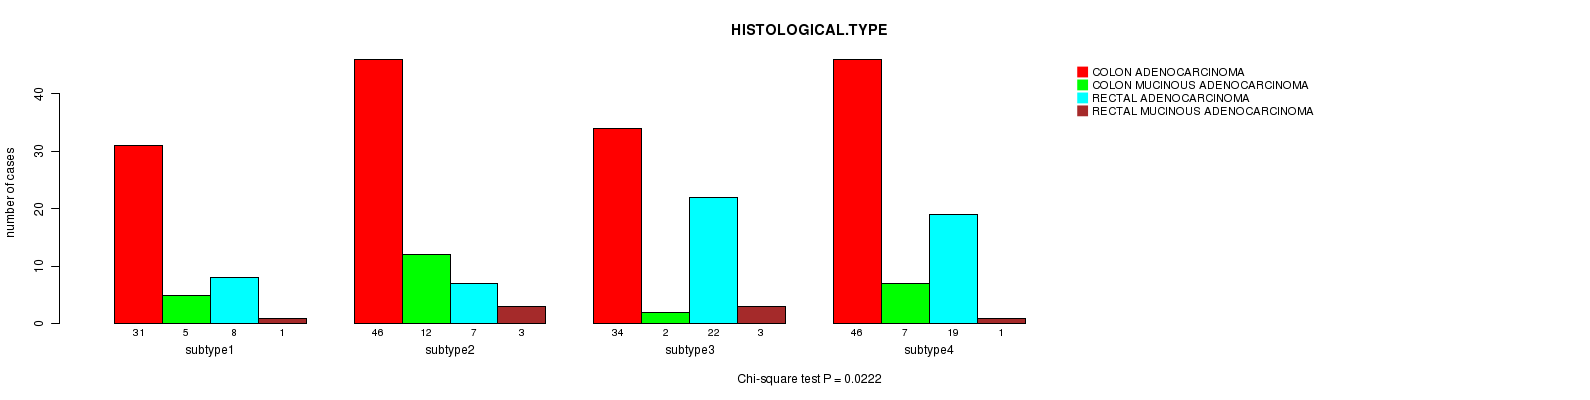
CNMF clustering analysis on sequencing-based mRNA expression data identified 4 subtypes that correlate to 'HISTOLOGICAL.TYPE'.
-
Consensus hierarchical clustering analysis on sequencing-based mRNA expression data identified 4 subtypes that correlate to 'HISTOLOGICAL.TYPE'.
-
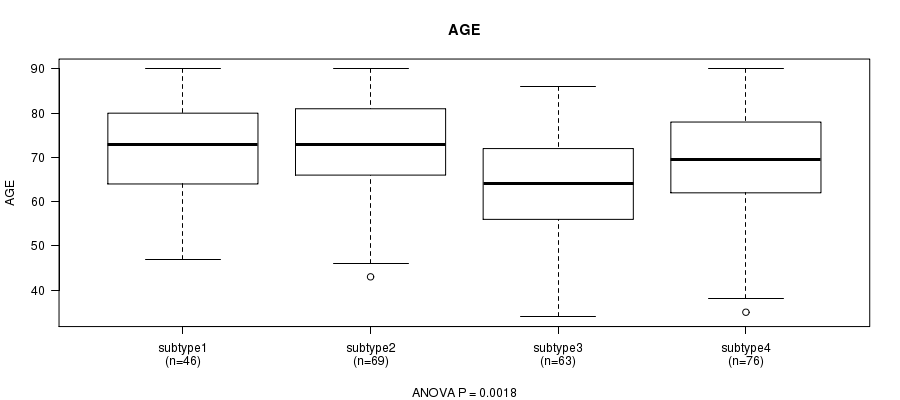
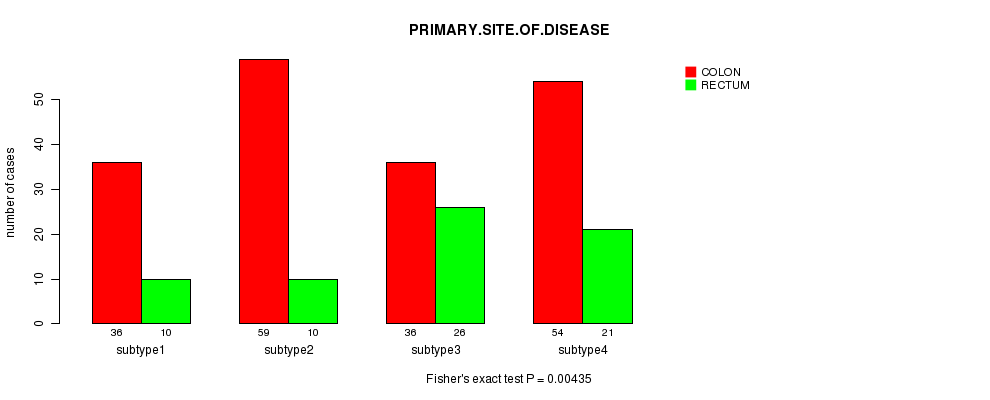
CNMF clustering analysis on sequencing-based miR expression data identified 4 subtypes that correlate to 'AGE', 'PRIMARY.SITE.OF.DISEASE', 'HISTOLOGICAL.TYPE', and 'NEOADJUVANT.THERAPY'.
-
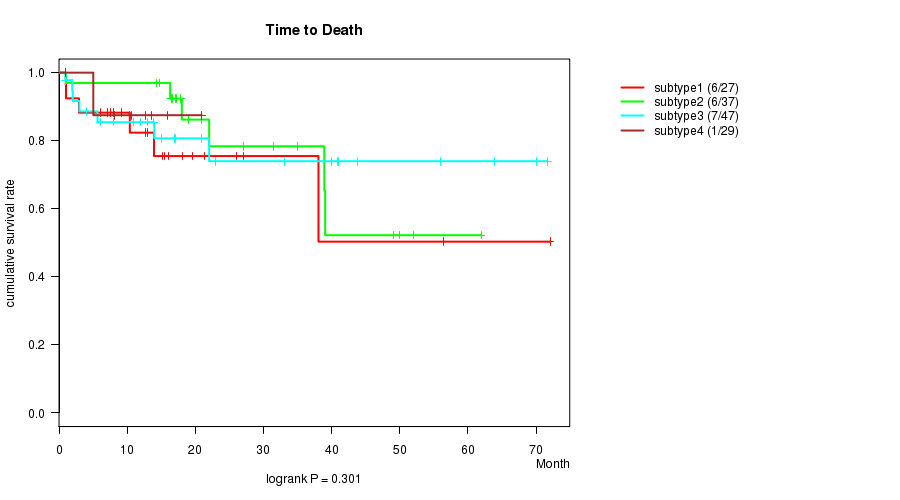
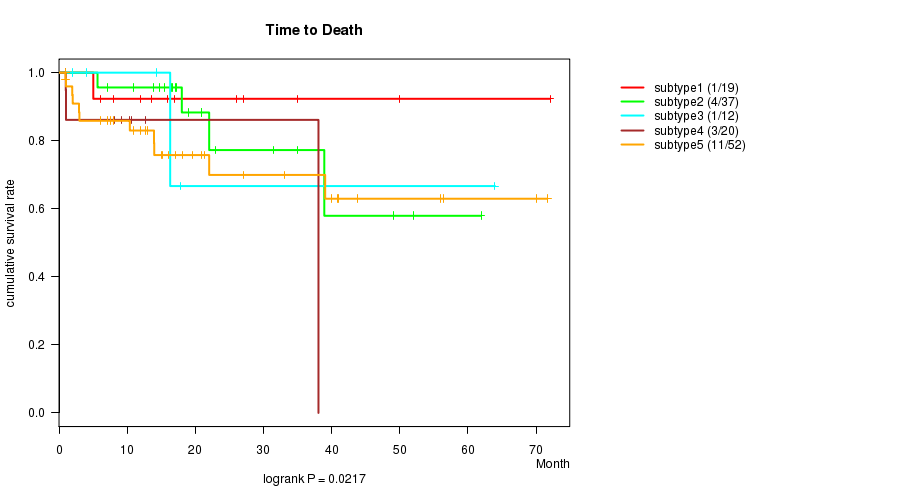
Consensus hierarchical clustering analysis on sequencing-based miR expression data identified 5 subtypes that correlate to 'Time to Death' and 'HISTOLOGICAL.TYPE'.
Table 1. Get Full Table Overview of the association between subtypes identified by 7 different clustering approaches and 9 clinical features. Shown in the table are P values from statistical tests. Thresholded by P value < 0.05, 17 significant findings detected.
|
Clinical Features |
Statistical Tests |
mRNA CNMF subtypes |
mRNA cHierClus subtypes |
METHLYATION CNMF |
RNAseq CNMF subtypes |
RNAseq cHierClus subtypes |
MIRseq CNMF subtypes |
MIRseq cHierClus subtypes |
| Time to Death | logrank test | 0.131 | 0.718 | 0.259 | 0.193 | 0.227 | 0.301 | 0.0217 |
| AGE | ANOVA | 0.712 | 0.194 | 0.00215 | 0.273 | 0.849 | 0.0018 | 0.112 |
| PRIMARY SITE OF DISEASE | Chi-square test | 0.0108 | 0.0338 | 0.00323 | 0.173 | 0.147 | 0.00435 | 0.422 |
| GENDER | Chi-square test | 0.0658 | 0.783 | 0.179 | 0.918 | 0.98 | 0.745 | 0.288 |
| HISTOLOGICAL TYPE | Chi-square test | 6.22e-07 | 4.54e-08 | 1.69e-08 | 0.0126 | 0.0103 | 0.0222 | 0.0209 |
| PATHOLOGY T | Chi-square test | 0.182 | 0.885 | 0.45 | 0.466 | 0.56 | 0.522 | 0.247 |
| PATHOLOGY N | Chi-square test | 0.0046 | 0.637 | 0.886 | 0.961 | 0.897 | 0.32 | 0.162 |
| PATHOLOGICSPREAD(M) | Chi-square test | 0.00144 | 0.492 | 0.0617 | 0.482 | 0.763 | 0.191 | 0.212 |
| NEOADJUVANT THERAPY | Chi-square test | 0.128 | 0.71 | 0.901 | 0.217 | 1 | 0.0361 | 0.363 |
Table S1. Get Full Table Description of clustering approach #1: 'mRNA CNMF subtypes'
| Cluster Labels | 1 | 2 | 3 | 4 |
|---|---|---|---|---|
| Number of samples | 62 | 48 | 73 | 40 |
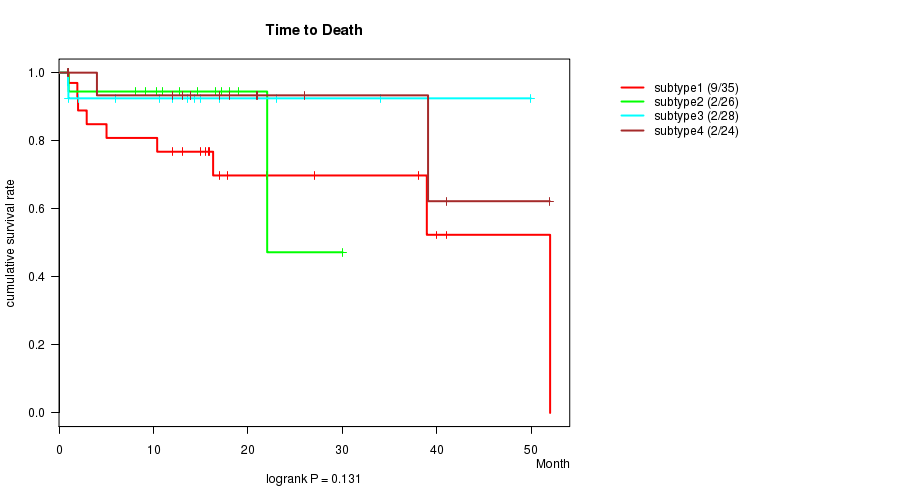
P value = 0.131 (logrank test)
Table S2. Clustering Approach #1: 'mRNA CNMF subtypes' versus Clinical Feature #1: 'Time to Death'
| nPatients | nDeath | Duration Range (Median), Month | |
|---|---|---|---|
| ALL | 113 | 15 | 0.9 - 52.0 (5.0) |
| subtype1 | 35 | 9 | 1.0 - 52.0 (13.0) |
| subtype2 | 26 | 2 | 1.0 - 30.0 (1.0) |
| subtype3 | 28 | 2 | 0.9 - 49.9 (1.0) |
| subtype4 | 24 | 2 | 0.9 - 52.0 (12.5) |
Figure S1. Get High-res Image Clustering Approach #1: 'mRNA CNMF subtypes' versus Clinical Feature #1: 'Time to Death'
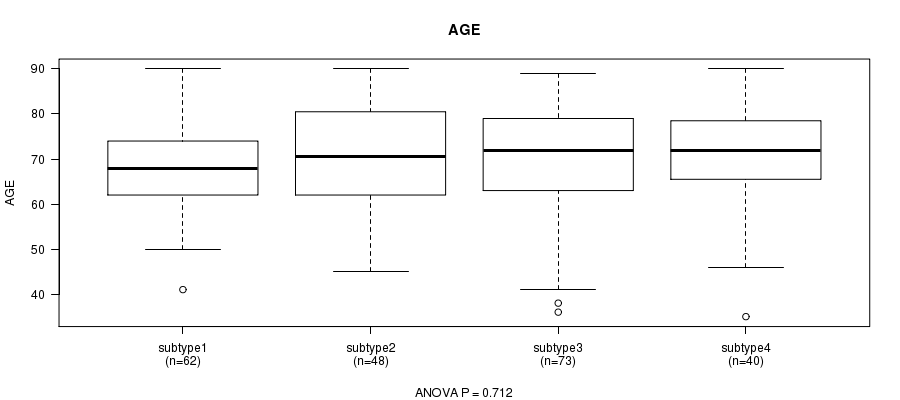
P value = 0.712 (ANOVA)
Table S3. Clustering Approach #1: 'mRNA CNMF subtypes' versus Clinical Feature #2: 'AGE'
| nPatients | Mean (Std.Dev) | |
|---|---|---|
| ALL | 223 | 69.5 (11.4) |
| subtype1 | 62 | 68.1 (9.3) |
| subtype2 | 48 | 70.3 (11.8) |
| subtype3 | 73 | 69.6 (12.3) |
| subtype4 | 40 | 70.2 (12.2) |
Figure S2. Get High-res Image Clustering Approach #1: 'mRNA CNMF subtypes' versus Clinical Feature #2: 'AGE'
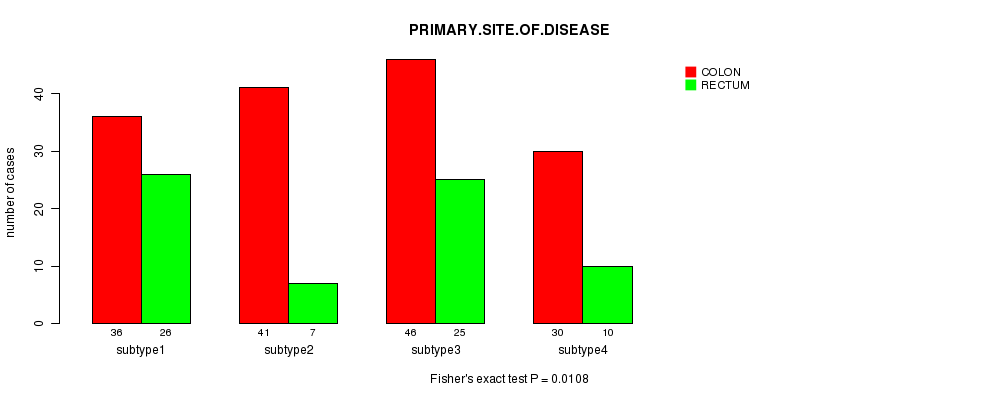
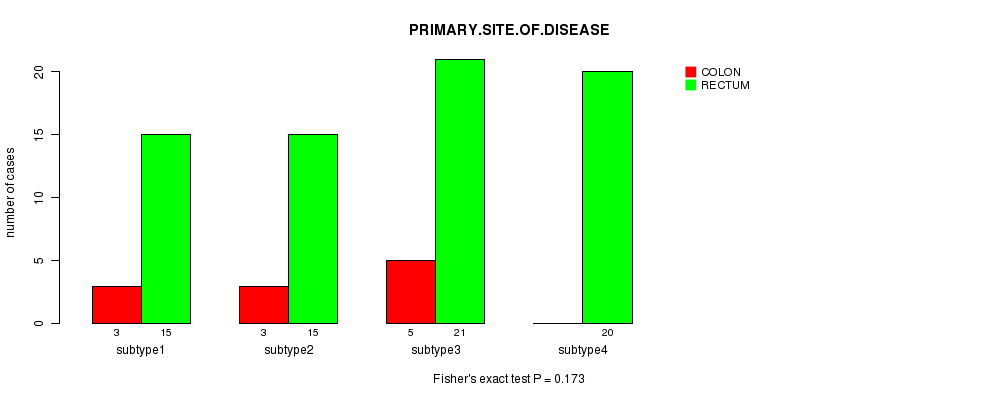
P value = 0.0108 (Fisher's exact test)
Table S4. Clustering Approach #1: 'mRNA CNMF subtypes' versus Clinical Feature #3: 'PRIMARY.SITE.OF.DISEASE'
| nPatients | COLON | RECTUM |
|---|---|---|
| ALL | 153 | 68 |
| subtype1 | 36 | 26 |
| subtype2 | 41 | 7 |
| subtype3 | 46 | 25 |
| subtype4 | 30 | 10 |
Figure S3. Get High-res Image Clustering Approach #1: 'mRNA CNMF subtypes' versus Clinical Feature #3: 'PRIMARY.SITE.OF.DISEASE'
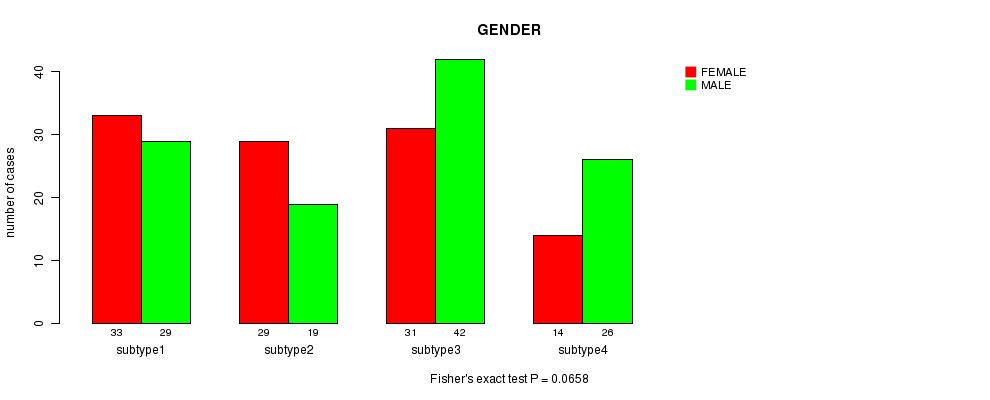
P value = 0.0658 (Fisher's exact test)
Table S5. Clustering Approach #1: 'mRNA CNMF subtypes' versus Clinical Feature #4: 'GENDER'
| nPatients | FEMALE | MALE |
|---|---|---|
| ALL | 107 | 116 |
| subtype1 | 33 | 29 |
| subtype2 | 29 | 19 |
| subtype3 | 31 | 42 |
| subtype4 | 14 | 26 |
Figure S4. Get High-res Image Clustering Approach #1: 'mRNA CNMF subtypes' versus Clinical Feature #4: 'GENDER'
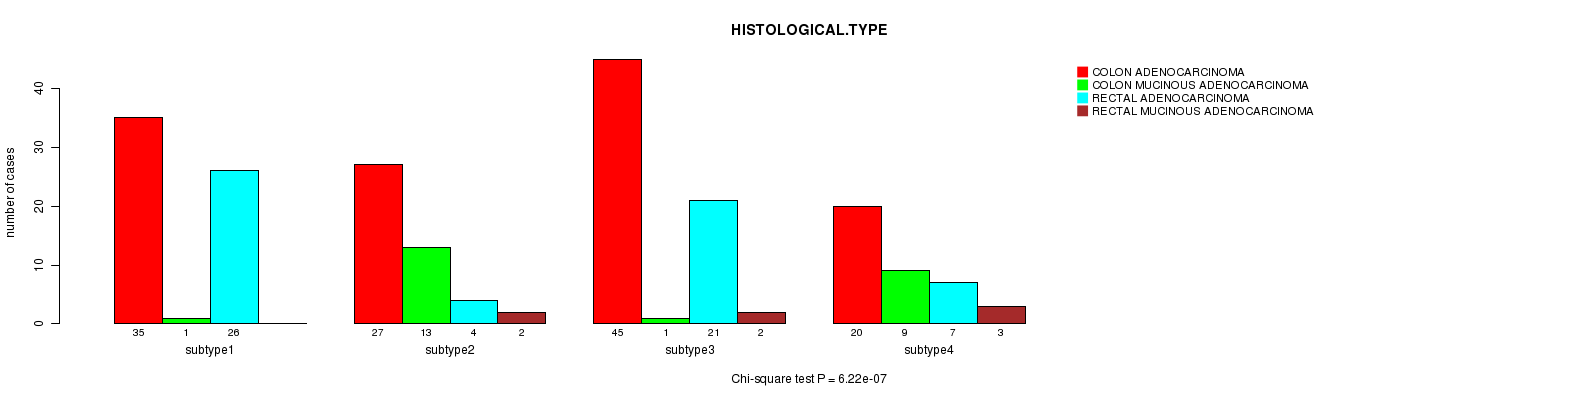
P value = 6.22e-07 (Chi-square test)
Table S6. Clustering Approach #1: 'mRNA CNMF subtypes' versus Clinical Feature #5: 'HISTOLOGICAL.TYPE'
| nPatients | COLON ADENOCARCINOMA | COLON MUCINOUS ADENOCARCINOMA | RECTAL ADENOCARCINOMA | RECTAL MUCINOUS ADENOCARCINOMA |
|---|---|---|---|---|
| ALL | 127 | 24 | 58 | 7 |
| subtype1 | 35 | 1 | 26 | 0 |
| subtype2 | 27 | 13 | 4 | 2 |
| subtype3 | 45 | 1 | 21 | 2 |
| subtype4 | 20 | 9 | 7 | 3 |
Figure S5. Get High-res Image Clustering Approach #1: 'mRNA CNMF subtypes' versus Clinical Feature #5: 'HISTOLOGICAL.TYPE'
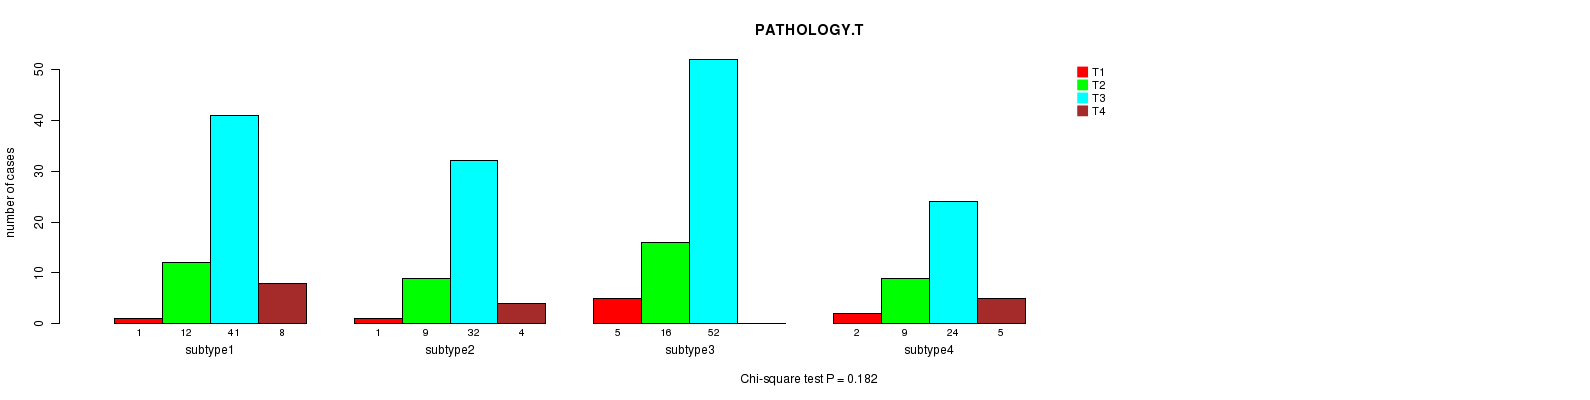
P value = 0.182 (Chi-square test)
Table S7. Clustering Approach #1: 'mRNA CNMF subtypes' versus Clinical Feature #6: 'PATHOLOGY.T'
| nPatients | T1 | T2 | T3 | T4 |
|---|---|---|---|---|
| ALL | 9 | 46 | 149 | 17 |
| subtype1 | 1 | 12 | 41 | 8 |
| subtype2 | 1 | 9 | 32 | 4 |
| subtype3 | 5 | 16 | 52 | 0 |
| subtype4 | 2 | 9 | 24 | 5 |
Figure S6. Get High-res Image Clustering Approach #1: 'mRNA CNMF subtypes' versus Clinical Feature #6: 'PATHOLOGY.T'
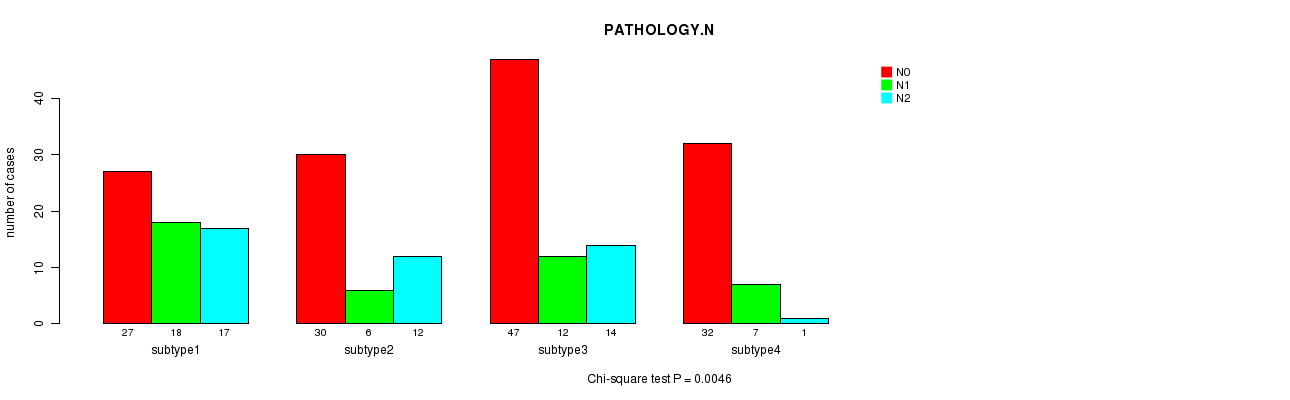
P value = 0.0046 (Chi-square test)
Table S8. Clustering Approach #1: 'mRNA CNMF subtypes' versus Clinical Feature #7: 'PATHOLOGY.N'
| nPatients | N0 | N1 | N2 |
|---|---|---|---|
| ALL | 136 | 43 | 44 |
| subtype1 | 27 | 18 | 17 |
| subtype2 | 30 | 6 | 12 |
| subtype3 | 47 | 12 | 14 |
| subtype4 | 32 | 7 | 1 |
Figure S7. Get High-res Image Clustering Approach #1: 'mRNA CNMF subtypes' versus Clinical Feature #7: 'PATHOLOGY.N'
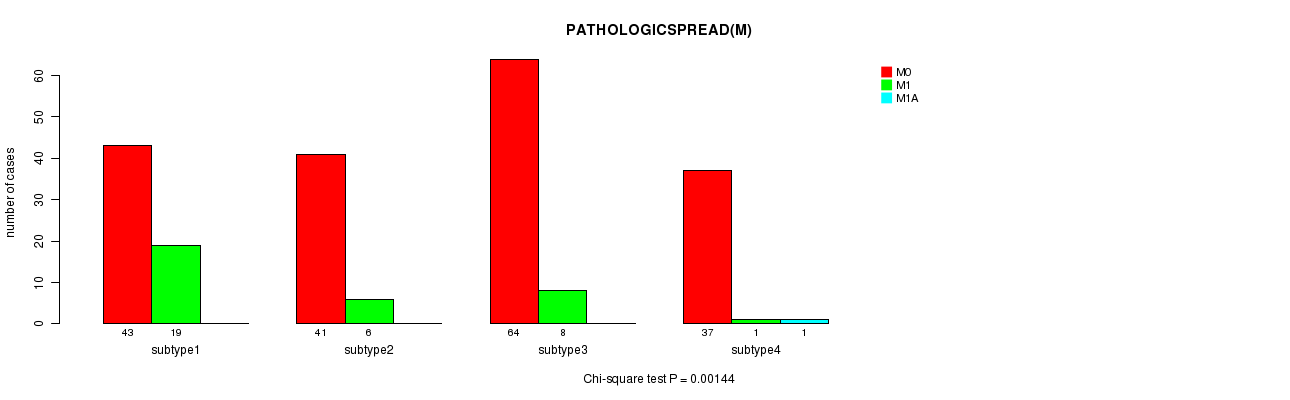
P value = 0.00144 (Chi-square test)
Table S9. Clustering Approach #1: 'mRNA CNMF subtypes' versus Clinical Feature #8: 'PATHOLOGICSPREAD(M)'
| nPatients | M0 | M1 | M1A |
|---|---|---|---|
| ALL | 185 | 34 | 1 |
| subtype1 | 43 | 19 | 0 |
| subtype2 | 41 | 6 | 0 |
| subtype3 | 64 | 8 | 0 |
| subtype4 | 37 | 1 | 1 |
Figure S8. Get High-res Image Clustering Approach #1: 'mRNA CNMF subtypes' versus Clinical Feature #8: 'PATHOLOGICSPREAD(M)'
P value = 0.128 (Fisher's exact test)
Table S10. Clustering Approach #1: 'mRNA CNMF subtypes' versus Clinical Feature #9: 'NEOADJUVANT.THERAPY'
| nPatients | NO | YES |
|---|---|---|
| ALL | 215 | 8 |
| subtype1 | 59 | 3 |
| subtype2 | 44 | 4 |
| subtype3 | 72 | 1 |
| subtype4 | 40 | 0 |
Figure S9. Get High-res Image Clustering Approach #1: 'mRNA CNMF subtypes' versus Clinical Feature #9: 'NEOADJUVANT.THERAPY'
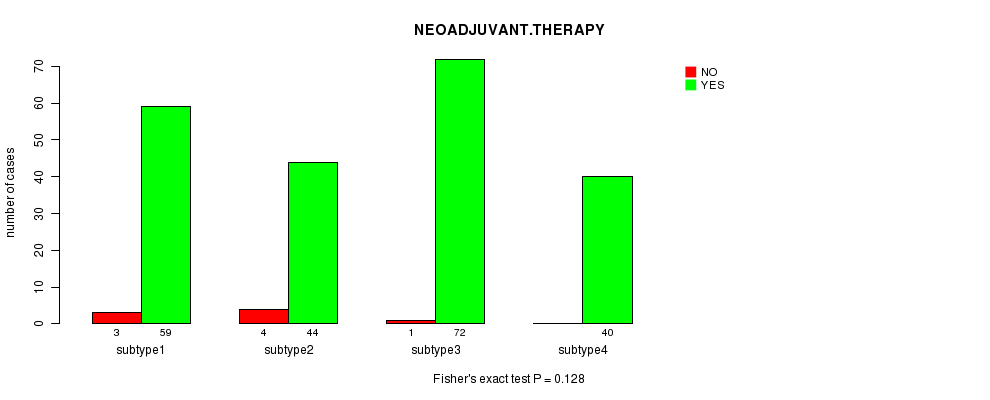
Table S11. Get Full Table Description of clustering approach #2: 'mRNA cHierClus subtypes'
| Cluster Labels | 1 | 2 | 3 |
|---|---|---|---|
| Number of samples | 46 | 64 | 113 |
P value = 0.718 (logrank test)
Table S12. Clustering Approach #2: 'mRNA cHierClus subtypes' versus Clinical Feature #1: 'Time to Death'
| nPatients | nDeath | Duration Range (Median), Month | |
|---|---|---|---|
| ALL | 113 | 15 | 0.9 - 52.0 (5.0) |
| subtype1 | 11 | 1 | 0.9 - 17.0 (1.0) |
| subtype2 | 35 | 3 | 1.0 - 41.0 (1.0) |
| subtype3 | 67 | 11 | 0.9 - 52.0 (12.0) |
Figure S10. Get High-res Image Clustering Approach #2: 'mRNA cHierClus subtypes' versus Clinical Feature #1: 'Time to Death'

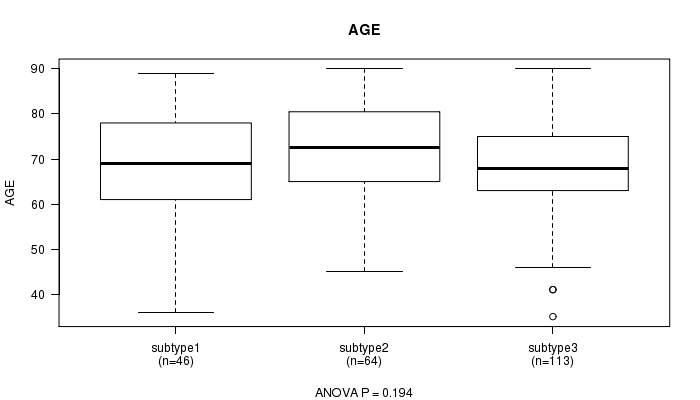
P value = 0.194 (ANOVA)
Table S13. Clustering Approach #2: 'mRNA cHierClus subtypes' versus Clinical Feature #2: 'AGE'
| nPatients | Mean (Std.Dev) | |
|---|---|---|
| ALL | 223 | 69.5 (11.4) |
| subtype1 | 46 | 68.0 (12.7) |
| subtype2 | 64 | 71.6 (11.3) |
| subtype3 | 113 | 68.8 (10.8) |
Figure S11. Get High-res Image Clustering Approach #2: 'mRNA cHierClus subtypes' versus Clinical Feature #2: 'AGE'
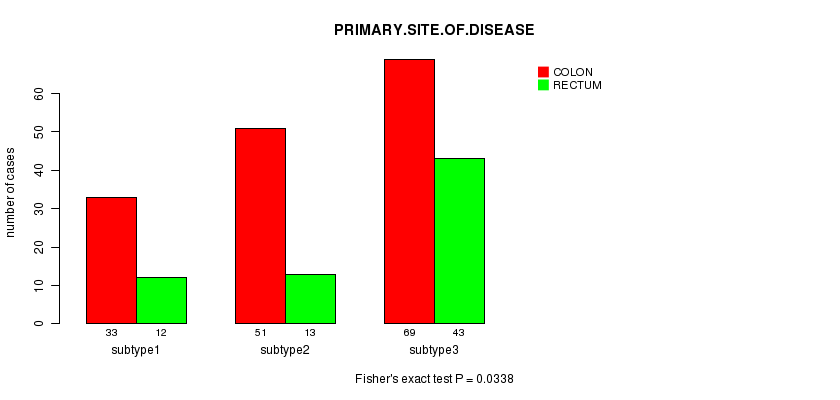
P value = 0.0338 (Fisher's exact test)
Table S14. Clustering Approach #2: 'mRNA cHierClus subtypes' versus Clinical Feature #3: 'PRIMARY.SITE.OF.DISEASE'
| nPatients | COLON | RECTUM |
|---|---|---|
| ALL | 153 | 68 |
| subtype1 | 33 | 12 |
| subtype2 | 51 | 13 |
| subtype3 | 69 | 43 |
Figure S12. Get High-res Image Clustering Approach #2: 'mRNA cHierClus subtypes' versus Clinical Feature #3: 'PRIMARY.SITE.OF.DISEASE'
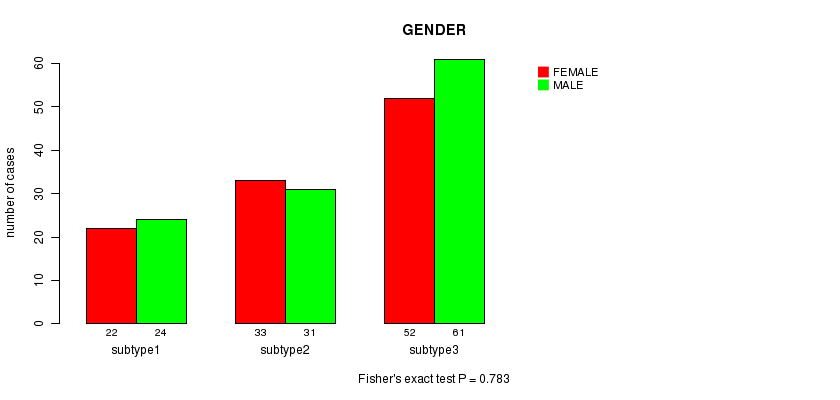
P value = 0.783 (Fisher's exact test)
Table S15. Clustering Approach #2: 'mRNA cHierClus subtypes' versus Clinical Feature #4: 'GENDER'
| nPatients | FEMALE | MALE |
|---|---|---|
| ALL | 107 | 116 |
| subtype1 | 22 | 24 |
| subtype2 | 33 | 31 |
| subtype3 | 52 | 61 |
Figure S13. Get High-res Image Clustering Approach #2: 'mRNA cHierClus subtypes' versus Clinical Feature #4: 'GENDER'
P value = 4.54e-08 (Chi-square test)
Table S16. Clustering Approach #2: 'mRNA cHierClus subtypes' versus Clinical Feature #5: 'HISTOLOGICAL.TYPE'
| nPatients | COLON ADENOCARCINOMA | COLON MUCINOUS ADENOCARCINOMA | RECTAL ADENOCARCINOMA | RECTAL MUCINOUS ADENOCARCINOMA |
|---|---|---|---|---|
| ALL | 127 | 24 | 58 | 7 |
| subtype1 | 32 | 1 | 11 | 1 |
| subtype2 | 29 | 20 | 9 | 3 |
| subtype3 | 66 | 3 | 38 | 3 |
Figure S14. Get High-res Image Clustering Approach #2: 'mRNA cHierClus subtypes' versus Clinical Feature #5: 'HISTOLOGICAL.TYPE'
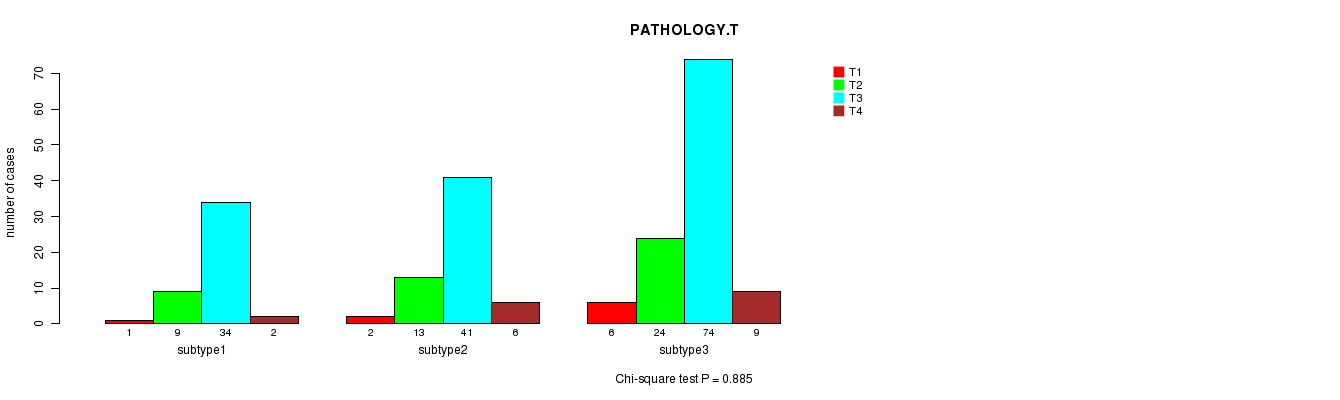
P value = 0.885 (Chi-square test)
Table S17. Clustering Approach #2: 'mRNA cHierClus subtypes' versus Clinical Feature #6: 'PATHOLOGY.T'
| nPatients | T1 | T2 | T3 | T4 |
|---|---|---|---|---|
| ALL | 9 | 46 | 149 | 17 |
| subtype1 | 1 | 9 | 34 | 2 |
| subtype2 | 2 | 13 | 41 | 6 |
| subtype3 | 6 | 24 | 74 | 9 |
Figure S15. Get High-res Image Clustering Approach #2: 'mRNA cHierClus subtypes' versus Clinical Feature #6: 'PATHOLOGY.T'
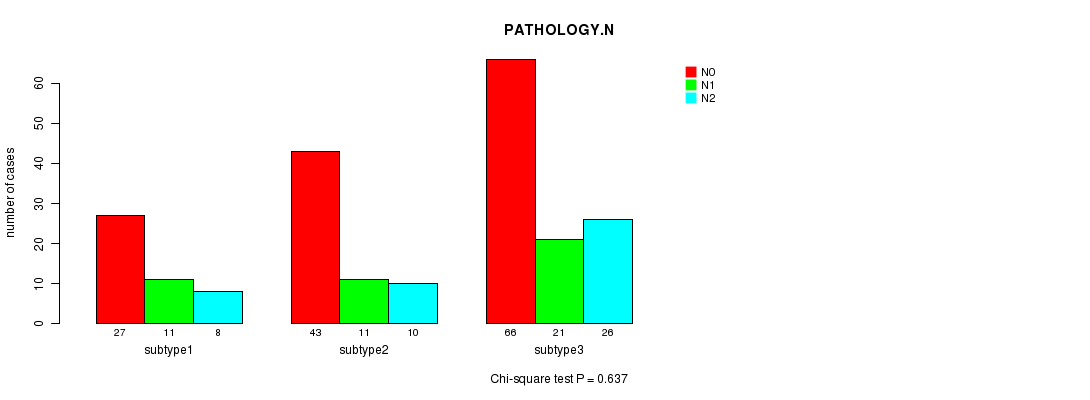
P value = 0.637 (Chi-square test)
Table S18. Clustering Approach #2: 'mRNA cHierClus subtypes' versus Clinical Feature #7: 'PATHOLOGY.N'
| nPatients | N0 | N1 | N2 |
|---|---|---|---|
| ALL | 136 | 43 | 44 |
| subtype1 | 27 | 11 | 8 |
| subtype2 | 43 | 11 | 10 |
| subtype3 | 66 | 21 | 26 |
Figure S16. Get High-res Image Clustering Approach #2: 'mRNA cHierClus subtypes' versus Clinical Feature #7: 'PATHOLOGY.N'
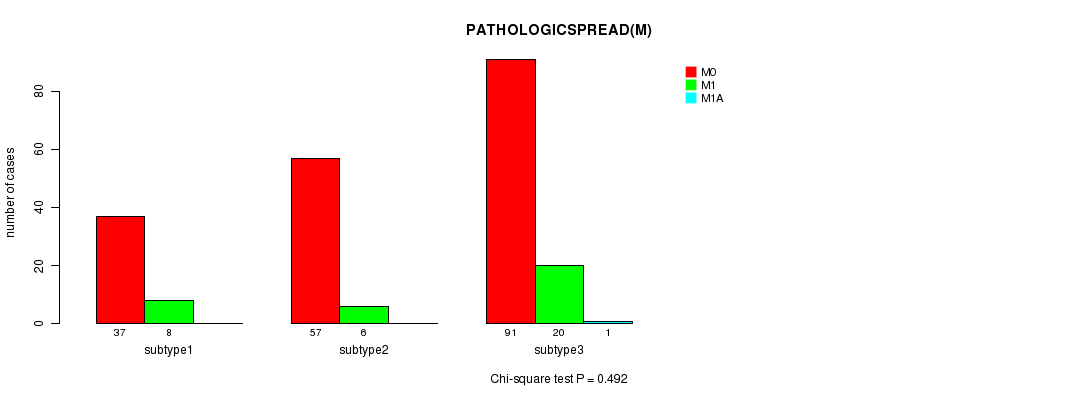
P value = 0.492 (Chi-square test)
Table S19. Clustering Approach #2: 'mRNA cHierClus subtypes' versus Clinical Feature #8: 'PATHOLOGICSPREAD(M)'
| nPatients | M0 | M1 | M1A |
|---|---|---|---|
| ALL | 185 | 34 | 1 |
| subtype1 | 37 | 8 | 0 |
| subtype2 | 57 | 6 | 0 |
| subtype3 | 91 | 20 | 1 |
Figure S17. Get High-res Image Clustering Approach #2: 'mRNA cHierClus subtypes' versus Clinical Feature #8: 'PATHOLOGICSPREAD(M)'
P value = 0.71 (Fisher's exact test)
Table S20. Clustering Approach #2: 'mRNA cHierClus subtypes' versus Clinical Feature #9: 'NEOADJUVANT.THERAPY'
| nPatients | NO | YES |
|---|---|---|
| ALL | 215 | 8 |
| subtype1 | 44 | 2 |
| subtype2 | 61 | 3 |
| subtype3 | 110 | 3 |
Figure S18. Get High-res Image Clustering Approach #2: 'mRNA cHierClus subtypes' versus Clinical Feature #9: 'NEOADJUVANT.THERAPY'
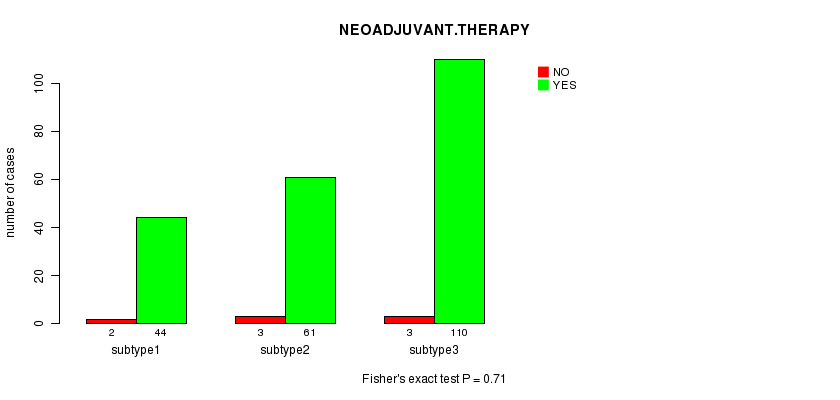
Table S21. Get Full Table Description of clustering approach #3: 'METHLYATION CNMF'
| Cluster Labels | 1 | 2 | 3 |
|---|---|---|---|
| Number of samples | 104 | 48 | 83 |
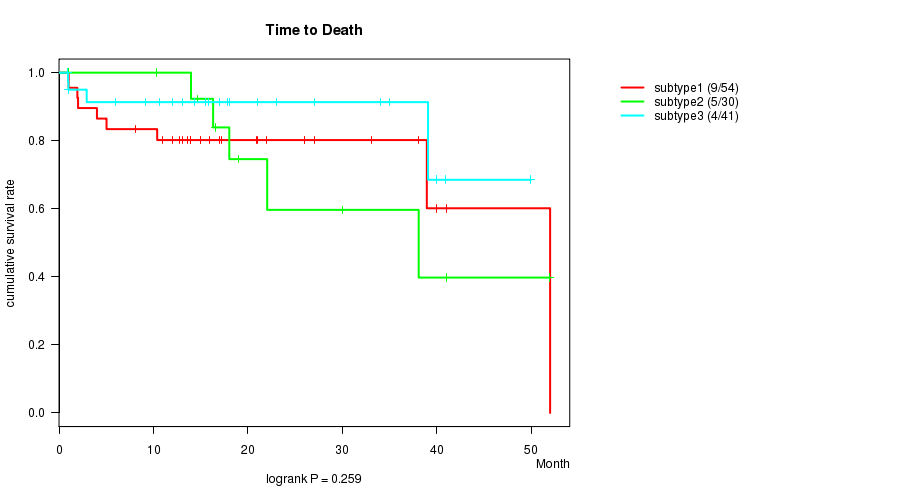
P value = 0.259 (logrank test)
Table S22. Clustering Approach #3: 'METHLYATION CNMF' versus Clinical Feature #1: 'Time to Death'
| nPatients | nDeath | Duration Range (Median), Month | |
|---|---|---|---|
| ALL | 125 | 18 | 0.9 - 52.0 (10.3) |
| subtype1 | 54 | 9 | 0.9 - 52.0 (6.6) |
| subtype2 | 30 | 5 | 0.9 - 52.0 (1.0) |
| subtype3 | 41 | 4 | 0.9 - 49.9 (12.0) |
Figure S19. Get High-res Image Clustering Approach #3: 'METHLYATION CNMF' versus Clinical Feature #1: 'Time to Death'
P value = 0.00215 (ANOVA)
Table S23. Clustering Approach #3: 'METHLYATION CNMF' versus Clinical Feature #2: 'AGE'
| nPatients | Mean (Std.Dev) | |
|---|---|---|
| ALL | 235 | 69.4 (11.6) |
| subtype1 | 104 | 66.8 (11.5) |
| subtype2 | 48 | 73.6 (12.1) |
| subtype3 | 83 | 70.3 (10.6) |
Figure S20. Get High-res Image Clustering Approach #3: 'METHLYATION CNMF' versus Clinical Feature #2: 'AGE'
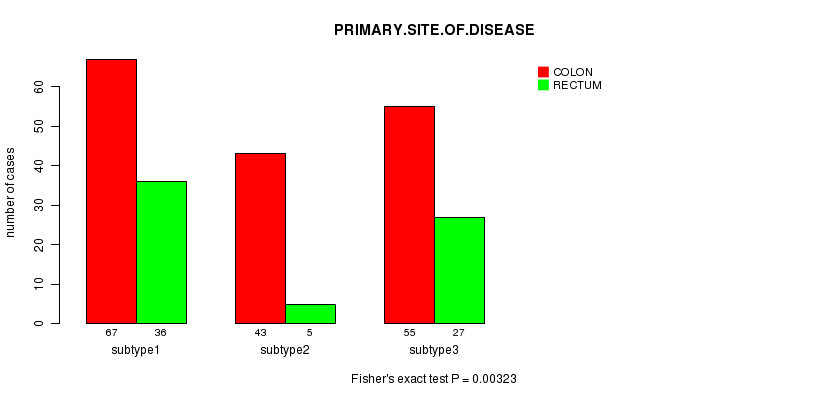
P value = 0.00323 (Fisher's exact test)
Table S24. Clustering Approach #3: 'METHLYATION CNMF' versus Clinical Feature #3: 'PRIMARY.SITE.OF.DISEASE'
| nPatients | COLON | RECTUM |
|---|---|---|
| ALL | 165 | 68 |
| subtype1 | 67 | 36 |
| subtype2 | 43 | 5 |
| subtype3 | 55 | 27 |
Figure S21. Get High-res Image Clustering Approach #3: 'METHLYATION CNMF' versus Clinical Feature #3: 'PRIMARY.SITE.OF.DISEASE'
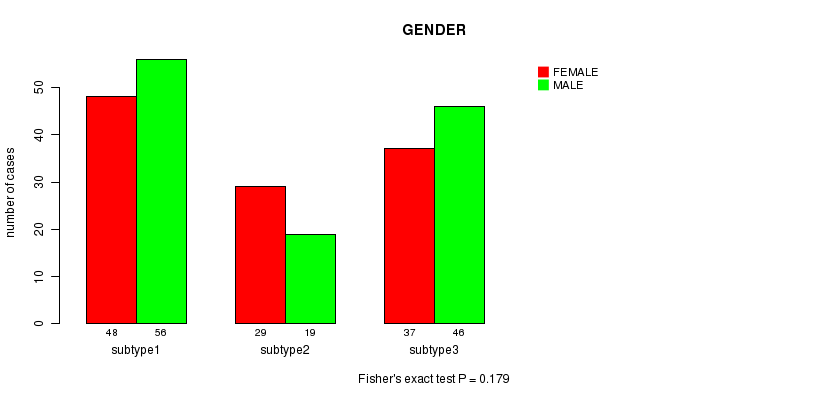
P value = 0.179 (Fisher's exact test)
Table S25. Clustering Approach #3: 'METHLYATION CNMF' versus Clinical Feature #4: 'GENDER'
| nPatients | FEMALE | MALE |
|---|---|---|
| ALL | 114 | 121 |
| subtype1 | 48 | 56 |
| subtype2 | 29 | 19 |
| subtype3 | 37 | 46 |
Figure S22. Get High-res Image Clustering Approach #3: 'METHLYATION CNMF' versus Clinical Feature #4: 'GENDER'
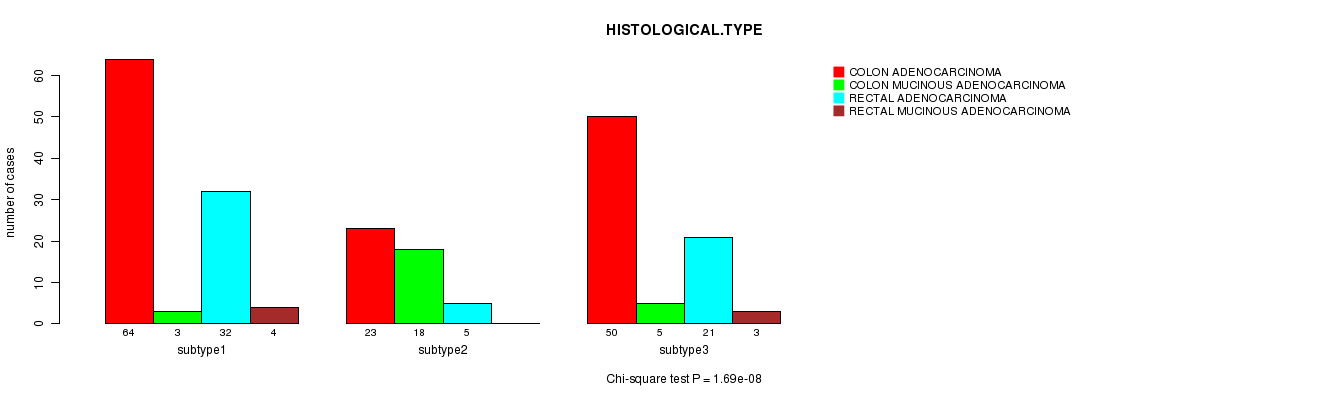
P value = 1.69e-08 (Chi-square test)
Table S26. Clustering Approach #3: 'METHLYATION CNMF' versus Clinical Feature #5: 'HISTOLOGICAL.TYPE'
| nPatients | COLON ADENOCARCINOMA | COLON MUCINOUS ADENOCARCINOMA | RECTAL ADENOCARCINOMA | RECTAL MUCINOUS ADENOCARCINOMA |
|---|---|---|---|---|
| ALL | 137 | 26 | 58 | 7 |
| subtype1 | 64 | 3 | 32 | 4 |
| subtype2 | 23 | 18 | 5 | 0 |
| subtype3 | 50 | 5 | 21 | 3 |
Figure S23. Get High-res Image Clustering Approach #3: 'METHLYATION CNMF' versus Clinical Feature #5: 'HISTOLOGICAL.TYPE'
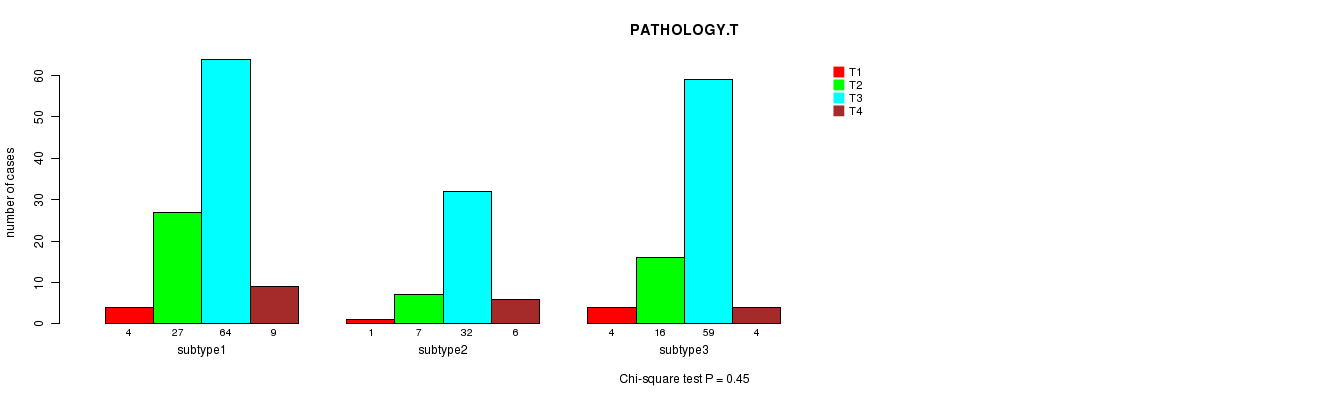
P value = 0.45 (Chi-square test)
Table S27. Clustering Approach #3: 'METHLYATION CNMF' versus Clinical Feature #6: 'PATHOLOGY.T'
| nPatients | T1 | T2 | T3 | T4 |
|---|---|---|---|---|
| ALL | 9 | 50 | 155 | 19 |
| subtype1 | 4 | 27 | 64 | 9 |
| subtype2 | 1 | 7 | 32 | 6 |
| subtype3 | 4 | 16 | 59 | 4 |
Figure S24. Get High-res Image Clustering Approach #3: 'METHLYATION CNMF' versus Clinical Feature #6: 'PATHOLOGY.T'
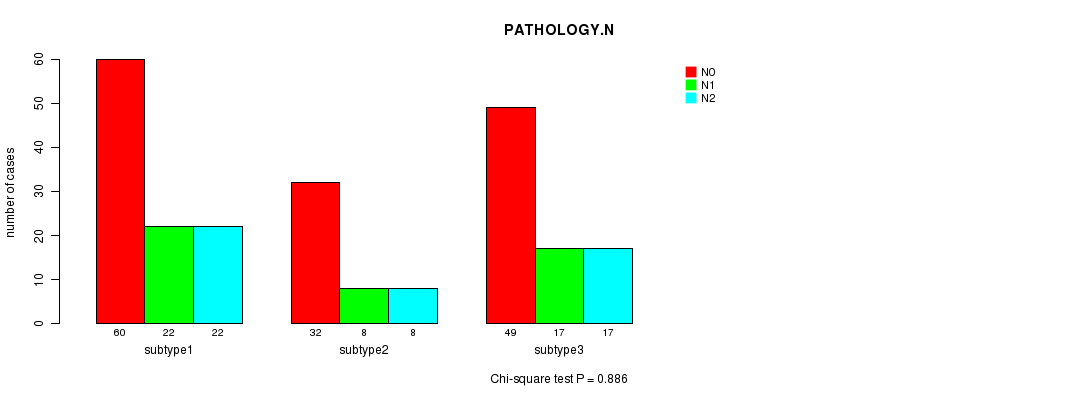
P value = 0.886 (Chi-square test)
Table S28. Clustering Approach #3: 'METHLYATION CNMF' versus Clinical Feature #7: 'PATHOLOGY.N'
| nPatients | N0 | N1 | N2 |
|---|---|---|---|
| ALL | 141 | 47 | 47 |
| subtype1 | 60 | 22 | 22 |
| subtype2 | 32 | 8 | 8 |
| subtype3 | 49 | 17 | 17 |
Figure S25. Get High-res Image Clustering Approach #3: 'METHLYATION CNMF' versus Clinical Feature #7: 'PATHOLOGY.N'
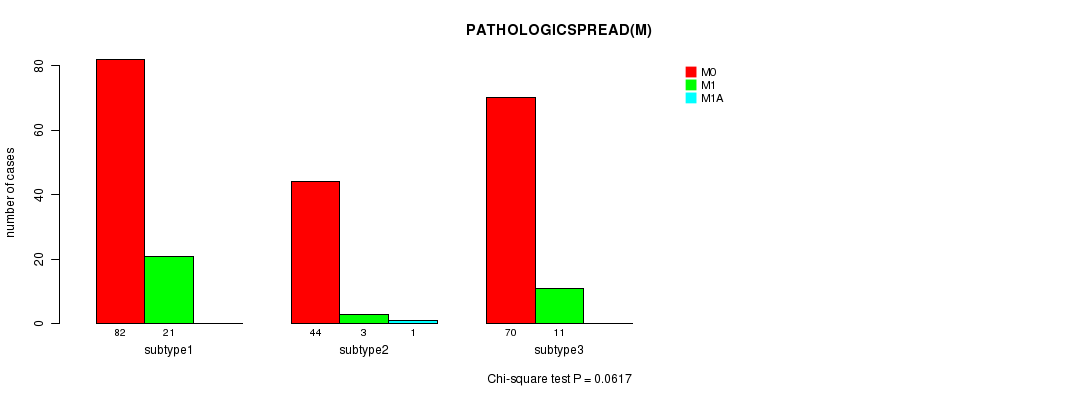
P value = 0.0617 (Chi-square test)
Table S29. Clustering Approach #3: 'METHLYATION CNMF' versus Clinical Feature #8: 'PATHOLOGICSPREAD(M)'
| nPatients | M0 | M1 | M1A |
|---|---|---|---|
| ALL | 196 | 35 | 1 |
| subtype1 | 82 | 21 | 0 |
| subtype2 | 44 | 3 | 1 |
| subtype3 | 70 | 11 | 0 |
Figure S26. Get High-res Image Clustering Approach #3: 'METHLYATION CNMF' versus Clinical Feature #8: 'PATHOLOGICSPREAD(M)'
P value = 0.901 (Fisher's exact test)
Table S30. Clustering Approach #3: 'METHLYATION CNMF' versus Clinical Feature #9: 'NEOADJUVANT.THERAPY'
| nPatients | NO | YES |
|---|---|---|
| ALL | 227 | 8 |
| subtype1 | 101 | 3 |
| subtype2 | 46 | 2 |
| subtype3 | 80 | 3 |
Figure S27. Get High-res Image Clustering Approach #3: 'METHLYATION CNMF' versus Clinical Feature #9: 'NEOADJUVANT.THERAPY'
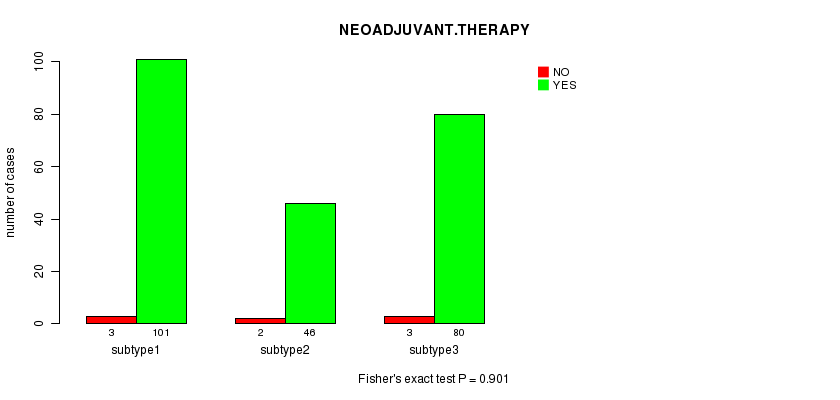
Table S31. Get Full Table Description of clustering approach #4: 'RNAseq CNMF subtypes'
| Cluster Labels | 1 | 2 | 3 | 4 |
|---|---|---|---|---|
| Number of samples | 18 | 19 | 26 | 20 |
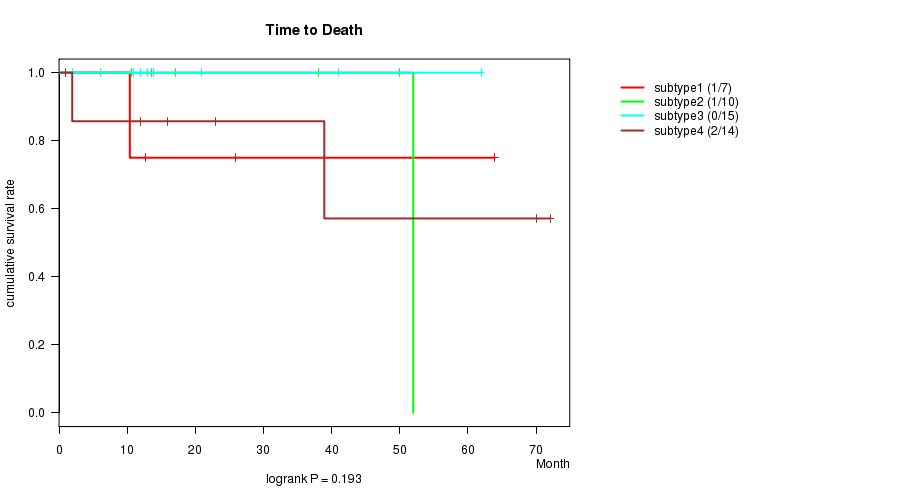
P value = 0.193 (logrank test)
Table S32. Clustering Approach #4: 'RNAseq CNMF subtypes' versus Clinical Feature #1: 'Time to Death'
| nPatients | nDeath | Duration Range (Median), Month | |
|---|---|---|---|
| ALL | 46 | 4 | 0.9 - 72.1 (8.2) |
| subtype1 | 7 | 1 | 1.0 - 64.0 (10.4) |
| subtype2 | 10 | 1 | 1.0 - 52.0 (12.1) |
| subtype3 | 15 | 0 | 0.9 - 61.9 (6.0) |
| subtype4 | 14 | 2 | 0.9 - 72.1 (1.5) |
Figure S28. Get High-res Image Clustering Approach #4: 'RNAseq CNMF subtypes' versus Clinical Feature #1: 'Time to Death'
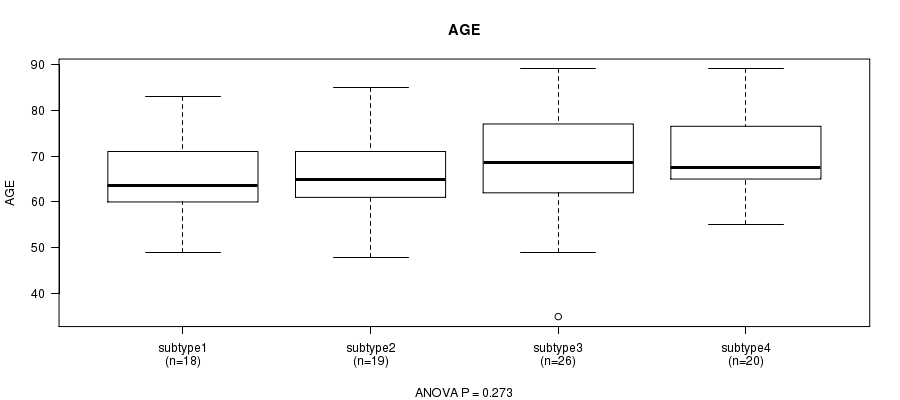
P value = 0.273 (ANOVA)
Table S33. Clustering Approach #4: 'RNAseq CNMF subtypes' versus Clinical Feature #2: 'AGE'
| nPatients | Mean (Std.Dev) | |
|---|---|---|
| ALL | 83 | 67.6 (10.5) |
| subtype1 | 18 | 64.7 (9.3) |
| subtype2 | 19 | 65.9 (9.3) |
| subtype3 | 26 | 68.2 (12.5) |
| subtype4 | 20 | 70.9 (9.3) |
Figure S29. Get High-res Image Clustering Approach #4: 'RNAseq CNMF subtypes' versus Clinical Feature #2: 'AGE'
P value = 0.173 (Fisher's exact test)
Table S34. Clustering Approach #4: 'RNAseq CNMF subtypes' versus Clinical Feature #3: 'PRIMARY.SITE.OF.DISEASE'
| nPatients | COLON | RECTUM |
|---|---|---|
| ALL | 11 | 71 |
| subtype1 | 3 | 15 |
| subtype2 | 3 | 15 |
| subtype3 | 5 | 21 |
| subtype4 | 0 | 20 |
Figure S30. Get High-res Image Clustering Approach #4: 'RNAseq CNMF subtypes' versus Clinical Feature #3: 'PRIMARY.SITE.OF.DISEASE'
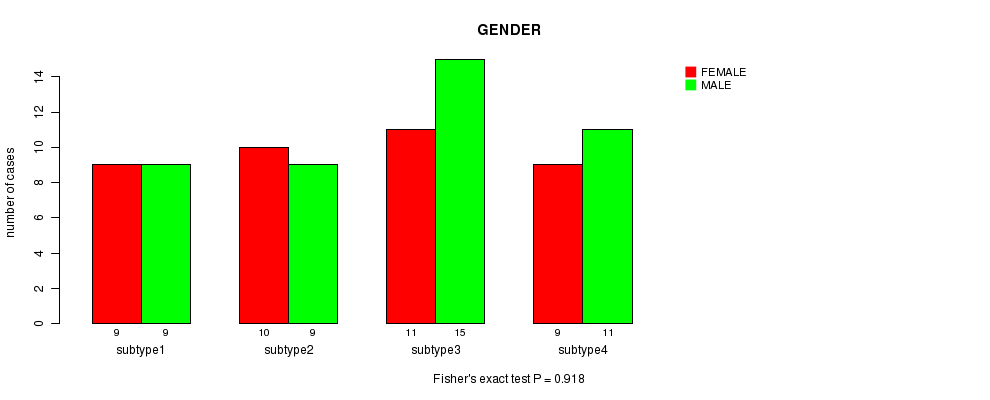
P value = 0.918 (Fisher's exact test)
Table S35. Clustering Approach #4: 'RNAseq CNMF subtypes' versus Clinical Feature #4: 'GENDER'
| nPatients | FEMALE | MALE |
|---|---|---|
| ALL | 39 | 44 |
| subtype1 | 9 | 9 |
| subtype2 | 10 | 9 |
| subtype3 | 11 | 15 |
| subtype4 | 9 | 11 |
Figure S31. Get High-res Image Clustering Approach #4: 'RNAseq CNMF subtypes' versus Clinical Feature #4: 'GENDER'
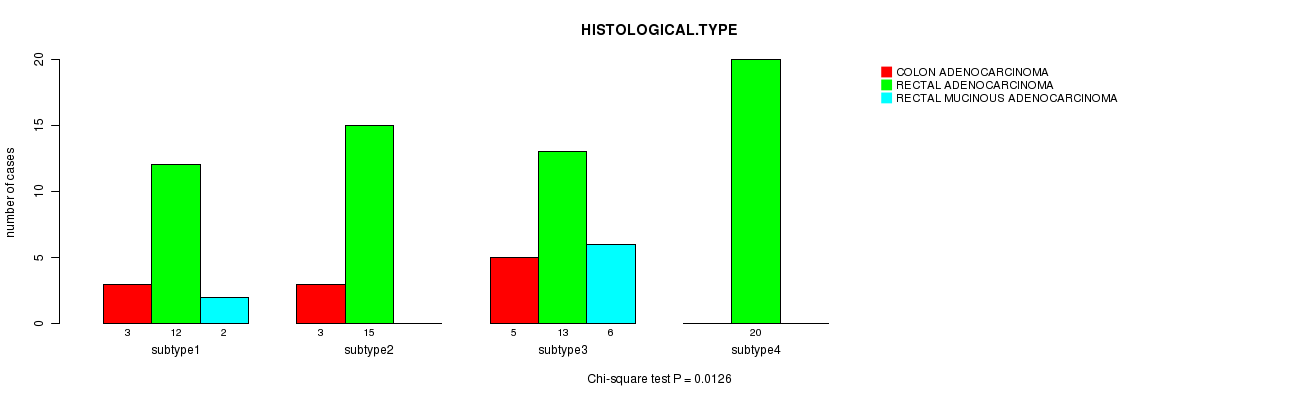
P value = 0.0126 (Chi-square test)
Table S36. Clustering Approach #4: 'RNAseq CNMF subtypes' versus Clinical Feature #5: 'HISTOLOGICAL.TYPE'
| nPatients | COLON ADENOCARCINOMA | RECTAL ADENOCARCINOMA | RECTAL MUCINOUS ADENOCARCINOMA |
|---|---|---|---|
| ALL | 11 | 60 | 8 |
| subtype1 | 3 | 12 | 2 |
| subtype2 | 3 | 15 | 0 |
| subtype3 | 5 | 13 | 6 |
| subtype4 | 0 | 20 | 0 |
Figure S32. Get High-res Image Clustering Approach #4: 'RNAseq CNMF subtypes' versus Clinical Feature #5: 'HISTOLOGICAL.TYPE'
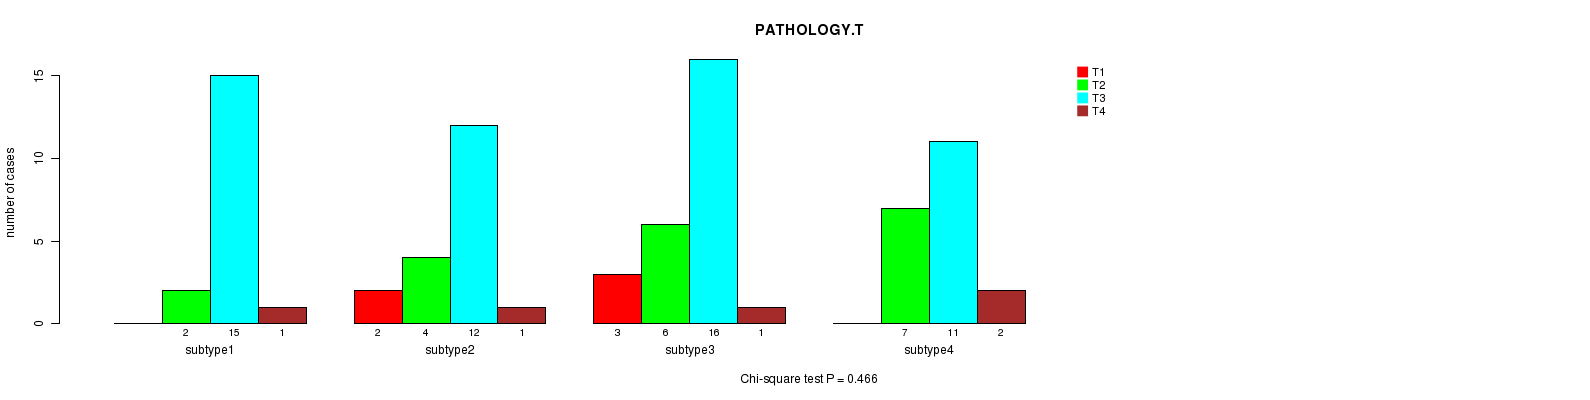
P value = 0.466 (Chi-square test)
Table S37. Clustering Approach #4: 'RNAseq CNMF subtypes' versus Clinical Feature #6: 'PATHOLOGY.T'
| nPatients | T1 | T2 | T3 | T4 |
|---|---|---|---|---|
| ALL | 5 | 19 | 54 | 5 |
| subtype1 | 0 | 2 | 15 | 1 |
| subtype2 | 2 | 4 | 12 | 1 |
| subtype3 | 3 | 6 | 16 | 1 |
| subtype4 | 0 | 7 | 11 | 2 |
Figure S33. Get High-res Image Clustering Approach #4: 'RNAseq CNMF subtypes' versus Clinical Feature #6: 'PATHOLOGY.T'
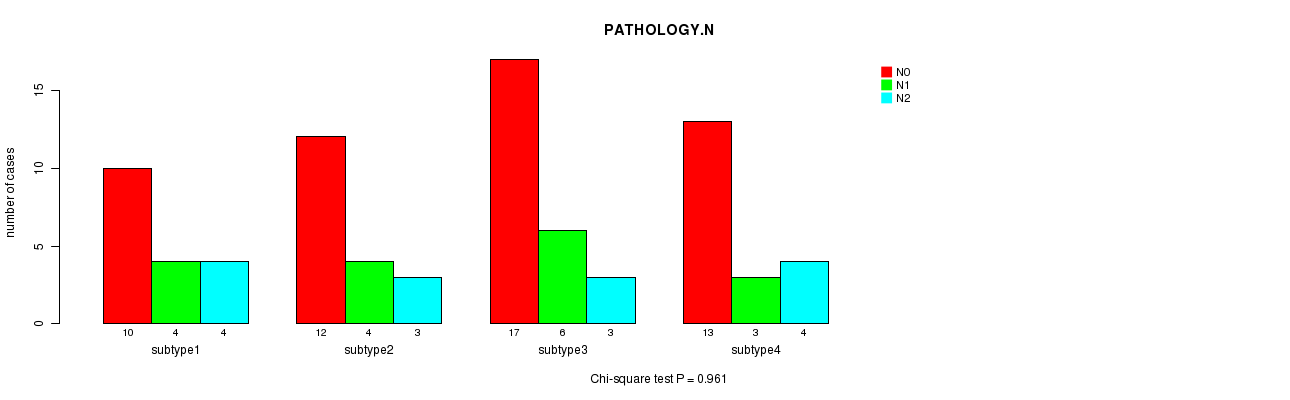
P value = 0.961 (Chi-square test)
Table S38. Clustering Approach #4: 'RNAseq CNMF subtypes' versus Clinical Feature #7: 'PATHOLOGY.N'
| nPatients | N0 | N1 | N2 |
|---|---|---|---|
| ALL | 52 | 17 | 14 |
| subtype1 | 10 | 4 | 4 |
| subtype2 | 12 | 4 | 3 |
| subtype3 | 17 | 6 | 3 |
| subtype4 | 13 | 3 | 4 |
Figure S34. Get High-res Image Clustering Approach #4: 'RNAseq CNMF subtypes' versus Clinical Feature #7: 'PATHOLOGY.N'
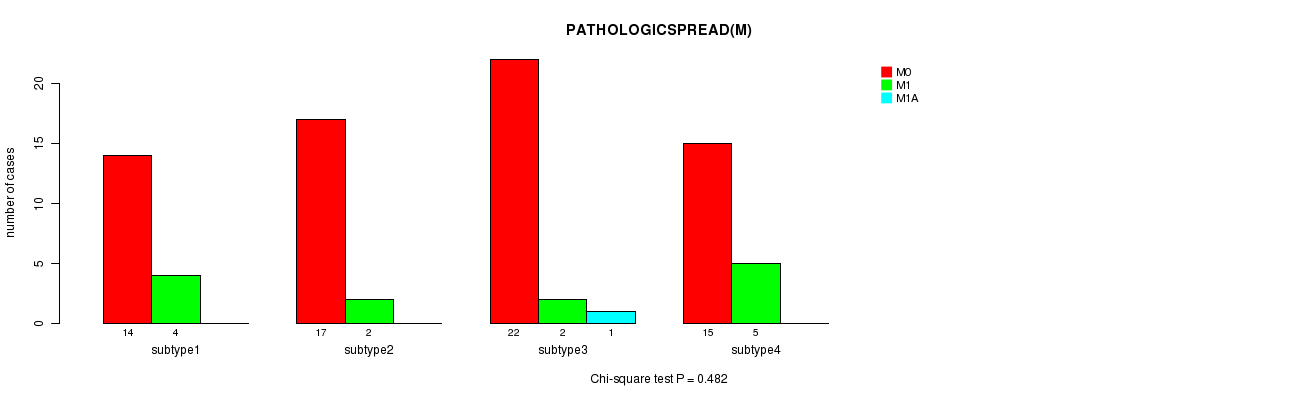
P value = 0.482 (Chi-square test)
Table S39. Clustering Approach #4: 'RNAseq CNMF subtypes' versus Clinical Feature #8: 'PATHOLOGICSPREAD(M)'
| nPatients | M0 | M1 | M1A |
|---|---|---|---|
| ALL | 68 | 13 | 1 |
| subtype1 | 14 | 4 | 0 |
| subtype2 | 17 | 2 | 0 |
| subtype3 | 22 | 2 | 1 |
| subtype4 | 15 | 5 | 0 |
Figure S35. Get High-res Image Clustering Approach #4: 'RNAseq CNMF subtypes' versus Clinical Feature #8: 'PATHOLOGICSPREAD(M)'
P value = 0.217 (Fisher's exact test)
Table S40. Clustering Approach #4: 'RNAseq CNMF subtypes' versus Clinical Feature #9: 'NEOADJUVANT.THERAPY'
| nPatients | NO | YES |
|---|---|---|
| ALL | 82 | 1 |
| subtype1 | 17 | 1 |
| subtype2 | 19 | 0 |
| subtype3 | 26 | 0 |
| subtype4 | 20 | 0 |
Figure S36. Get High-res Image Clustering Approach #4: 'RNAseq CNMF subtypes' versus Clinical Feature #9: 'NEOADJUVANT.THERAPY'
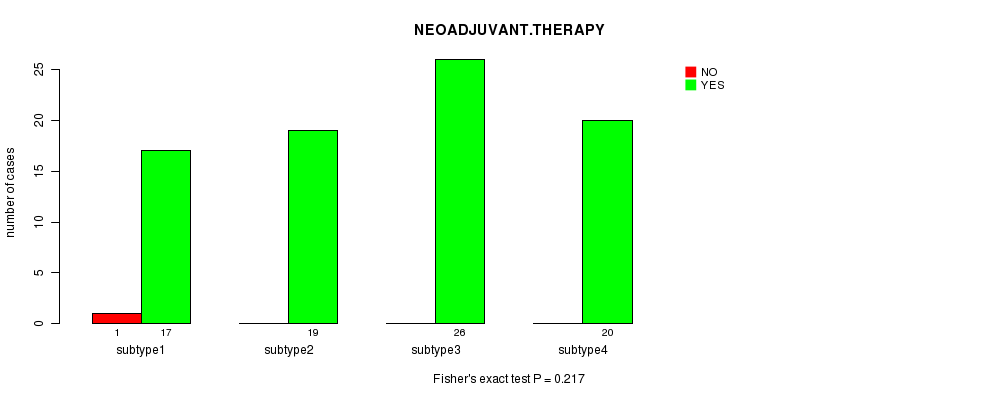
Table S41. Get Full Table Description of clustering approach #5: 'RNAseq cHierClus subtypes'
| Cluster Labels | 1 | 2 | 3 | 4 |
|---|---|---|---|---|
| Number of samples | 27 | 16 | 17 | 23 |
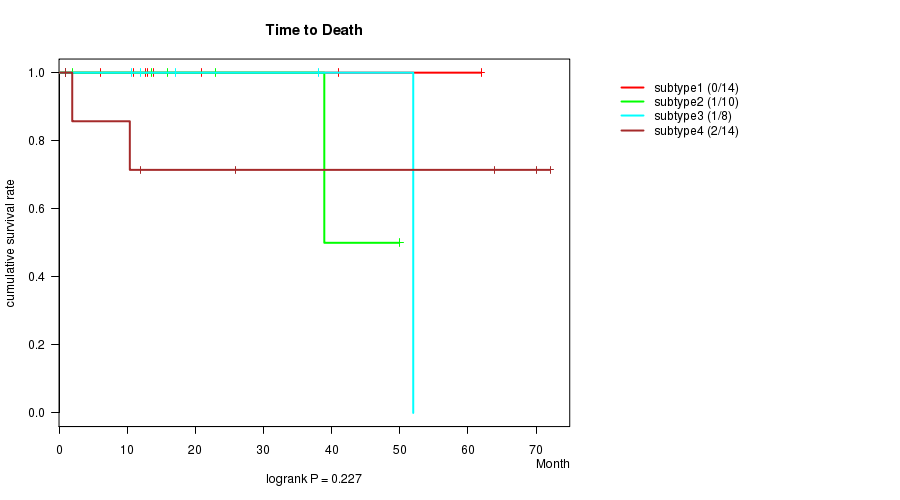
P value = 0.227 (logrank test)
Table S42. Clustering Approach #5: 'RNAseq cHierClus subtypes' versus Clinical Feature #1: 'Time to Death'
| nPatients | nDeath | Duration Range (Median), Month | |
|---|---|---|---|
| ALL | 46 | 4 | 0.9 - 72.1 (8.2) |
| subtype1 | 14 | 0 | 0.9 - 61.9 (8.5) |
| subtype2 | 10 | 1 | 0.9 - 49.9 (7.8) |
| subtype3 | 8 | 1 | 1.0 - 52.0 (11.3) |
| subtype4 | 14 | 2 | 1.0 - 72.1 (1.5) |
Figure S37. Get High-res Image Clustering Approach #5: 'RNAseq cHierClus subtypes' versus Clinical Feature #1: 'Time to Death'
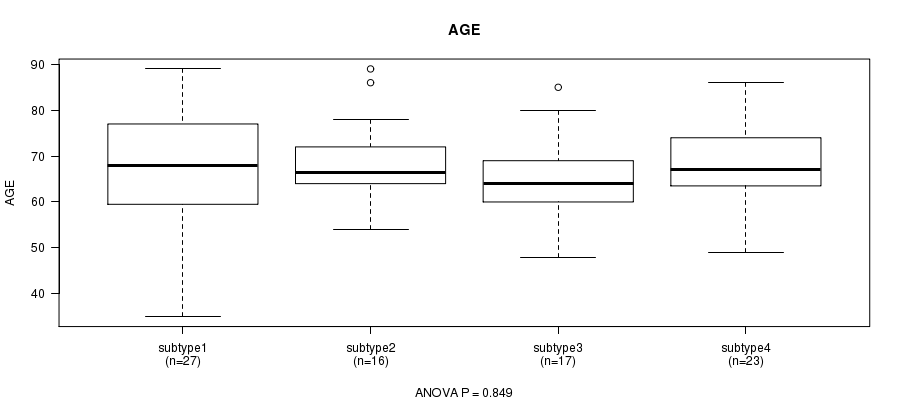
P value = 0.849 (ANOVA)
Table S43. Clustering Approach #5: 'RNAseq cHierClus subtypes' versus Clinical Feature #2: 'AGE'
| nPatients | Mean (Std.Dev) | |
|---|---|---|
| ALL | 83 | 67.6 (10.5) |
| subtype1 | 27 | 67.7 (13.2) |
| subtype2 | 16 | 68.8 (9.5) |
| subtype3 | 17 | 65.6 (9.4) |
| subtype4 | 23 | 68.0 (8.7) |
Figure S38. Get High-res Image Clustering Approach #5: 'RNAseq cHierClus subtypes' versus Clinical Feature #2: 'AGE'
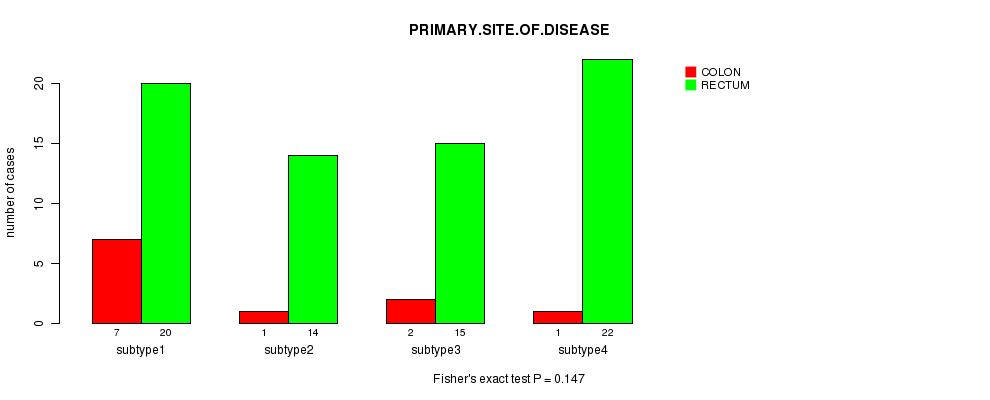
P value = 0.147 (Fisher's exact test)
Table S44. Clustering Approach #5: 'RNAseq cHierClus subtypes' versus Clinical Feature #3: 'PRIMARY.SITE.OF.DISEASE'
| nPatients | COLON | RECTUM |
|---|---|---|
| ALL | 11 | 71 |
| subtype1 | 7 | 20 |
| subtype2 | 1 | 14 |
| subtype3 | 2 | 15 |
| subtype4 | 1 | 22 |
Figure S39. Get High-res Image Clustering Approach #5: 'RNAseq cHierClus subtypes' versus Clinical Feature #3: 'PRIMARY.SITE.OF.DISEASE'
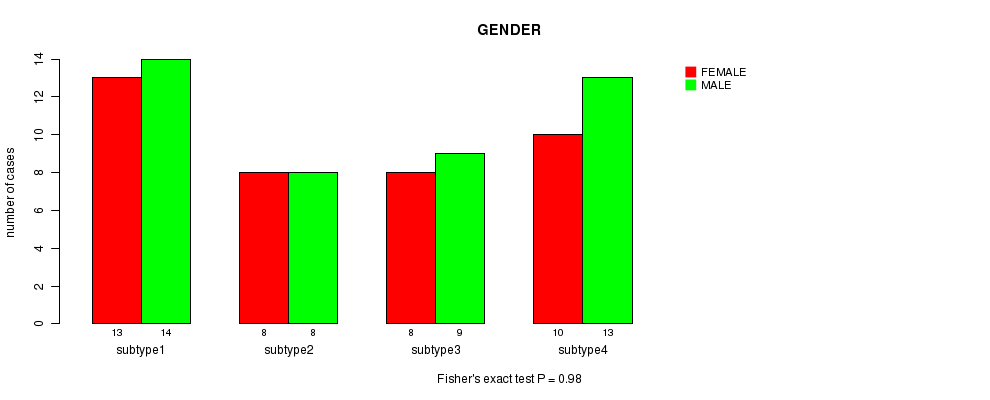
P value = 0.98 (Fisher's exact test)
Table S45. Clustering Approach #5: 'RNAseq cHierClus subtypes' versus Clinical Feature #4: 'GENDER'
| nPatients | FEMALE | MALE |
|---|---|---|
| ALL | 39 | 44 |
| subtype1 | 13 | 14 |
| subtype2 | 8 | 8 |
| subtype3 | 8 | 9 |
| subtype4 | 10 | 13 |
Figure S40. Get High-res Image Clustering Approach #5: 'RNAseq cHierClus subtypes' versus Clinical Feature #4: 'GENDER'
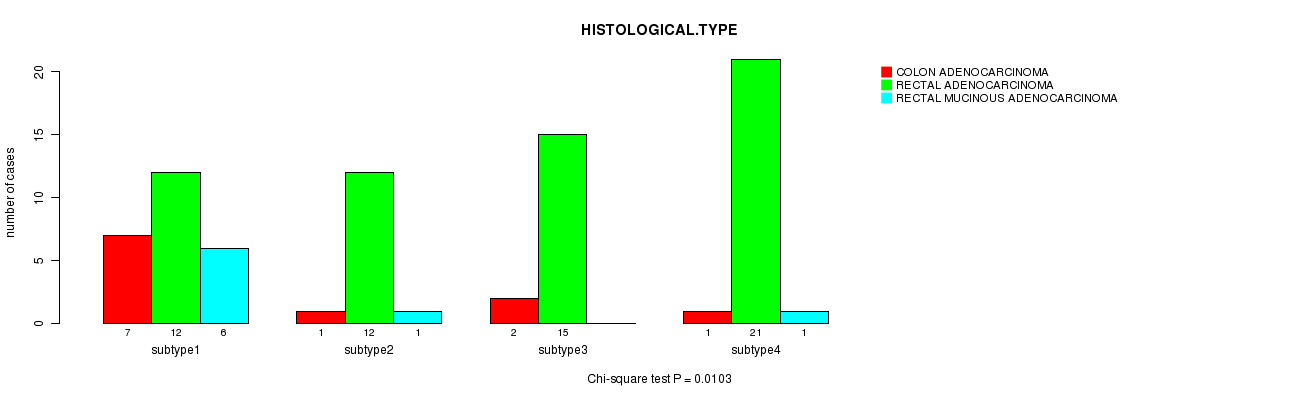
P value = 0.0103 (Chi-square test)
Table S46. Clustering Approach #5: 'RNAseq cHierClus subtypes' versus Clinical Feature #5: 'HISTOLOGICAL.TYPE'
| nPatients | COLON ADENOCARCINOMA | RECTAL ADENOCARCINOMA | RECTAL MUCINOUS ADENOCARCINOMA |
|---|---|---|---|
| ALL | 11 | 60 | 8 |
| subtype1 | 7 | 12 | 6 |
| subtype2 | 1 | 12 | 1 |
| subtype3 | 2 | 15 | 0 |
| subtype4 | 1 | 21 | 1 |
Figure S41. Get High-res Image Clustering Approach #5: 'RNAseq cHierClus subtypes' versus Clinical Feature #5: 'HISTOLOGICAL.TYPE'
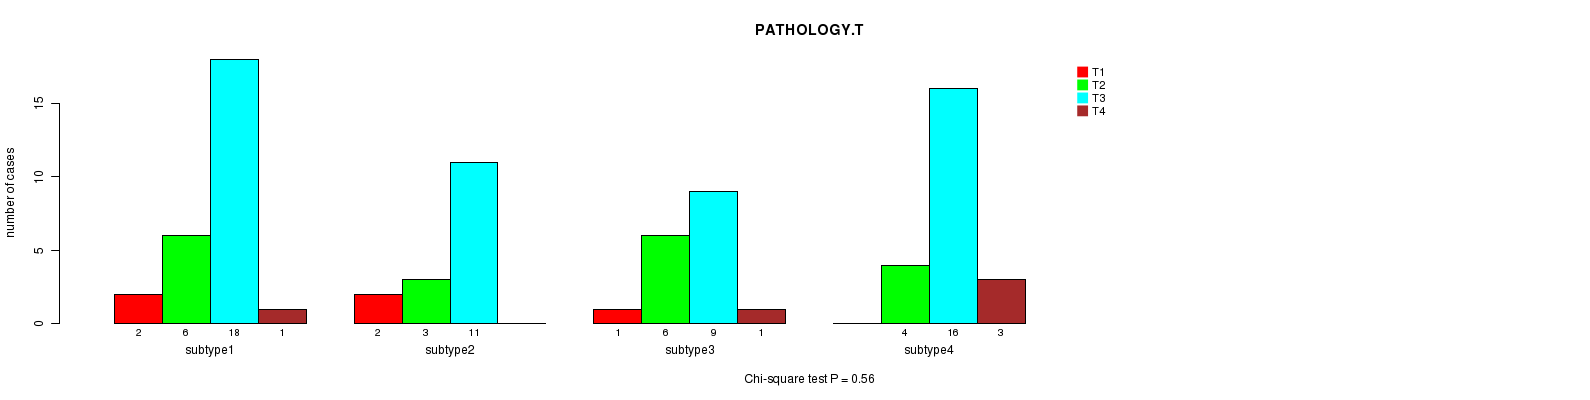
P value = 0.56 (Chi-square test)
Table S47. Clustering Approach #5: 'RNAseq cHierClus subtypes' versus Clinical Feature #6: 'PATHOLOGY.T'
| nPatients | T1 | T2 | T3 | T4 |
|---|---|---|---|---|
| ALL | 5 | 19 | 54 | 5 |
| subtype1 | 2 | 6 | 18 | 1 |
| subtype2 | 2 | 3 | 11 | 0 |
| subtype3 | 1 | 6 | 9 | 1 |
| subtype4 | 0 | 4 | 16 | 3 |
Figure S42. Get High-res Image Clustering Approach #5: 'RNAseq cHierClus subtypes' versus Clinical Feature #6: 'PATHOLOGY.T'
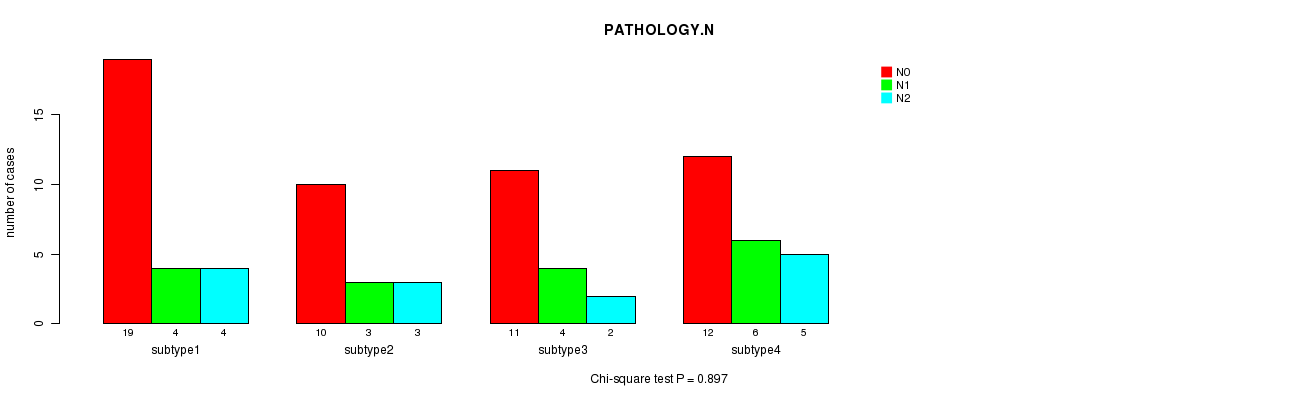
P value = 0.897 (Chi-square test)
Table S48. Clustering Approach #5: 'RNAseq cHierClus subtypes' versus Clinical Feature #7: 'PATHOLOGY.N'
| nPatients | N0 | N1 | N2 |
|---|---|---|---|
| ALL | 52 | 17 | 14 |
| subtype1 | 19 | 4 | 4 |
| subtype2 | 10 | 3 | 3 |
| subtype3 | 11 | 4 | 2 |
| subtype4 | 12 | 6 | 5 |
Figure S43. Get High-res Image Clustering Approach #5: 'RNAseq cHierClus subtypes' versus Clinical Feature #7: 'PATHOLOGY.N'
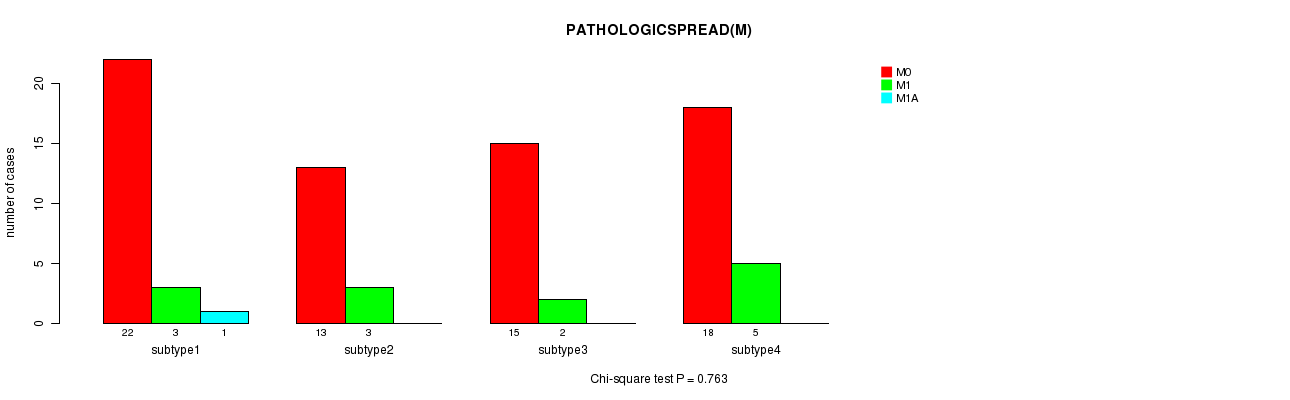
P value = 0.763 (Chi-square test)
Table S49. Clustering Approach #5: 'RNAseq cHierClus subtypes' versus Clinical Feature #8: 'PATHOLOGICSPREAD(M)'
| nPatients | M0 | M1 | M1A |
|---|---|---|---|
| ALL | 68 | 13 | 1 |
| subtype1 | 22 | 3 | 1 |
| subtype2 | 13 | 3 | 0 |
| subtype3 | 15 | 2 | 0 |
| subtype4 | 18 | 5 | 0 |
Figure S44. Get High-res Image Clustering Approach #5: 'RNAseq cHierClus subtypes' versus Clinical Feature #8: 'PATHOLOGICSPREAD(M)'
P value = 1 (Fisher's exact test)
Table S50. Clustering Approach #5: 'RNAseq cHierClus subtypes' versus Clinical Feature #9: 'NEOADJUVANT.THERAPY'
| nPatients | NO | YES |
|---|---|---|
| ALL | 82 | 1 |
| subtype1 | 26 | 1 |
| subtype2 | 16 | 0 |
| subtype3 | 17 | 0 |
| subtype4 | 23 | 0 |
Figure S45. Get High-res Image Clustering Approach #5: 'RNAseq cHierClus subtypes' versus Clinical Feature #9: 'NEOADJUVANT.THERAPY'
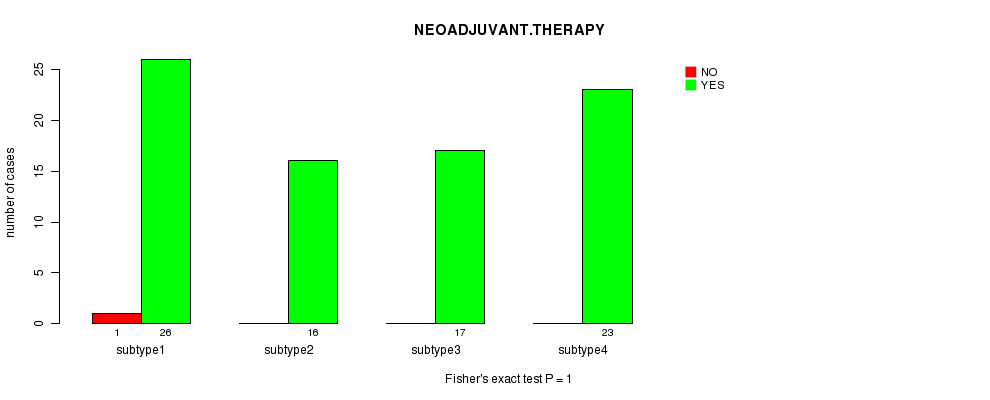
Table S51. Get Full Table Description of clustering approach #6: 'MIRseq CNMF subtypes'
| Cluster Labels | 1 | 2 | 3 | 4 |
|---|---|---|---|---|
| Number of samples | 46 | 69 | 63 | 76 |
P value = 0.301 (logrank test)
Table S52. Clustering Approach #6: 'MIRseq CNMF subtypes' versus Clinical Feature #1: 'Time to Death'
| nPatients | nDeath | Duration Range (Median), Month | |
|---|---|---|---|
| ALL | 140 | 20 | 0.9 - 72.1 (8.6) |
| subtype1 | 27 | 6 | 1.0 - 72.1 (12.7) |
| subtype2 | 37 | 6 | 0.9 - 61.9 (16.6) |
| subtype3 | 47 | 7 | 0.9 - 71.7 (11.0) |
| subtype4 | 29 | 1 | 0.9 - 20.9 (1.0) |
Figure S46. Get High-res Image Clustering Approach #6: 'MIRseq CNMF subtypes' versus Clinical Feature #1: 'Time to Death'
P value = 0.0018 (ANOVA)
Table S53. Clustering Approach #6: 'MIRseq CNMF subtypes' versus Clinical Feature #2: 'AGE'
| nPatients | Mean (Std.Dev) | |
|---|---|---|
| ALL | 254 | 68.7 (12.1) |
| subtype1 | 46 | 70.5 (11.0) |
| subtype2 | 69 | 72.0 (11.5) |
| subtype3 | 63 | 64.3 (11.7) |
| subtype4 | 76 | 68.4 (12.6) |
Figure S47. Get High-res Image Clustering Approach #6: 'MIRseq CNMF subtypes' versus Clinical Feature #2: 'AGE'
P value = 0.00435 (Fisher's exact test)
Table S54. Clustering Approach #6: 'MIRseq CNMF subtypes' versus Clinical Feature #3: 'PRIMARY.SITE.OF.DISEASE'
| nPatients | COLON | RECTUM |
|---|---|---|
| ALL | 185 | 67 |
| subtype1 | 36 | 10 |
| subtype2 | 59 | 10 |
| subtype3 | 36 | 26 |
| subtype4 | 54 | 21 |
Figure S48. Get High-res Image Clustering Approach #6: 'MIRseq CNMF subtypes' versus Clinical Feature #3: 'PRIMARY.SITE.OF.DISEASE'
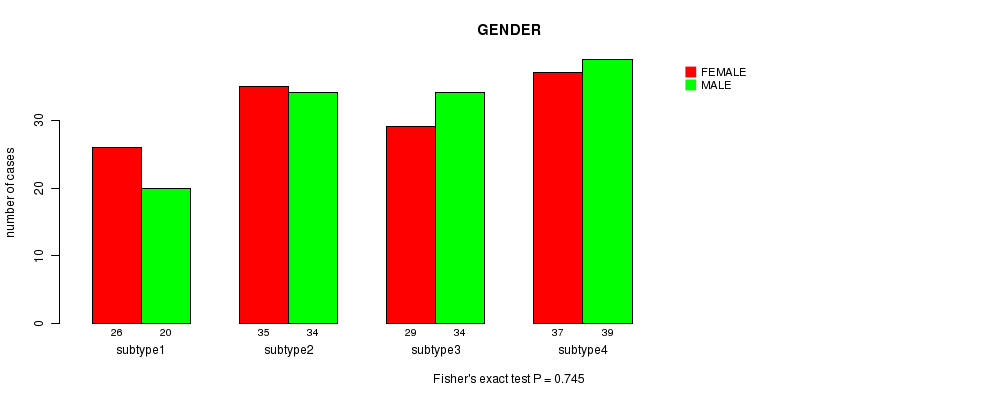
P value = 0.745 (Fisher's exact test)
Table S55. Clustering Approach #6: 'MIRseq CNMF subtypes' versus Clinical Feature #4: 'GENDER'
| nPatients | FEMALE | MALE |
|---|---|---|
| ALL | 127 | 127 |
| subtype1 | 20 | 26 |
| subtype2 | 34 | 35 |
| subtype3 | 34 | 29 |
| subtype4 | 39 | 37 |
Figure S49. Get High-res Image Clustering Approach #6: 'MIRseq CNMF subtypes' versus Clinical Feature #4: 'GENDER'
P value = 0.0222 (Chi-square test)
Table S56. Clustering Approach #6: 'MIRseq CNMF subtypes' versus Clinical Feature #5: 'HISTOLOGICAL.TYPE'
| nPatients | COLON ADENOCARCINOMA | COLON MUCINOUS ADENOCARCINOMA | RECTAL ADENOCARCINOMA | RECTAL MUCINOUS ADENOCARCINOMA |
|---|---|---|---|---|
| ALL | 157 | 26 | 56 | 8 |
| subtype1 | 31 | 5 | 8 | 1 |
| subtype2 | 46 | 12 | 7 | 3 |
| subtype3 | 34 | 2 | 22 | 3 |
| subtype4 | 46 | 7 | 19 | 1 |
Figure S50. Get High-res Image Clustering Approach #6: 'MIRseq CNMF subtypes' versus Clinical Feature #5: 'HISTOLOGICAL.TYPE'
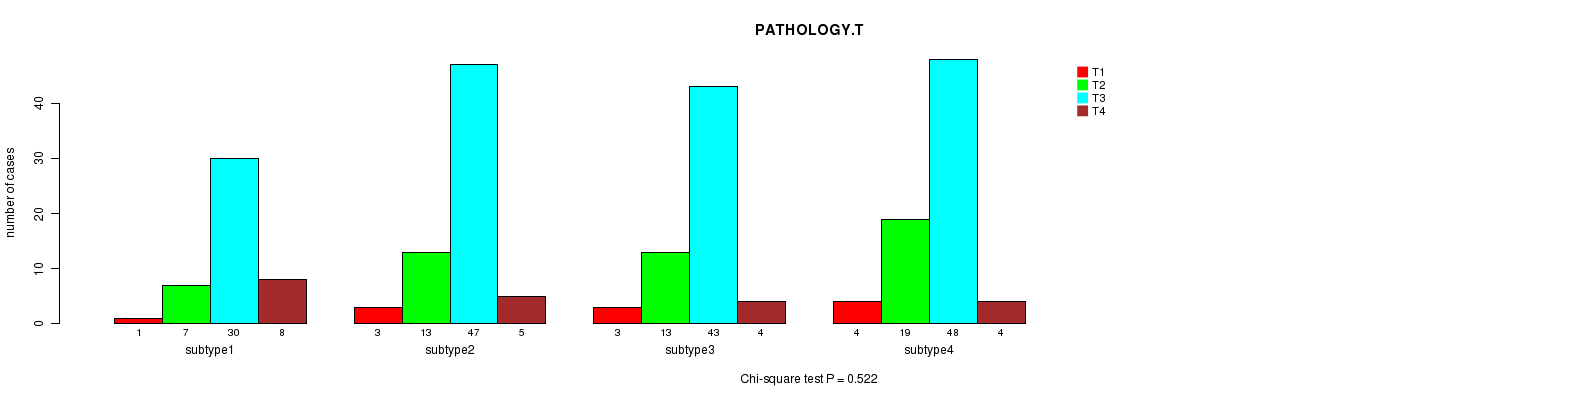
P value = 0.522 (Chi-square test)
Table S57. Clustering Approach #6: 'MIRseq CNMF subtypes' versus Clinical Feature #6: 'PATHOLOGY.T'
| nPatients | T1 | T2 | T3 | T4 |
|---|---|---|---|---|
| ALL | 11 | 52 | 168 | 21 |
| subtype1 | 1 | 7 | 30 | 8 |
| subtype2 | 3 | 13 | 47 | 5 |
| subtype3 | 3 | 13 | 43 | 4 |
| subtype4 | 4 | 19 | 48 | 4 |
Figure S51. Get High-res Image Clustering Approach #6: 'MIRseq CNMF subtypes' versus Clinical Feature #6: 'PATHOLOGY.T'
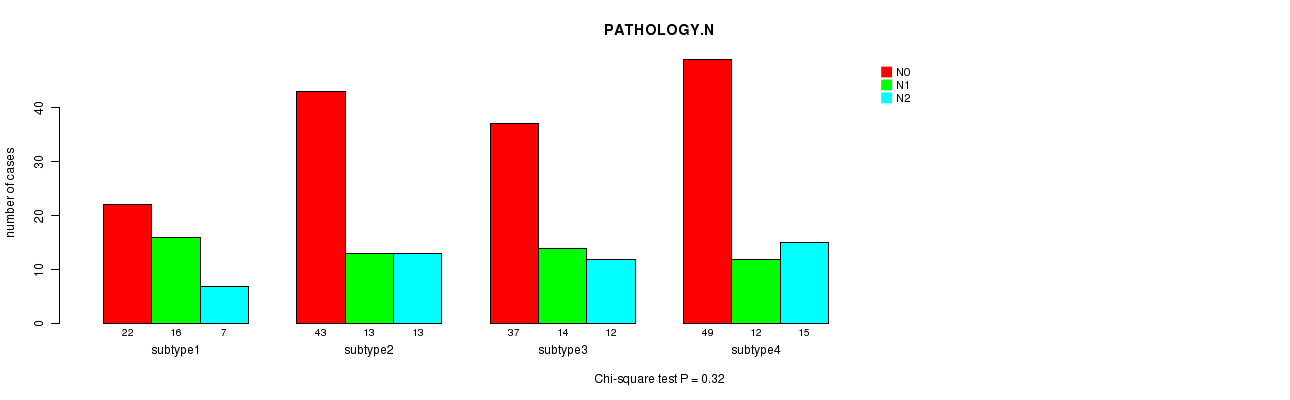
P value = 0.32 (Chi-square test)
Table S58. Clustering Approach #6: 'MIRseq CNMF subtypes' versus Clinical Feature #7: 'PATHOLOGY.N'
| nPatients | N0 | N1 | N2 |
|---|---|---|---|
| ALL | 151 | 55 | 47 |
| subtype1 | 22 | 16 | 7 |
| subtype2 | 43 | 13 | 13 |
| subtype3 | 37 | 14 | 12 |
| subtype4 | 49 | 12 | 15 |
Figure S52. Get High-res Image Clustering Approach #6: 'MIRseq CNMF subtypes' versus Clinical Feature #7: 'PATHOLOGY.N'
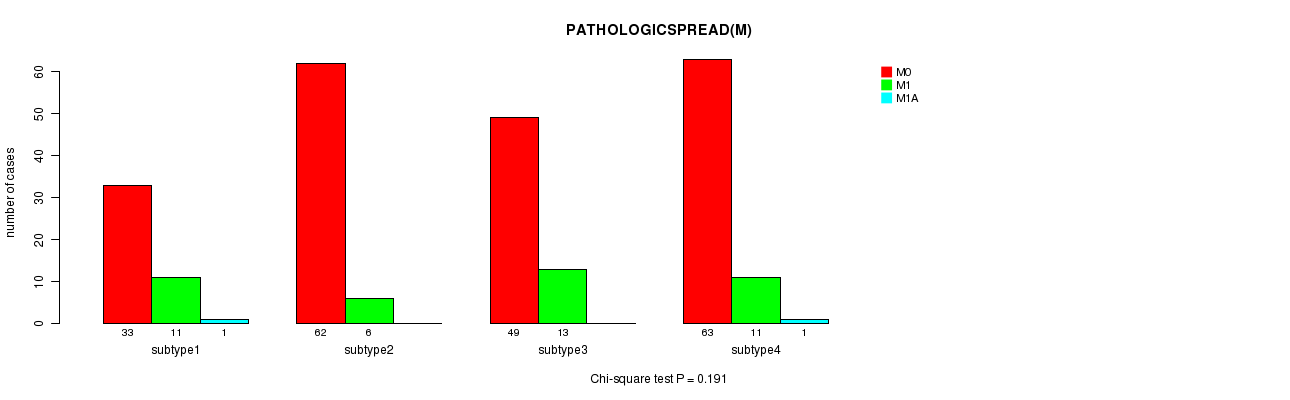
P value = 0.191 (Chi-square test)
Table S59. Clustering Approach #6: 'MIRseq CNMF subtypes' versus Clinical Feature #8: 'PATHOLOGICSPREAD(M)'
| nPatients | M0 | M1 | M1A |
|---|---|---|---|
| ALL | 207 | 41 | 2 |
| subtype1 | 33 | 11 | 1 |
| subtype2 | 62 | 6 | 0 |
| subtype3 | 49 | 13 | 0 |
| subtype4 | 63 | 11 | 1 |
Figure S53. Get High-res Image Clustering Approach #6: 'MIRseq CNMF subtypes' versus Clinical Feature #8: 'PATHOLOGICSPREAD(M)'
P value = 0.0361 (Fisher's exact test)
Table S60. Clustering Approach #6: 'MIRseq CNMF subtypes' versus Clinical Feature #9: 'NEOADJUVANT.THERAPY'
| nPatients | NO | YES |
|---|---|---|
| ALL | 240 | 14 |
| subtype1 | 40 | 6 |
| subtype2 | 64 | 5 |
| subtype3 | 61 | 2 |
| subtype4 | 75 | 1 |
Figure S54. Get High-res Image Clustering Approach #6: 'MIRseq CNMF subtypes' versus Clinical Feature #9: 'NEOADJUVANT.THERAPY'
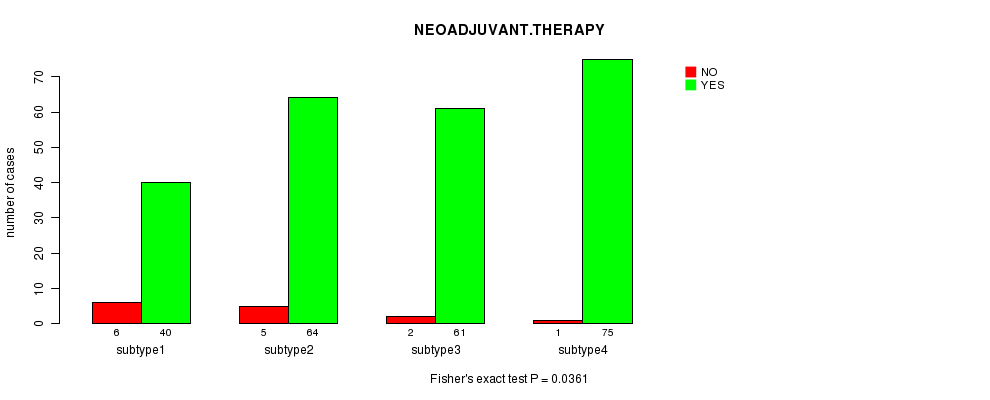
Table S61. Get Full Table Description of clustering approach #7: 'MIRseq cHierClus subtypes'
| Cluster Labels | 1 | 2 | 3 | 4 | 5 |
|---|---|---|---|---|---|
| Number of samples | 38 | 63 | 26 | 49 | 78 |
P value = 0.0217 (logrank test)
Table S62. Clustering Approach #7: 'MIRseq cHierClus subtypes' versus Clinical Feature #1: 'Time to Death'
| nPatients | nDeath | Duration Range (Median), Month | |
|---|---|---|---|
| ALL | 140 | 20 | 0.9 - 72.1 (8.6) |
| subtype1 | 19 | 1 | 0.9 - 72.1 (12.0) |
| subtype2 | 37 | 4 | 0.9 - 61.9 (14.7) |
| subtype3 | 12 | 1 | 1.0 - 64.0 (1.5) |
| subtype4 | 20 | 3 | 0.9 - 38.1 (1.0) |
| subtype5 | 52 | 11 | 0.9 - 71.7 (12.4) |
Figure S55. Get High-res Image Clustering Approach #7: 'MIRseq cHierClus subtypes' versus Clinical Feature #1: 'Time to Death'
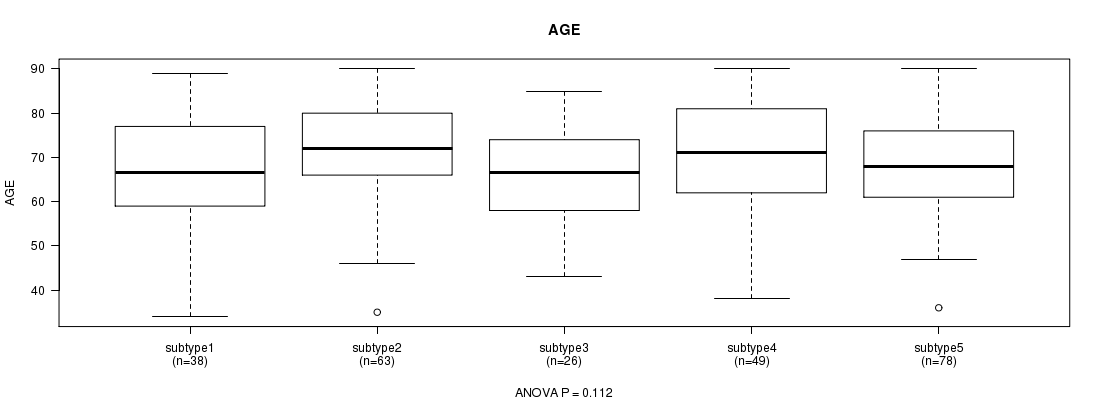
P value = 0.112 (ANOVA)
Table S63. Clustering Approach #7: 'MIRseq cHierClus subtypes' versus Clinical Feature #2: 'AGE'
| nPatients | Mean (Std.Dev) | |
|---|---|---|
| ALL | 254 | 68.7 (12.1) |
| subtype1 | 38 | 66.3 (13.5) |
| subtype2 | 63 | 71.1 (12.3) |
| subtype3 | 26 | 64.9 (10.9) |
| subtype4 | 49 | 70.3 (12.3) |
| subtype5 | 78 | 68.3 (11.2) |
Figure S56. Get High-res Image Clustering Approach #7: 'MIRseq cHierClus subtypes' versus Clinical Feature #2: 'AGE'
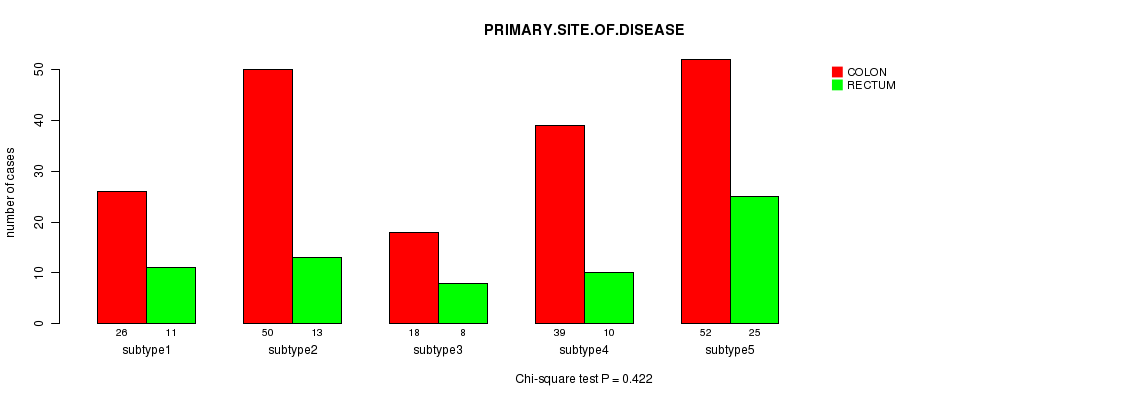
P value = 0.422 (Chi-square test)
Table S64. Clustering Approach #7: 'MIRseq cHierClus subtypes' versus Clinical Feature #3: 'PRIMARY.SITE.OF.DISEASE'
| nPatients | COLON | RECTUM |
|---|---|---|
| ALL | 185 | 67 |
| subtype1 | 26 | 11 |
| subtype2 | 50 | 13 |
| subtype3 | 18 | 8 |
| subtype4 | 39 | 10 |
| subtype5 | 52 | 25 |
Figure S57. Get High-res Image Clustering Approach #7: 'MIRseq cHierClus subtypes' versus Clinical Feature #3: 'PRIMARY.SITE.OF.DISEASE'
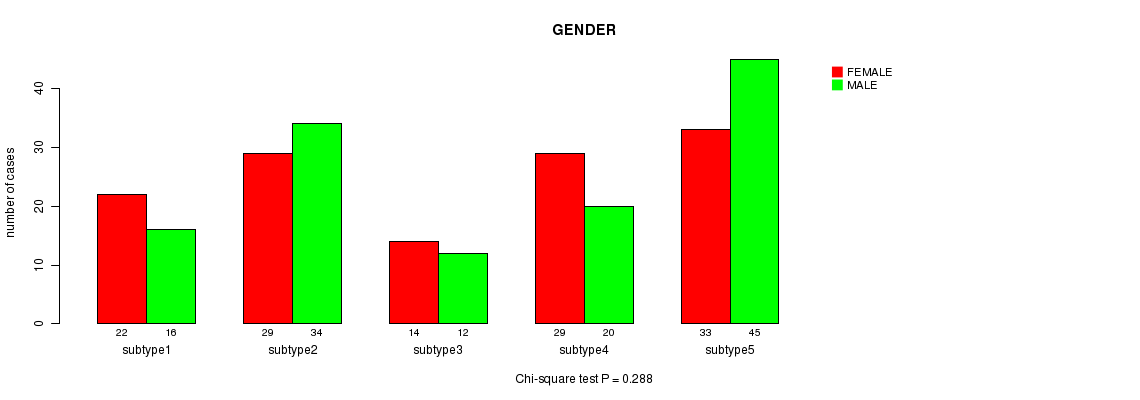
P value = 0.288 (Chi-square test)
Table S65. Clustering Approach #7: 'MIRseq cHierClus subtypes' versus Clinical Feature #4: 'GENDER'
| nPatients | FEMALE | MALE |
|---|---|---|
| ALL | 127 | 127 |
| subtype1 | 16 | 22 |
| subtype2 | 34 | 29 |
| subtype3 | 12 | 14 |
| subtype4 | 20 | 29 |
| subtype5 | 45 | 33 |
Figure S58. Get High-res Image Clustering Approach #7: 'MIRseq cHierClus subtypes' versus Clinical Feature #4: 'GENDER'
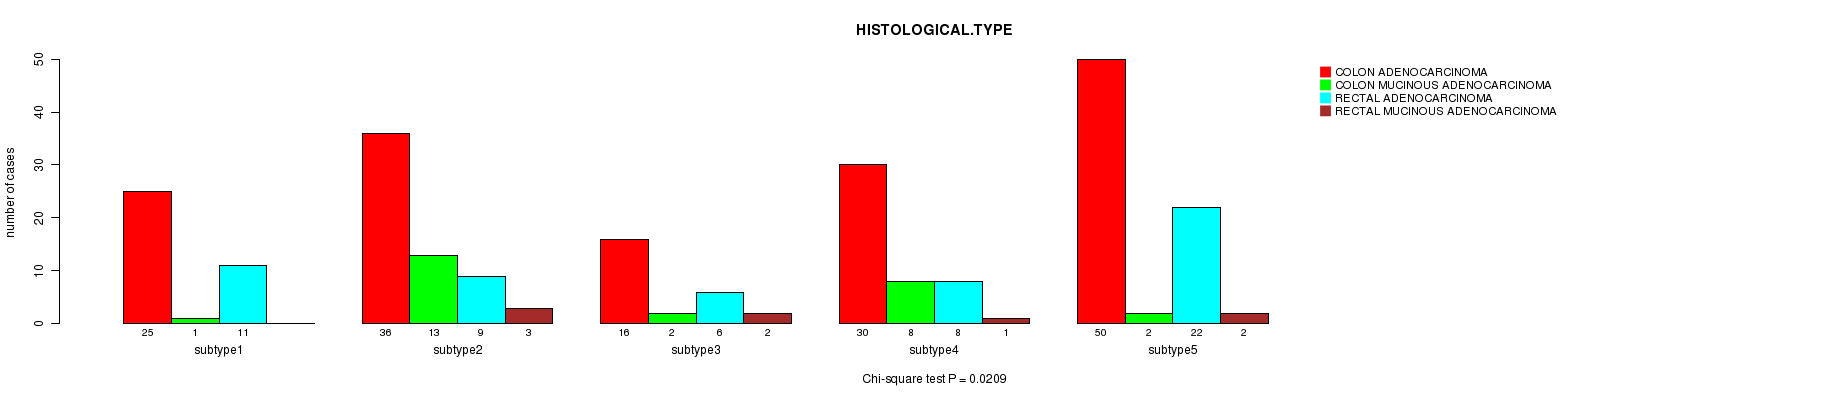
P value = 0.0209 (Chi-square test)
Table S66. Clustering Approach #7: 'MIRseq cHierClus subtypes' versus Clinical Feature #5: 'HISTOLOGICAL.TYPE'
| nPatients | COLON ADENOCARCINOMA | COLON MUCINOUS ADENOCARCINOMA | RECTAL ADENOCARCINOMA | RECTAL MUCINOUS ADENOCARCINOMA |
|---|---|---|---|---|
| ALL | 157 | 26 | 56 | 8 |
| subtype1 | 25 | 1 | 11 | 0 |
| subtype2 | 36 | 13 | 9 | 3 |
| subtype3 | 16 | 2 | 6 | 2 |
| subtype4 | 30 | 8 | 8 | 1 |
| subtype5 | 50 | 2 | 22 | 2 |
Figure S59. Get High-res Image Clustering Approach #7: 'MIRseq cHierClus subtypes' versus Clinical Feature #5: 'HISTOLOGICAL.TYPE'
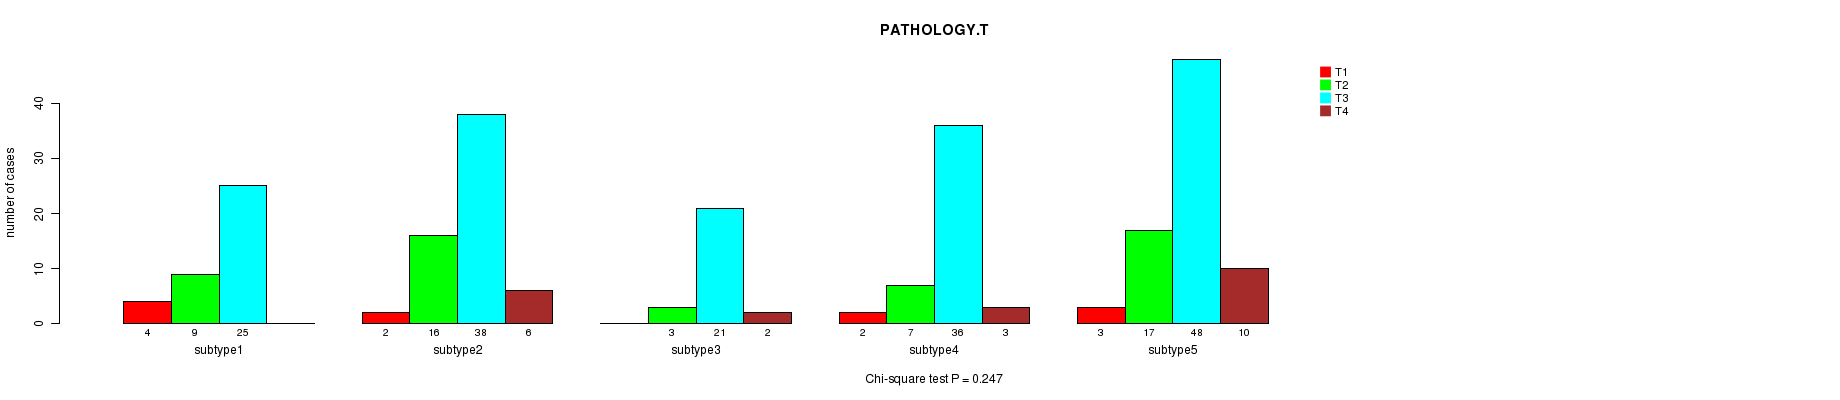
P value = 0.247 (Chi-square test)
Table S67. Clustering Approach #7: 'MIRseq cHierClus subtypes' versus Clinical Feature #6: 'PATHOLOGY.T'
| nPatients | T1 | T2 | T3 | T4 |
|---|---|---|---|---|
| ALL | 11 | 52 | 168 | 21 |
| subtype1 | 4 | 9 | 25 | 0 |
| subtype2 | 2 | 16 | 38 | 6 |
| subtype3 | 0 | 3 | 21 | 2 |
| subtype4 | 2 | 7 | 36 | 3 |
| subtype5 | 3 | 17 | 48 | 10 |
Figure S60. Get High-res Image Clustering Approach #7: 'MIRseq cHierClus subtypes' versus Clinical Feature #6: 'PATHOLOGY.T'
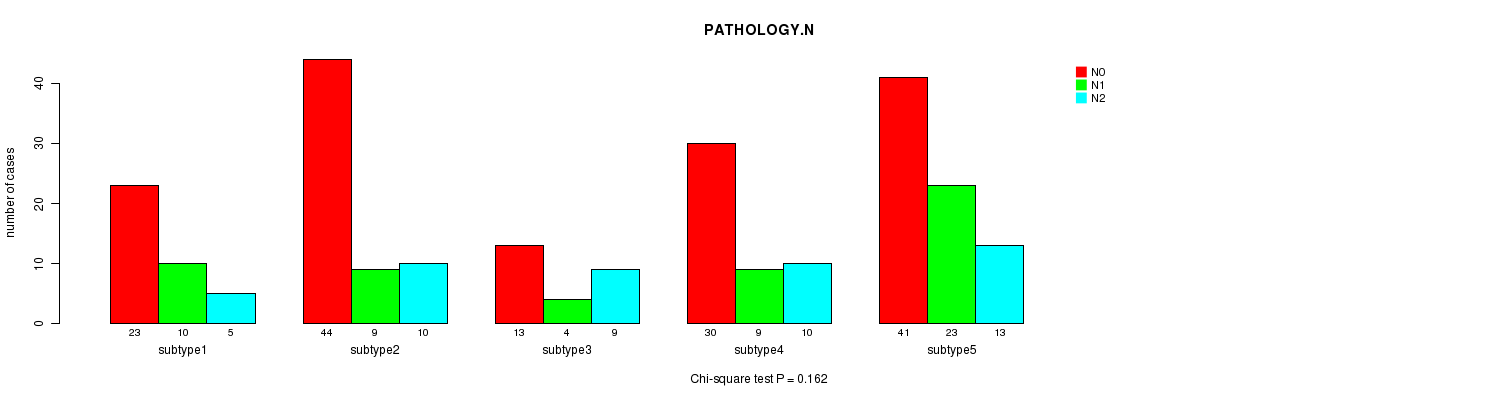
P value = 0.162 (Chi-square test)
Table S68. Clustering Approach #7: 'MIRseq cHierClus subtypes' versus Clinical Feature #7: 'PATHOLOGY.N'
| nPatients | N0 | N1 | N2 |
|---|---|---|---|
| ALL | 151 | 55 | 47 |
| subtype1 | 23 | 10 | 5 |
| subtype2 | 44 | 9 | 10 |
| subtype3 | 13 | 4 | 9 |
| subtype4 | 30 | 9 | 10 |
| subtype5 | 41 | 23 | 13 |
Figure S61. Get High-res Image Clustering Approach #7: 'MIRseq cHierClus subtypes' versus Clinical Feature #7: 'PATHOLOGY.N'
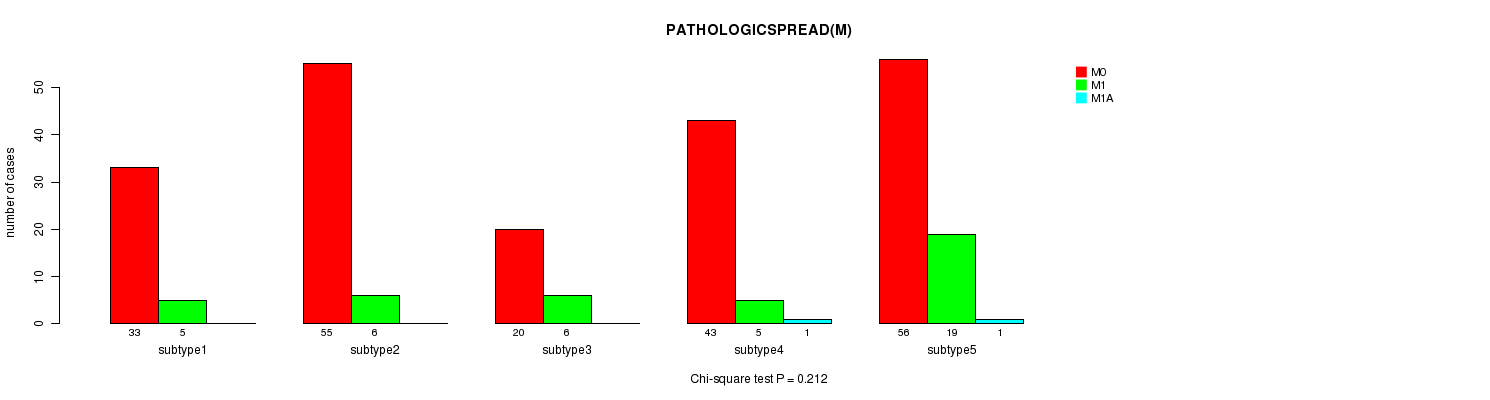
P value = 0.212 (Chi-square test)
Table S69. Clustering Approach #7: 'MIRseq cHierClus subtypes' versus Clinical Feature #8: 'PATHOLOGICSPREAD(M)'
| nPatients | M0 | M1 | M1A |
|---|---|---|---|
| ALL | 207 | 41 | 2 |
| subtype1 | 33 | 5 | 0 |
| subtype2 | 55 | 6 | 0 |
| subtype3 | 20 | 6 | 0 |
| subtype4 | 43 | 5 | 1 |
| subtype5 | 56 | 19 | 1 |
Figure S62. Get High-res Image Clustering Approach #7: 'MIRseq cHierClus subtypes' versus Clinical Feature #8: 'PATHOLOGICSPREAD(M)'
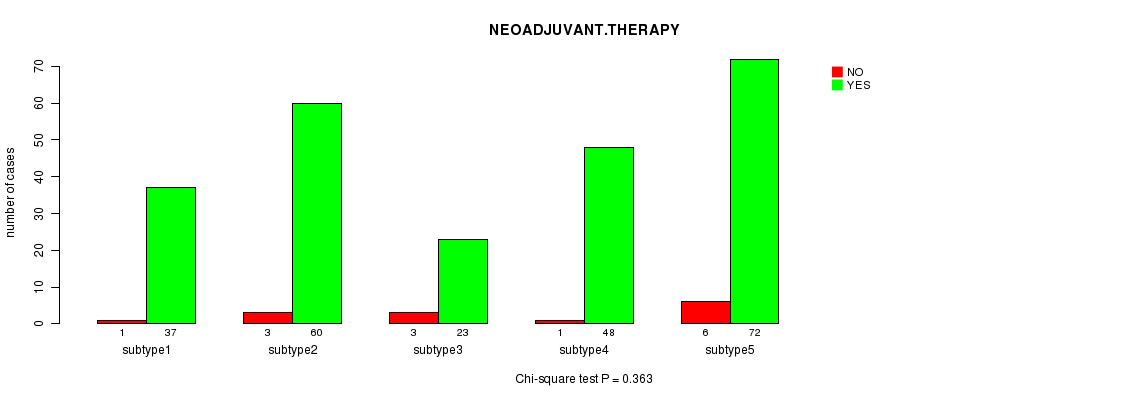
P value = 0.363 (Chi-square test)
Table S70. Clustering Approach #7: 'MIRseq cHierClus subtypes' versus Clinical Feature #9: 'NEOADJUVANT.THERAPY'
| nPatients | NO | YES |
|---|---|---|
| ALL | 240 | 14 |
| subtype1 | 37 | 1 |
| subtype2 | 60 | 3 |
| subtype3 | 23 | 3 |
| subtype4 | 48 | 1 |
| subtype5 | 72 | 6 |
Figure S63. Get High-res Image Clustering Approach #7: 'MIRseq cHierClus subtypes' versus Clinical Feature #9: 'NEOADJUVANT.THERAPY'
-
Cluster data file = COADREAD.mergedcluster.txt
-
Clinical data file = COADREAD.clin.merged.picked.txt
-
Number of patients = 275
-
Number of clustering approaches = 7
-
Number of selected clinical features = 9
-
Exclude small clusters that include fewer than K patients, K = 3
consensus non-negative matrix factorization clustering approach (Brunet et al. 2004)
Resampling-based clustering method (Monti et al. 2003)
For survival clinical features, the Kaplan-Meier survival curves of tumors with and without gene mutations were plotted and the statistical significance P values were estimated by logrank test (Bland and Altman 2004) using the 'survdiff' function in R
For continuous numerical clinical features, one-way analysis of variance (Howell 2002) was applied to compare the clinical values between tumor subtypes using 'anova' function in R
For binary clinical features, two-tailed Fisher's exact tests (Fisher 1922) were used to estimate the P values using the 'fisher.test' function in R
For multi-class clinical features (nominal or ordinal), Chi-square tests (Greenwood and Nikulin 1996) were used to estimate the P values using the 'chisq.test' function in R
This is an experimental feature. Location of data archives could not be determined.