This pipeline computes the correlation between cancer subtypes identified by different molecular patterns and selected clinical features.
Testing the association between subtypes identified by 5 different clustering approaches and 8 clinical features across 124 patients, 4 significant findings detected with P value < 0.05.
-
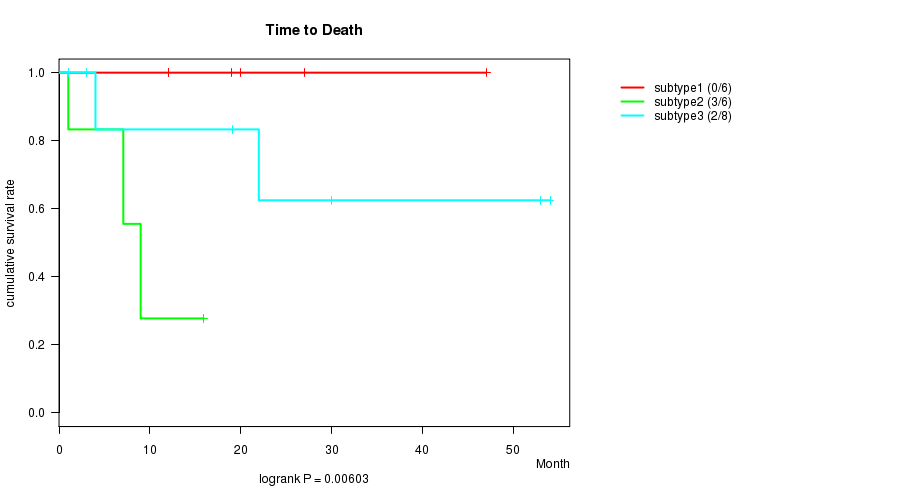
3 subtypes identified in current cancer cohort by 'METHLYATION CNMF'. These subtypes correlate to 'Time to Death' and 'AGE'.
-
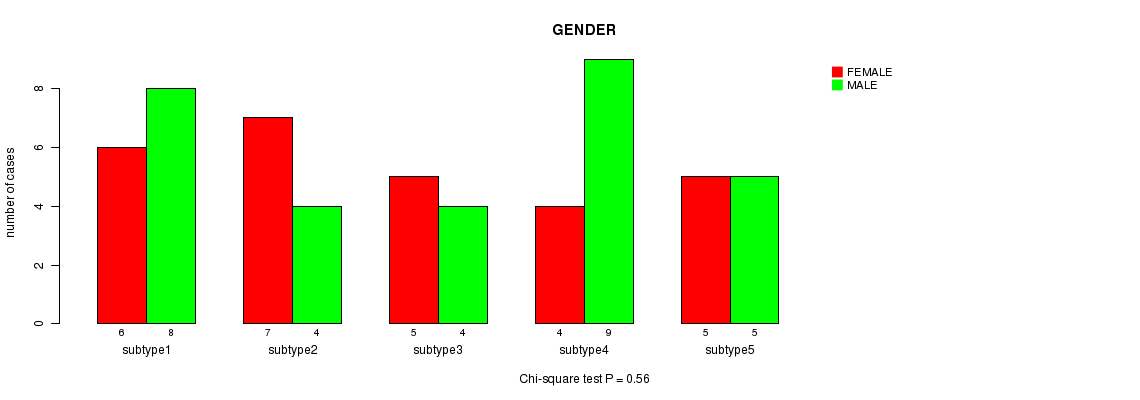
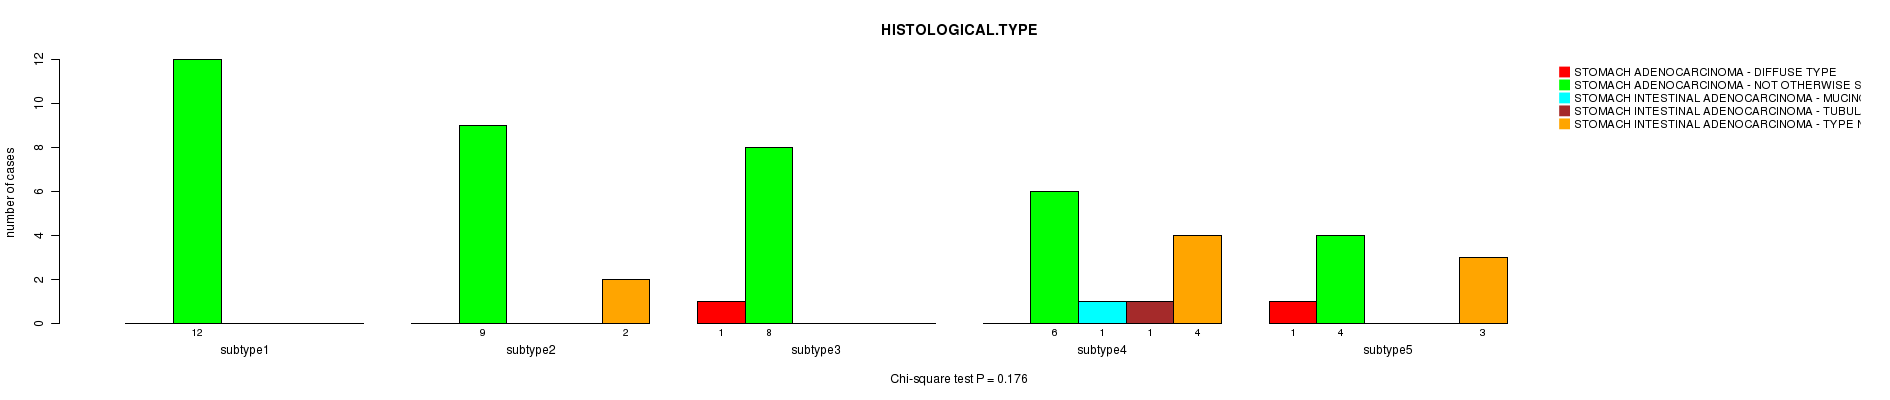
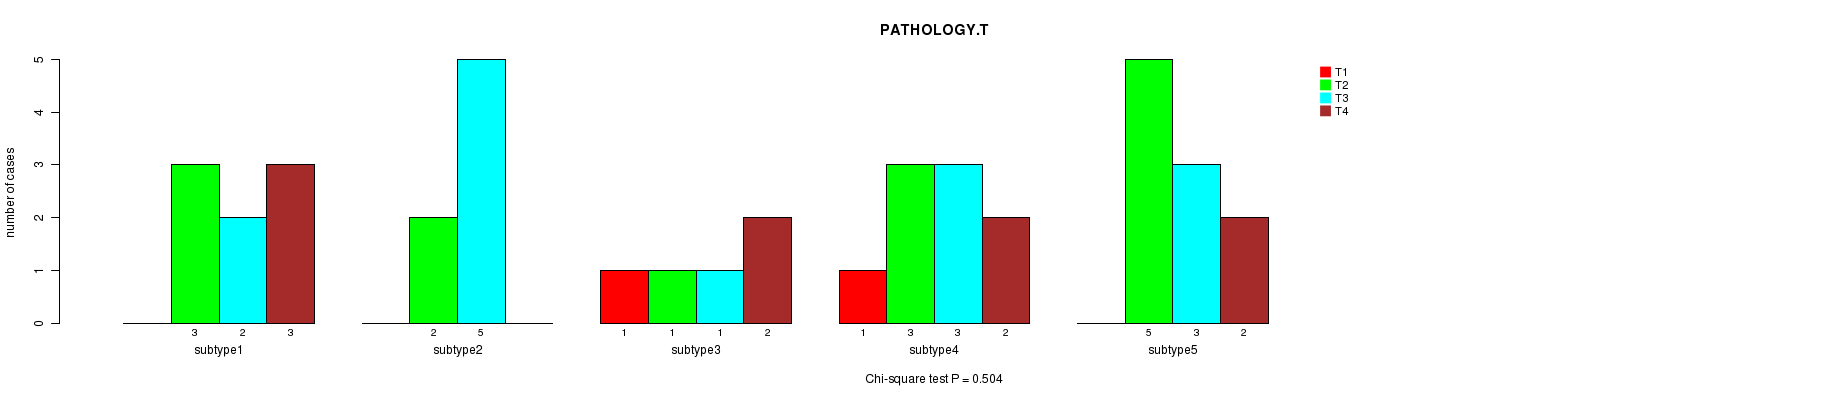
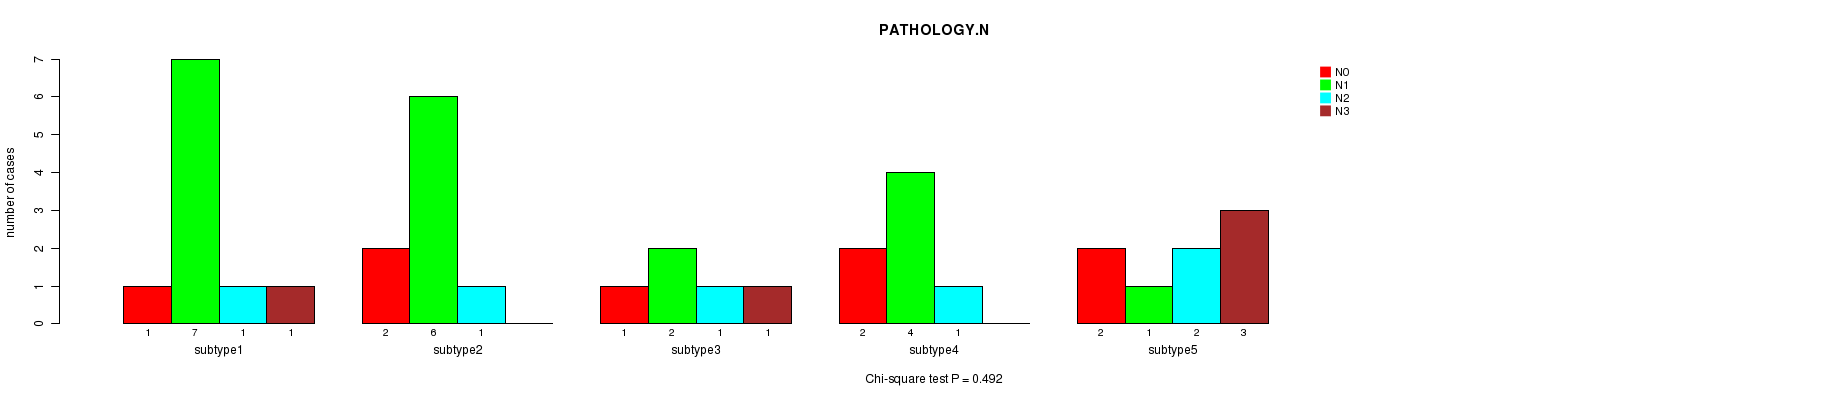
CNMF clustering analysis on sequencing-based mRNA expression data identified 5 subtypes that do not correlate to any clinical features.
-
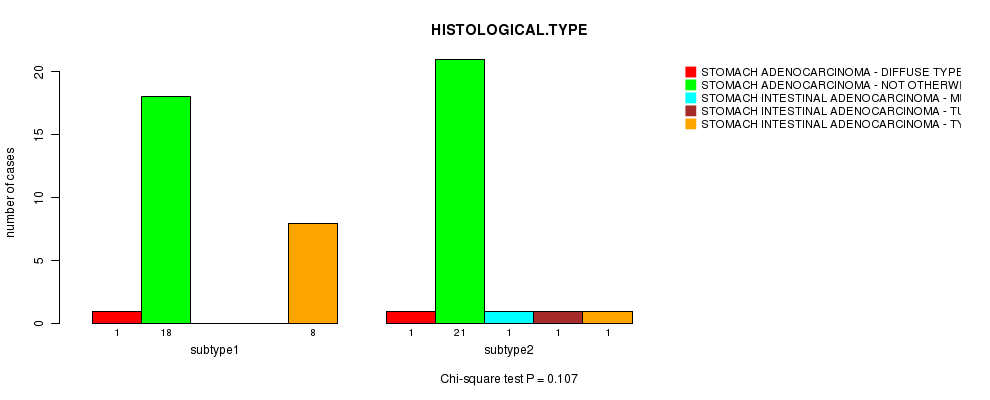
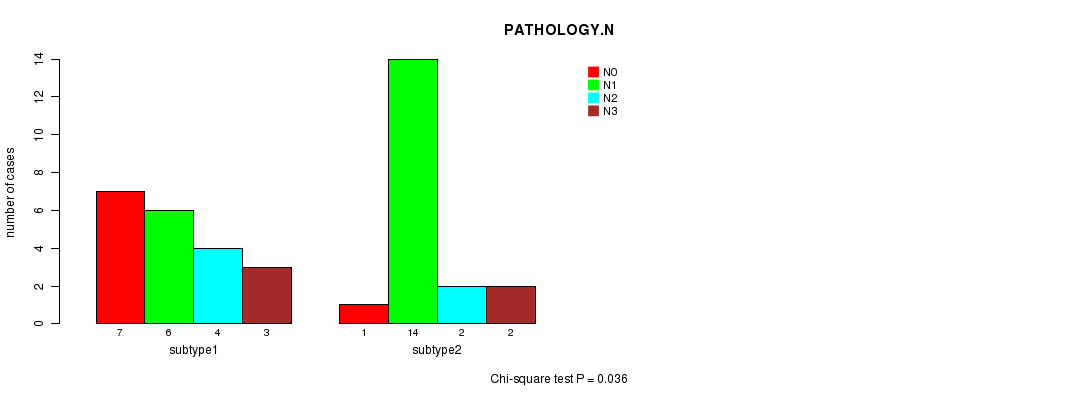
Consensus hierarchical clustering analysis on sequencing-based mRNA expression data identified 2 subtypes that correlate to 'PATHOLOGY.N'.
-
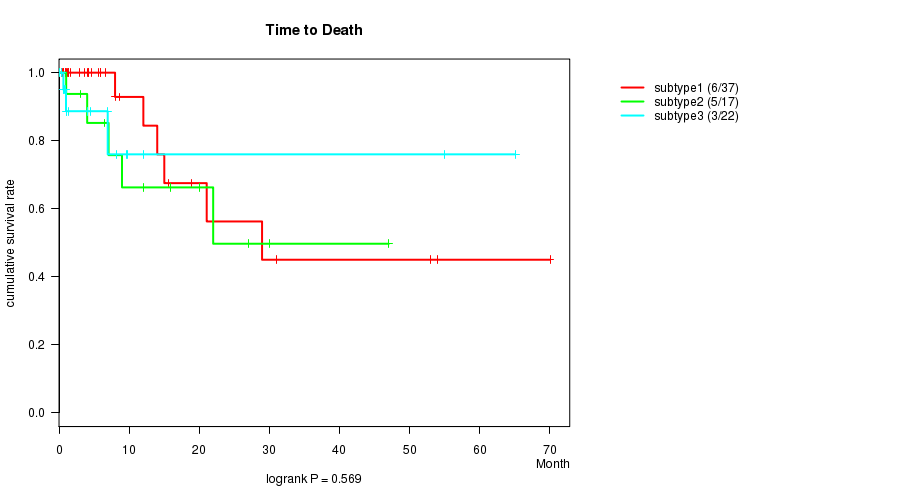
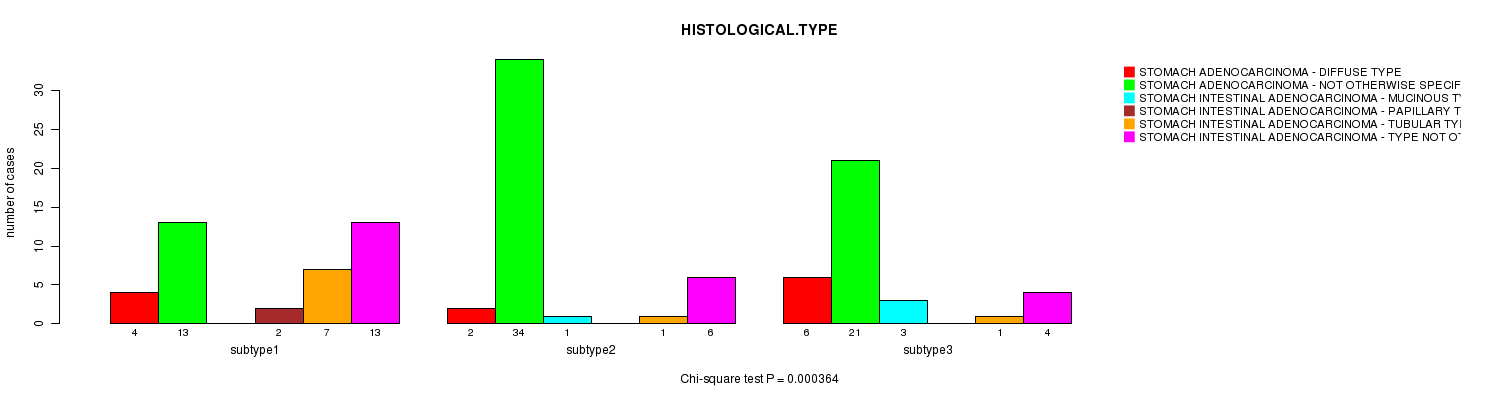
CNMF clustering analysis on sequencing-based miR expression data identified 3 subtypes that correlate to 'HISTOLOGICAL.TYPE'.
-
Consensus hierarchical clustering analysis on sequencing-based miR expression data identified 3 subtypes that do not correlate to any clinical features.
Table 1. Get Full Table Overview of the association between subtypes identified by 5 different clustering approaches and 8 clinical features. Shown in the table are P values from statistical tests. Thresholded by P value < 0.05, 4 significant findings detected.
|
Clinical Features |
Statistical Tests |
METHLYATION CNMF |
RNAseq CNMF subtypes |
RNAseq cHierClus subtypes |
MIRseq CNMF subtypes |
MIRseq cHierClus subtypes |
| Time to Death | logrank test | 0.00603 | 0.183 | 0.667 | 0.569 | 0.353 |
| AGE | ANOVA | 0.02 | 0.962 | 0.791 | 0.135 | 0.709 |
| GENDER | Fisher's exact test | 0.417 | 0.56 | 0.292 | 0.375 | 0.333 |
| HISTOLOGICAL TYPE | Chi-square test | 0.133 | 0.176 | 0.107 | 0.000364 | 0.0547 |
| PATHOLOGY T | Chi-square test | 0.44 | 0.504 | 0.557 | 0.307 | 0.884 |
| PATHOLOGY N | Chi-square test | 0.262 | 0.492 | 0.036 | 0.559 | 0.699 |
| PATHOLOGICSPREAD(M) | Chi-square test | 0.17 | 0.395 | 0.901 | 0.0546 | 0.458 |
| NEOADJUVANT THERAPY | Fisher's exact test | 0.0622 | 0.693 |
Table S1. Get Full Table Description of clustering approach #1: 'METHLYATION CNMF'
| Cluster Labels | 1 | 2 | 3 |
|---|---|---|---|
| Number of samples | 20 | 25 | 19 |
P value = 0.00603 (logrank test)
Table S2. Clustering Approach #1: 'METHLYATION CNMF' versus Clinical Feature #1: 'Time to Death'
| nPatients | nDeath | Duration Range (Median), Month | |
|---|---|---|---|
| ALL | 20 | 5 | 1.0 - 54.0 (14.0) |
| subtype1 | 6 | 0 | 12.0 - 47.0 (19.5) |
| subtype2 | 6 | 3 | 1.0 - 15.9 (4.0) |
| subtype3 | 8 | 2 | 1.0 - 54.0 (20.5) |
Figure S1. Get High-res Image Clustering Approach #1: 'METHLYATION CNMF' versus Clinical Feature #1: 'Time to Death'
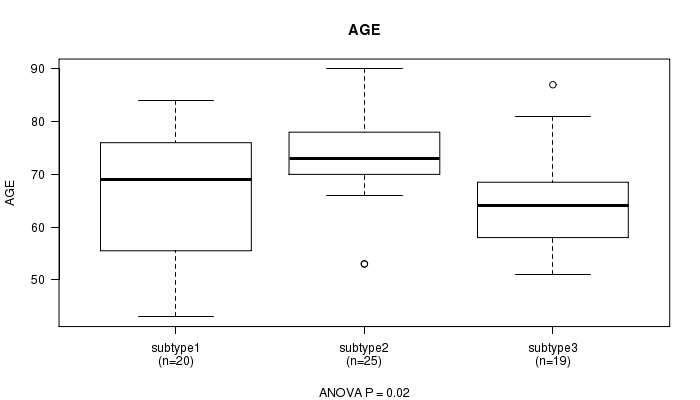
P value = 0.02 (ANOVA)
Table S3. Clustering Approach #1: 'METHLYATION CNMF' versus Clinical Feature #2: 'AGE'
| nPatients | Mean (Std.Dev) | |
|---|---|---|
| ALL | 64 | 68.9 (10.2) |
| subtype1 | 20 | 67.1 (11.6) |
| subtype2 | 25 | 73.2 (8.3) |
| subtype3 | 19 | 65.2 (9.3) |
Figure S2. Get High-res Image Clustering Approach #1: 'METHLYATION CNMF' versus Clinical Feature #2: 'AGE'
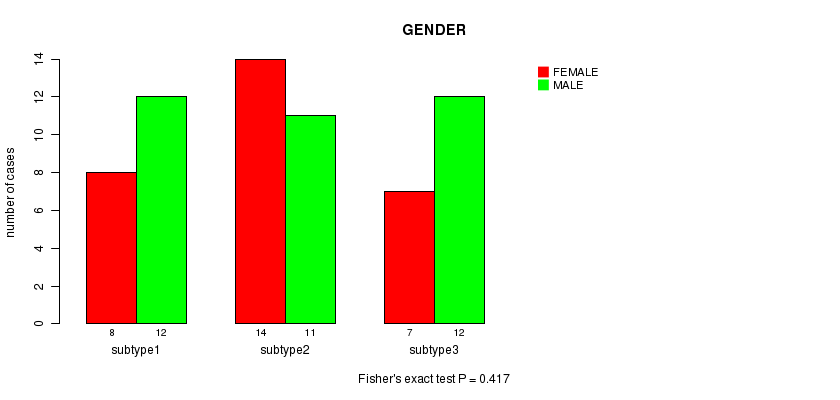
P value = 0.417 (Fisher's exact test)
Table S4. Clustering Approach #1: 'METHLYATION CNMF' versus Clinical Feature #3: 'GENDER'
| nPatients | FEMALE | MALE |
|---|---|---|
| ALL | 29 | 35 |
| subtype1 | 8 | 12 |
| subtype2 | 14 | 11 |
| subtype3 | 7 | 12 |
Figure S3. Get High-res Image Clustering Approach #1: 'METHLYATION CNMF' versus Clinical Feature #3: 'GENDER'
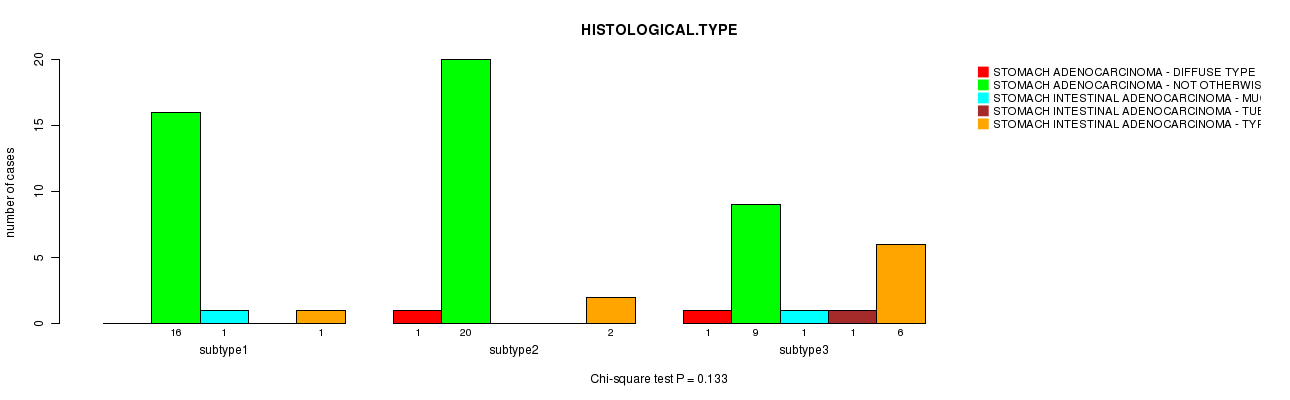
P value = 0.133 (Chi-square test)
Table S5. Clustering Approach #1: 'METHLYATION CNMF' versus Clinical Feature #4: 'HISTOLOGICAL.TYPE'
| nPatients | STOMACH ADENOCARCINOMA - DIFFUSE TYPE | STOMACH ADENOCARCINOMA - NOT OTHERWISE SPECIFIED (NOS) | STOMACH INTESTINAL ADENOCARCINOMA - MUCINOUS TYPE | STOMACH INTESTINAL ADENOCARCINOMA - TUBULAR TYPE | STOMACH INTESTINAL ADENOCARCINOMA - TYPE NOT OTHERWISE SPECIFIED (NOS) |
|---|---|---|---|---|---|
| ALL | 2 | 45 | 2 | 1 | 9 |
| subtype1 | 0 | 16 | 1 | 0 | 1 |
| subtype2 | 1 | 20 | 0 | 0 | 2 |
| subtype3 | 1 | 9 | 1 | 1 | 6 |
Figure S4. Get High-res Image Clustering Approach #1: 'METHLYATION CNMF' versus Clinical Feature #4: 'HISTOLOGICAL.TYPE'
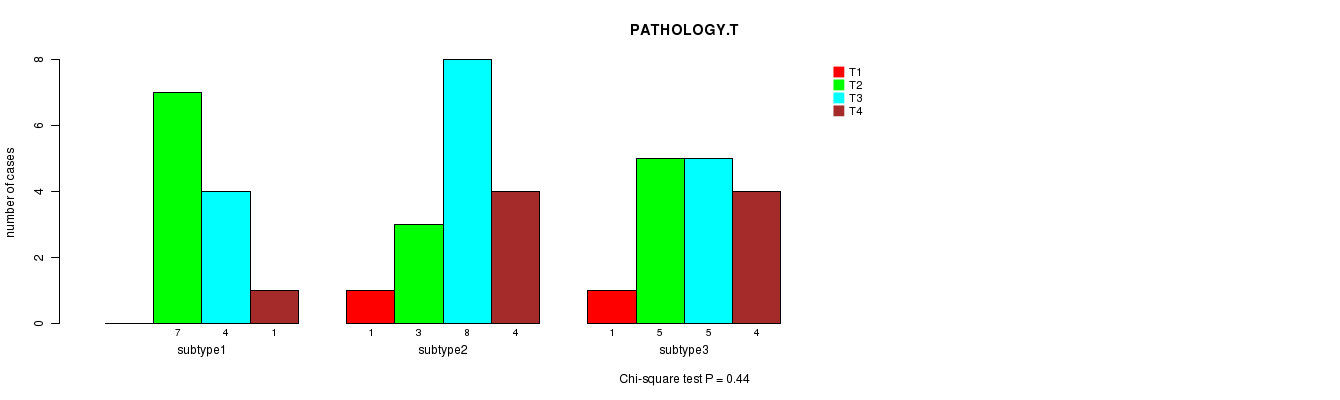
P value = 0.44 (Chi-square test)
Table S6. Clustering Approach #1: 'METHLYATION CNMF' versus Clinical Feature #5: 'PATHOLOGY.T'
| nPatients | T1 | T2 | T3 | T4 |
|---|---|---|---|---|
| ALL | 2 | 15 | 17 | 9 |
| subtype1 | 0 | 7 | 4 | 1 |
| subtype2 | 1 | 3 | 8 | 4 |
| subtype3 | 1 | 5 | 5 | 4 |
Figure S5. Get High-res Image Clustering Approach #1: 'METHLYATION CNMF' versus Clinical Feature #5: 'PATHOLOGY.T'
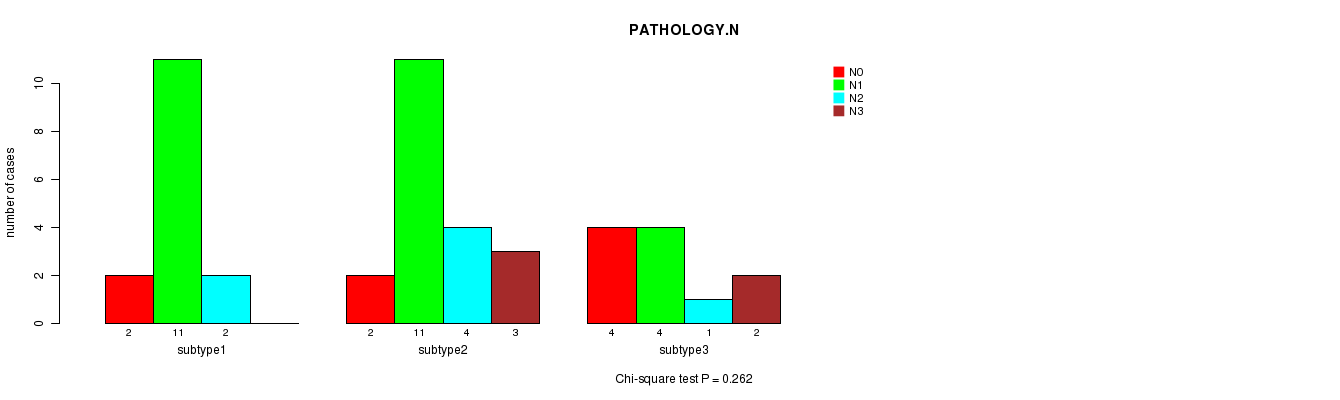
P value = 0.262 (Chi-square test)
Table S7. Clustering Approach #1: 'METHLYATION CNMF' versus Clinical Feature #6: 'PATHOLOGY.N'
| nPatients | N0 | N1 | N2 | N3 |
|---|---|---|---|---|
| ALL | 8 | 26 | 7 | 5 |
| subtype1 | 2 | 11 | 2 | 0 |
| subtype2 | 2 | 11 | 4 | 3 |
| subtype3 | 4 | 4 | 1 | 2 |
Figure S6. Get High-res Image Clustering Approach #1: 'METHLYATION CNMF' versus Clinical Feature #6: 'PATHOLOGY.N'
P value = 0.17 (Chi-square test)
Table S8. Clustering Approach #1: 'METHLYATION CNMF' versus Clinical Feature #7: 'PATHOLOGICSPREAD(M)'
| nPatients | M0 | M1 | MX |
|---|---|---|---|
| ALL | 54 | 7 | 3 |
| subtype1 | 20 | 0 | 0 |
| subtype2 | 20 | 4 | 1 |
| subtype3 | 14 | 3 | 2 |
Figure S7. Get High-res Image Clustering Approach #1: 'METHLYATION CNMF' versus Clinical Feature #7: 'PATHOLOGICSPREAD(M)'

Table S9. Get Full Table Description of clustering approach #2: 'RNAseq CNMF subtypes'
| Cluster Labels | 1 | 2 | 3 | 4 | 5 |
|---|---|---|---|---|---|
| Number of samples | 14 | 11 | 9 | 13 | 10 |
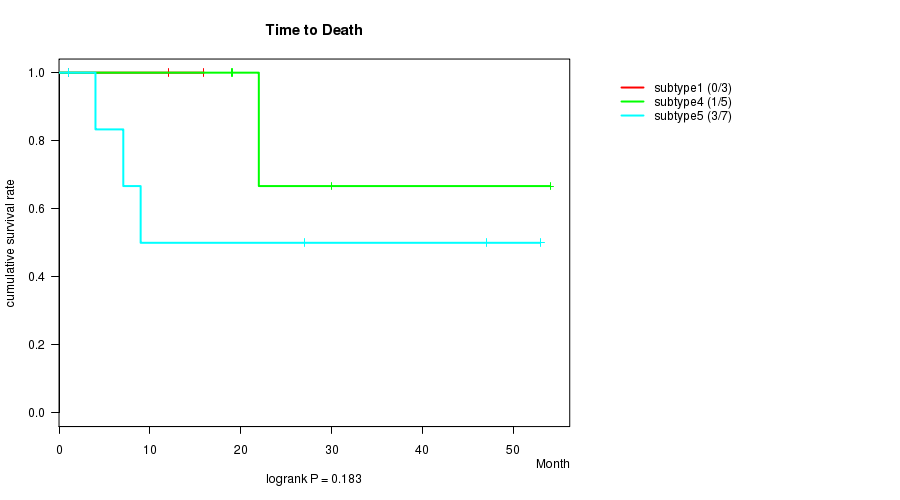
P value = 0.183 (logrank test)
Table S10. Clustering Approach #2: 'RNAseq CNMF subtypes' versus Clinical Feature #1: 'Time to Death'
| nPatients | nDeath | Duration Range (Median), Month | |
|---|---|---|---|
| ALL | 18 | 5 | 1.0 - 54.0 (14.0) |
| subtype1 | 3 | 0 | 1.0 - 15.9 (12.0) |
| subtype2 | 1 | 0 | 1.0 - 1.0 (1.0) |
| subtype3 | 2 | 1 | 1.0 - 3.0 (2.0) |
| subtype4 | 5 | 1 | 18.9 - 54.0 (22.0) |
| subtype5 | 7 | 3 | 1.0 - 53.0 (9.0) |
Figure S8. Get High-res Image Clustering Approach #2: 'RNAseq CNMF subtypes' versus Clinical Feature #1: 'Time to Death'
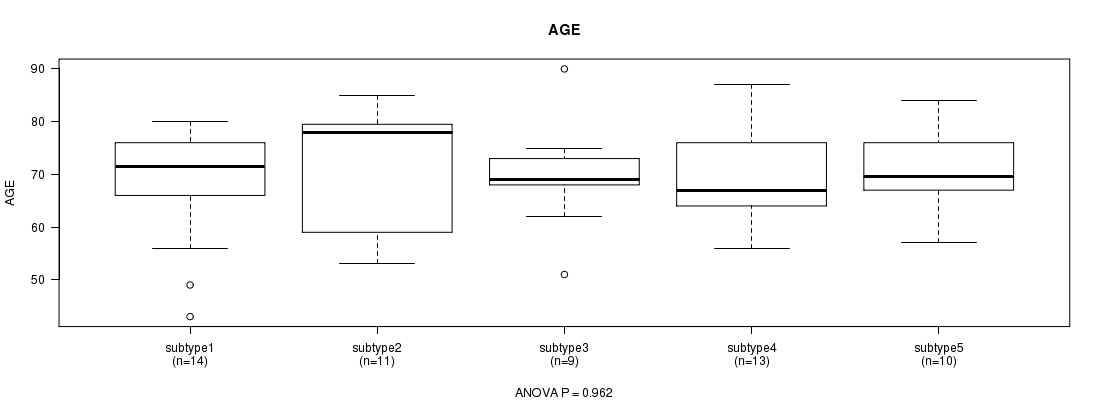
P value = 0.962 (ANOVA)
Table S11. Clustering Approach #2: 'RNAseq CNMF subtypes' versus Clinical Feature #2: 'AGE'
| nPatients | Mean (Std.Dev) | |
|---|---|---|
| ALL | 57 | 69.5 (10.1) |
| subtype1 | 14 | 67.9 (11.2) |
| subtype2 | 11 | 70.9 (11.8) |
| subtype3 | 9 | 69.9 (10.4) |
| subtype4 | 13 | 69.2 (10.0) |
| subtype5 | 10 | 70.1 (7.9) |
Figure S9. Get High-res Image Clustering Approach #2: 'RNAseq CNMF subtypes' versus Clinical Feature #2: 'AGE'
P value = 0.56 (Chi-square test)
Table S12. Clustering Approach #2: 'RNAseq CNMF subtypes' versus Clinical Feature #3: 'GENDER'
| nPatients | FEMALE | MALE |
|---|---|---|
| ALL | 30 | 27 |
| subtype1 | 8 | 6 |
| subtype2 | 4 | 7 |
| subtype3 | 4 | 5 |
| subtype4 | 9 | 4 |
| subtype5 | 5 | 5 |
Figure S10. Get High-res Image Clustering Approach #2: 'RNAseq CNMF subtypes' versus Clinical Feature #3: 'GENDER'
P value = 0.176 (Chi-square test)
Table S13. Clustering Approach #2: 'RNAseq CNMF subtypes' versus Clinical Feature #4: 'HISTOLOGICAL.TYPE'
| nPatients | STOMACH ADENOCARCINOMA - DIFFUSE TYPE | STOMACH ADENOCARCINOMA - NOT OTHERWISE SPECIFIED (NOS) | STOMACH INTESTINAL ADENOCARCINOMA - MUCINOUS TYPE | STOMACH INTESTINAL ADENOCARCINOMA - TUBULAR TYPE | STOMACH INTESTINAL ADENOCARCINOMA - TYPE NOT OTHERWISE SPECIFIED (NOS) |
|---|---|---|---|---|---|
| ALL | 2 | 39 | 1 | 1 | 9 |
| subtype1 | 0 | 12 | 0 | 0 | 0 |
| subtype2 | 0 | 9 | 0 | 0 | 2 |
| subtype3 | 1 | 8 | 0 | 0 | 0 |
| subtype4 | 0 | 6 | 1 | 1 | 4 |
| subtype5 | 1 | 4 | 0 | 0 | 3 |
Figure S11. Get High-res Image Clustering Approach #2: 'RNAseq CNMF subtypes' versus Clinical Feature #4: 'HISTOLOGICAL.TYPE'
P value = 0.504 (Chi-square test)
Table S14. Clustering Approach #2: 'RNAseq CNMF subtypes' versus Clinical Feature #5: 'PATHOLOGY.T'
| nPatients | T1 | T2 | T3 | T4 |
|---|---|---|---|---|
| ALL | 2 | 14 | 14 | 9 |
| subtype1 | 0 | 3 | 2 | 3 |
| subtype2 | 0 | 2 | 5 | 0 |
| subtype3 | 1 | 1 | 1 | 2 |
| subtype4 | 1 | 3 | 3 | 2 |
| subtype5 | 0 | 5 | 3 | 2 |
Figure S12. Get High-res Image Clustering Approach #2: 'RNAseq CNMF subtypes' versus Clinical Feature #5: 'PATHOLOGY.T'
P value = 0.492 (Chi-square test)
Table S15. Clustering Approach #2: 'RNAseq CNMF subtypes' versus Clinical Feature #6: 'PATHOLOGY.N'
| nPatients | N0 | N1 | N2 | N3 |
|---|---|---|---|---|
| ALL | 8 | 20 | 6 | 5 |
| subtype1 | 1 | 7 | 1 | 1 |
| subtype2 | 2 | 6 | 1 | 0 |
| subtype3 | 1 | 2 | 1 | 1 |
| subtype4 | 2 | 4 | 1 | 0 |
| subtype5 | 2 | 1 | 2 | 3 |
Figure S13. Get High-res Image Clustering Approach #2: 'RNAseq CNMF subtypes' versus Clinical Feature #6: 'PATHOLOGY.N'
P value = 0.395 (Chi-square test)
Table S16. Clustering Approach #2: 'RNAseq CNMF subtypes' versus Clinical Feature #7: 'PATHOLOGICSPREAD(M)'
| nPatients | M0 | M1 | MX |
|---|---|---|---|
| ALL | 48 | 7 | 2 |
| subtype1 | 13 | 1 | 0 |
| subtype2 | 10 | 0 | 1 |
| subtype3 | 7 | 2 | 0 |
| subtype4 | 11 | 1 | 1 |
| subtype5 | 7 | 3 | 0 |
Figure S14. Get High-res Image Clustering Approach #2: 'RNAseq CNMF subtypes' versus Clinical Feature #7: 'PATHOLOGICSPREAD(M)'
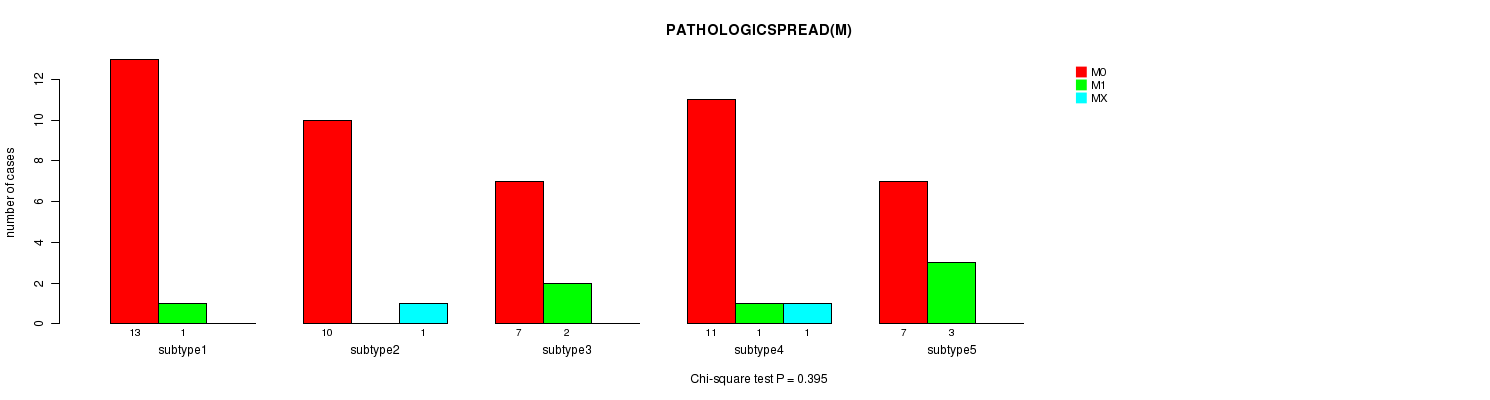
Table S17. Get Full Table Description of clustering approach #3: 'RNAseq cHierClus subtypes'
| Cluster Labels | 1 | 2 |
|---|---|---|
| Number of samples | 29 | 28 |
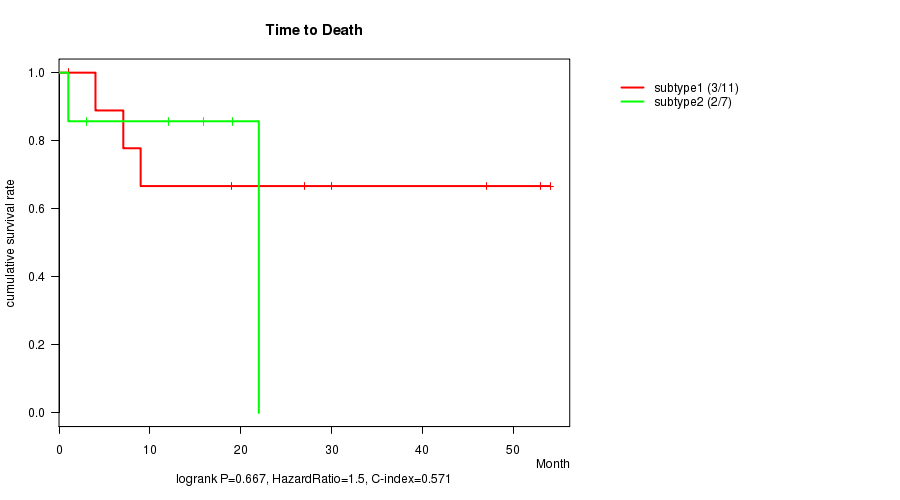
P value = 0.667 (logrank test)
Table S18. Clustering Approach #3: 'RNAseq cHierClus subtypes' versus Clinical Feature #1: 'Time to Death'
| nPatients | nDeath | Duration Range (Median), Month | |
|---|---|---|---|
| ALL | 18 | 5 | 1.0 - 54.0 (14.0) |
| subtype1 | 11 | 3 | 1.0 - 54.0 (18.9) |
| subtype2 | 7 | 2 | 1.0 - 22.0 (12.0) |
Figure S15. Get High-res Image Clustering Approach #3: 'RNAseq cHierClus subtypes' versus Clinical Feature #1: 'Time to Death'
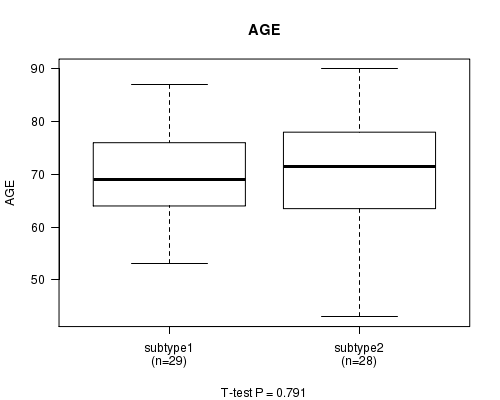
P value = 0.791 (t-test)
Table S19. Clustering Approach #3: 'RNAseq cHierClus subtypes' versus Clinical Feature #2: 'AGE'
| nPatients | Mean (Std.Dev) | |
|---|---|---|
| ALL | 57 | 69.5 (10.1) |
| subtype1 | 29 | 69.8 (9.3) |
| subtype2 | 28 | 69.1 (11.0) |
Figure S16. Get High-res Image Clustering Approach #3: 'RNAseq cHierClus subtypes' versus Clinical Feature #2: 'AGE'
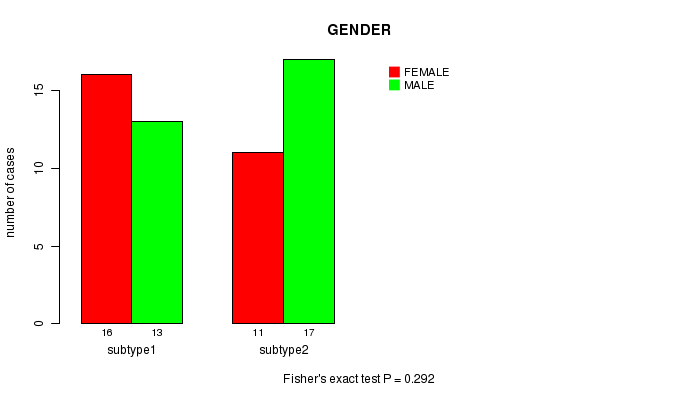
P value = 0.292 (Fisher's exact test)
Table S20. Clustering Approach #3: 'RNAseq cHierClus subtypes' versus Clinical Feature #3: 'GENDER'
| nPatients | FEMALE | MALE |
|---|---|---|
| ALL | 30 | 27 |
| subtype1 | 13 | 16 |
| subtype2 | 17 | 11 |
Figure S17. Get High-res Image Clustering Approach #3: 'RNAseq cHierClus subtypes' versus Clinical Feature #3: 'GENDER'
P value = 0.107 (Chi-square test)
Table S21. Clustering Approach #3: 'RNAseq cHierClus subtypes' versus Clinical Feature #4: 'HISTOLOGICAL.TYPE'
| nPatients | STOMACH ADENOCARCINOMA - DIFFUSE TYPE | STOMACH ADENOCARCINOMA - NOT OTHERWISE SPECIFIED (NOS) | STOMACH INTESTINAL ADENOCARCINOMA - MUCINOUS TYPE | STOMACH INTESTINAL ADENOCARCINOMA - TUBULAR TYPE | STOMACH INTESTINAL ADENOCARCINOMA - TYPE NOT OTHERWISE SPECIFIED (NOS) |
|---|---|---|---|---|---|
| ALL | 2 | 39 | 1 | 1 | 9 |
| subtype1 | 1 | 18 | 0 | 0 | 8 |
| subtype2 | 1 | 21 | 1 | 1 | 1 |
Figure S18. Get High-res Image Clustering Approach #3: 'RNAseq cHierClus subtypes' versus Clinical Feature #4: 'HISTOLOGICAL.TYPE'
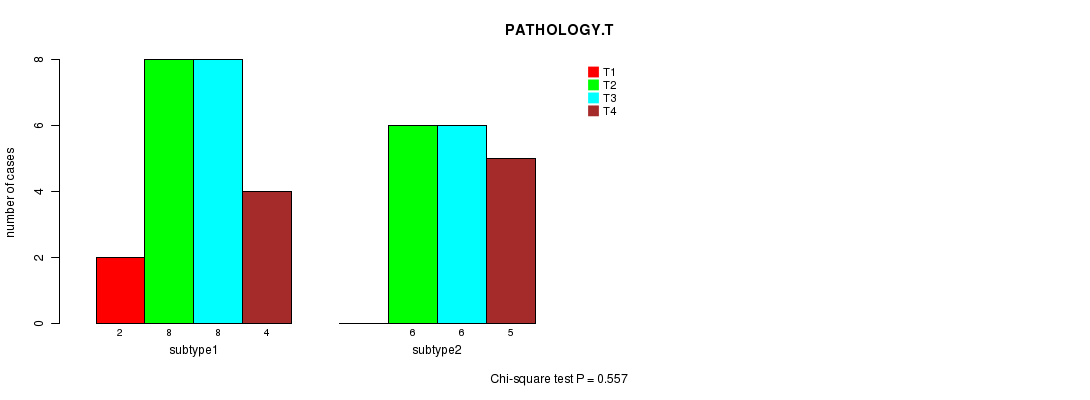
P value = 0.557 (Chi-square test)
Table S22. Clustering Approach #3: 'RNAseq cHierClus subtypes' versus Clinical Feature #5: 'PATHOLOGY.T'
| nPatients | T1 | T2 | T3 | T4 |
|---|---|---|---|---|
| ALL | 2 | 14 | 14 | 9 |
| subtype1 | 2 | 8 | 8 | 4 |
| subtype2 | 0 | 6 | 6 | 5 |
Figure S19. Get High-res Image Clustering Approach #3: 'RNAseq cHierClus subtypes' versus Clinical Feature #5: 'PATHOLOGY.T'
P value = 0.036 (Chi-square test)
Table S23. Clustering Approach #3: 'RNAseq cHierClus subtypes' versus Clinical Feature #6: 'PATHOLOGY.N'
| nPatients | N0 | N1 | N2 | N3 |
|---|---|---|---|---|
| ALL | 8 | 20 | 6 | 5 |
| subtype1 | 7 | 6 | 4 | 3 |
| subtype2 | 1 | 14 | 2 | 2 |
Figure S20. Get High-res Image Clustering Approach #3: 'RNAseq cHierClus subtypes' versus Clinical Feature #6: 'PATHOLOGY.N'
P value = 0.901 (Chi-square test)
Table S24. Clustering Approach #3: 'RNAseq cHierClus subtypes' versus Clinical Feature #7: 'PATHOLOGICSPREAD(M)'
| nPatients | M0 | M1 | MX |
|---|---|---|---|
| ALL | 48 | 7 | 2 |
| subtype1 | 25 | 3 | 1 |
| subtype2 | 23 | 4 | 1 |
Figure S21. Get High-res Image Clustering Approach #3: 'RNAseq cHierClus subtypes' versus Clinical Feature #7: 'PATHOLOGICSPREAD(M)'
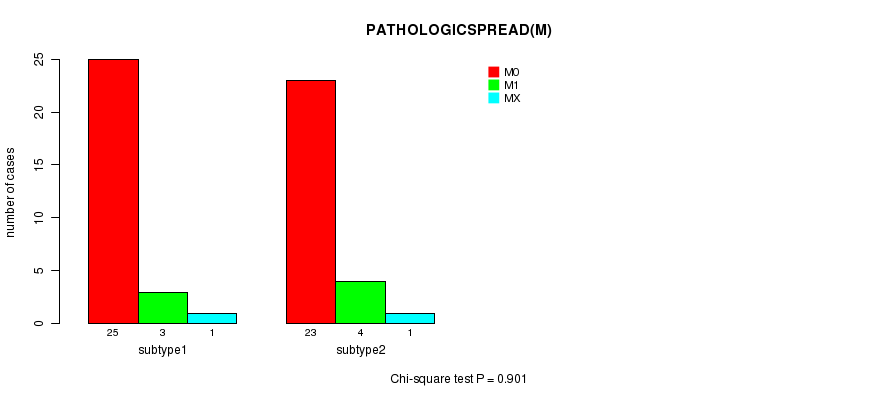
Table S25. Get Full Table Description of clustering approach #4: 'MIRseq CNMF subtypes'
| Cluster Labels | 1 | 2 | 3 |
|---|---|---|---|
| Number of samples | 39 | 47 | 37 |
P value = 0.569 (logrank test)
Table S26. Clustering Approach #4: 'MIRseq CNMF subtypes' versus Clinical Feature #1: 'Time to Death'
| nPatients | nDeath | Duration Range (Median), Month | |
|---|---|---|---|
| ALL | 76 | 14 | 0.1 - 70.1 (4.4) |
| subtype1 | 37 | 6 | 0.3 - 70.1 (4.7) |
| subtype2 | 17 | 5 | 0.1 - 47.0 (7.1) |
| subtype3 | 22 | 3 | 0.1 - 65.1 (1.2) |
Figure S22. Get High-res Image Clustering Approach #4: 'MIRseq CNMF subtypes' versus Clinical Feature #1: 'Time to Death'
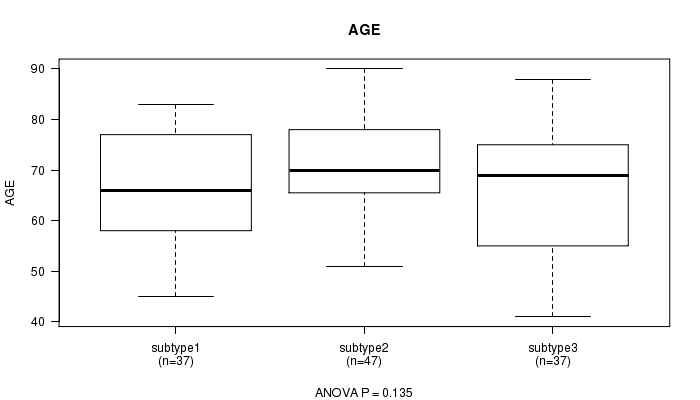
P value = 0.135 (ANOVA)
Table S27. Clustering Approach #4: 'MIRseq CNMF subtypes' versus Clinical Feature #2: 'AGE'
| nPatients | Mean (Std.Dev) | |
|---|---|---|
| ALL | 121 | 68.0 (10.8) |
| subtype1 | 37 | 66.9 (10.4) |
| subtype2 | 47 | 70.4 (9.7) |
| subtype3 | 37 | 66.1 (12.2) |
Figure S23. Get High-res Image Clustering Approach #4: 'MIRseq CNMF subtypes' versus Clinical Feature #2: 'AGE'
P value = 0.375 (Fisher's exact test)
Table S28. Clustering Approach #4: 'MIRseq CNMF subtypes' versus Clinical Feature #3: 'GENDER'
| nPatients | FEMALE | MALE |
|---|---|---|
| ALL | 48 | 75 |
| subtype1 | 14 | 25 |
| subtype2 | 22 | 25 |
| subtype3 | 12 | 25 |
Figure S24. Get High-res Image Clustering Approach #4: 'MIRseq CNMF subtypes' versus Clinical Feature #3: 'GENDER'

P value = 0.000364 (Chi-square test)
Table S29. Clustering Approach #4: 'MIRseq CNMF subtypes' versus Clinical Feature #4: 'HISTOLOGICAL.TYPE'
| nPatients | STOMACH ADENOCARCINOMA - DIFFUSE TYPE | STOMACH ADENOCARCINOMA - NOT OTHERWISE SPECIFIED (NOS) | STOMACH INTESTINAL ADENOCARCINOMA - MUCINOUS TYPE | STOMACH INTESTINAL ADENOCARCINOMA - PAPILLARY TYPE | STOMACH INTESTINAL ADENOCARCINOMA - TUBULAR TYPE | STOMACH INTESTINAL ADENOCARCINOMA - TYPE NOT OTHERWISE SPECIFIED (NOS) |
|---|---|---|---|---|---|---|
| ALL | 12 | 68 | 4 | 2 | 9 | 23 |
| subtype1 | 4 | 13 | 0 | 2 | 7 | 13 |
| subtype2 | 2 | 34 | 1 | 0 | 1 | 6 |
| subtype3 | 6 | 21 | 3 | 0 | 1 | 4 |
Figure S25. Get High-res Image Clustering Approach #4: 'MIRseq CNMF subtypes' versus Clinical Feature #4: 'HISTOLOGICAL.TYPE'
P value = 0.307 (Chi-square test)
Table S30. Clustering Approach #4: 'MIRseq CNMF subtypes' versus Clinical Feature #5: 'PATHOLOGY.T'
| nPatients | T1 | T2 | T3 | T4 |
|---|---|---|---|---|
| ALL | 4 | 43 | 40 | 15 |
| subtype1 | 1 | 18 | 16 | 3 |
| subtype2 | 3 | 12 | 14 | 5 |
| subtype3 | 0 | 13 | 10 | 7 |
Figure S26. Get High-res Image Clustering Approach #4: 'MIRseq CNMF subtypes' versus Clinical Feature #5: 'PATHOLOGY.T'

P value = 0.559 (Chi-square test)
Table S31. Clustering Approach #4: 'MIRseq CNMF subtypes' versus Clinical Feature #6: 'PATHOLOGY.N'
| nPatients | N0 | N1 | N2 | N3 |
|---|---|---|---|---|
| ALL | 32 | 43 | 18 | 12 |
| subtype1 | 15 | 13 | 7 | 3 |
| subtype2 | 7 | 18 | 5 | 4 |
| subtype3 | 10 | 12 | 6 | 5 |
Figure S27. Get High-res Image Clustering Approach #4: 'MIRseq CNMF subtypes' versus Clinical Feature #6: 'PATHOLOGY.N'

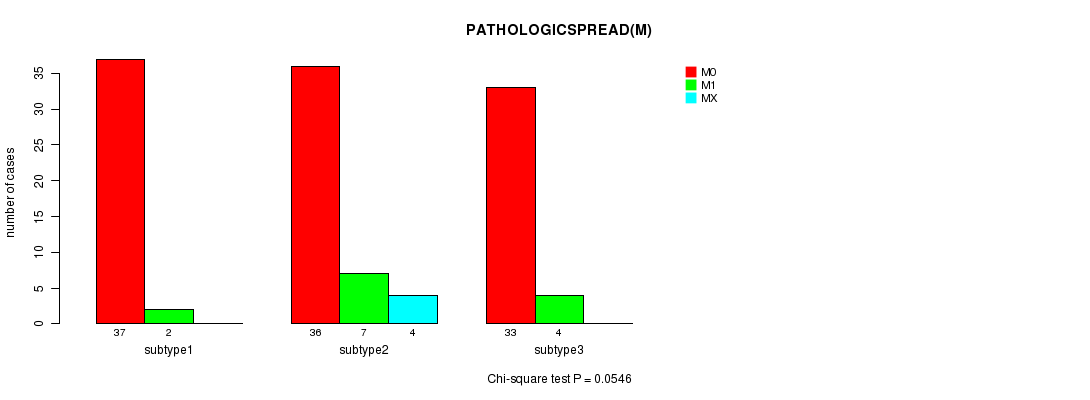
P value = 0.0546 (Chi-square test)
Table S32. Clustering Approach #4: 'MIRseq CNMF subtypes' versus Clinical Feature #7: 'PATHOLOGICSPREAD(M)'
| nPatients | M0 | M1 | MX |
|---|---|---|---|
| ALL | 106 | 13 | 4 |
| subtype1 | 37 | 2 | 0 |
| subtype2 | 36 | 7 | 4 |
| subtype3 | 33 | 4 | 0 |
Figure S28. Get High-res Image Clustering Approach #4: 'MIRseq CNMF subtypes' versus Clinical Feature #7: 'PATHOLOGICSPREAD(M)'
P value = 0.0622 (Fisher's exact test)
Table S33. Clustering Approach #4: 'MIRseq CNMF subtypes' versus Clinical Feature #8: 'NEOADJUVANT.THERAPY'
| nPatients | NO | YES |
|---|---|---|
| ALL | 116 | 7 |
| subtype1 | 35 | 4 |
| subtype2 | 47 | 0 |
| subtype3 | 34 | 3 |
Figure S29. Get High-res Image Clustering Approach #4: 'MIRseq CNMF subtypes' versus Clinical Feature #8: 'NEOADJUVANT.THERAPY'
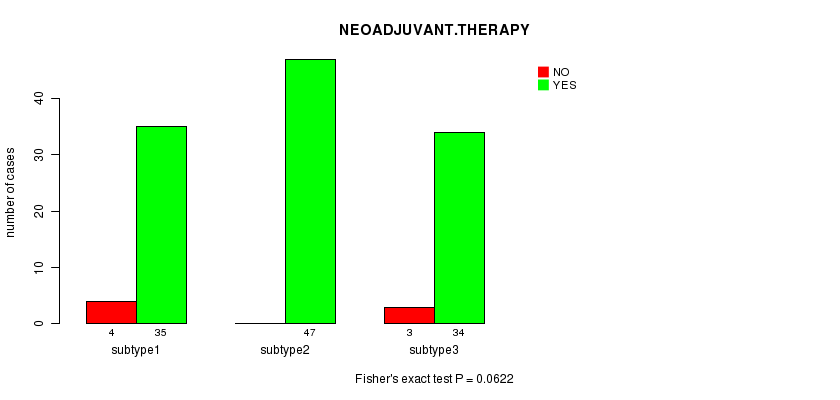
Table S34. Get Full Table Description of clustering approach #5: 'MIRseq cHierClus subtypes'
| Cluster Labels | 1 | 2 | 3 |
|---|---|---|---|
| Number of samples | 29 | 48 | 46 |
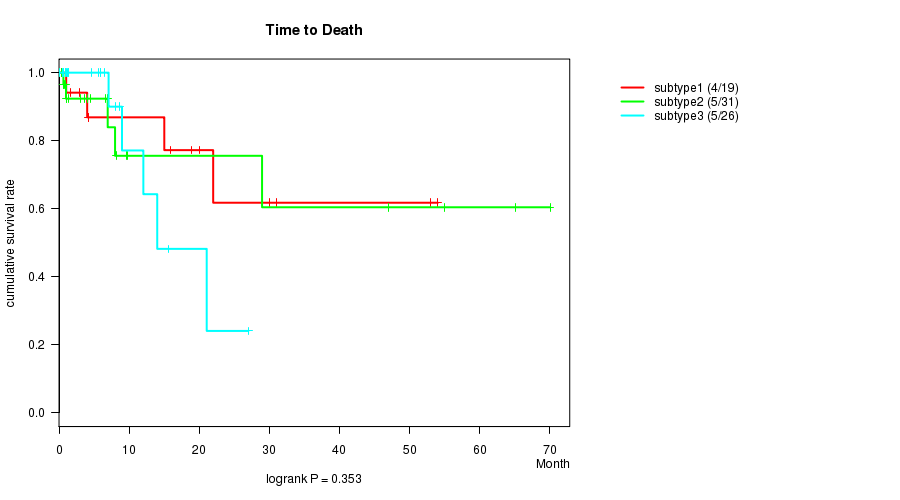
P value = 0.353 (logrank test)
Table S35. Clustering Approach #5: 'MIRseq cHierClus subtypes' versus Clinical Feature #1: 'Time to Death'
| nPatients | nDeath | Duration Range (Median), Month | |
|---|---|---|---|
| ALL | 76 | 14 | 0.1 - 70.1 (4.4) |
| subtype1 | 19 | 4 | 0.3 - 54.0 (4.3) |
| subtype2 | 31 | 5 | 0.1 - 70.1 (3.6) |
| subtype3 | 26 | 5 | 0.1 - 27.0 (5.8) |
Figure S30. Get High-res Image Clustering Approach #5: 'MIRseq cHierClus subtypes' versus Clinical Feature #1: 'Time to Death'
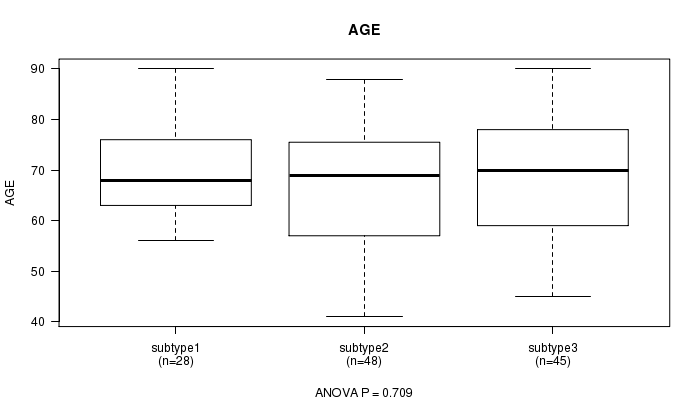
P value = 0.709 (ANOVA)
Table S36. Clustering Approach #5: 'MIRseq cHierClus subtypes' versus Clinical Feature #2: 'AGE'
| nPatients | Mean (Std.Dev) | |
|---|---|---|
| ALL | 121 | 68.0 (10.8) |
| subtype1 | 28 | 69.0 (9.1) |
| subtype2 | 48 | 67.0 (11.6) |
| subtype3 | 45 | 68.5 (11.1) |
Figure S31. Get High-res Image Clustering Approach #5: 'MIRseq cHierClus subtypes' versus Clinical Feature #2: 'AGE'
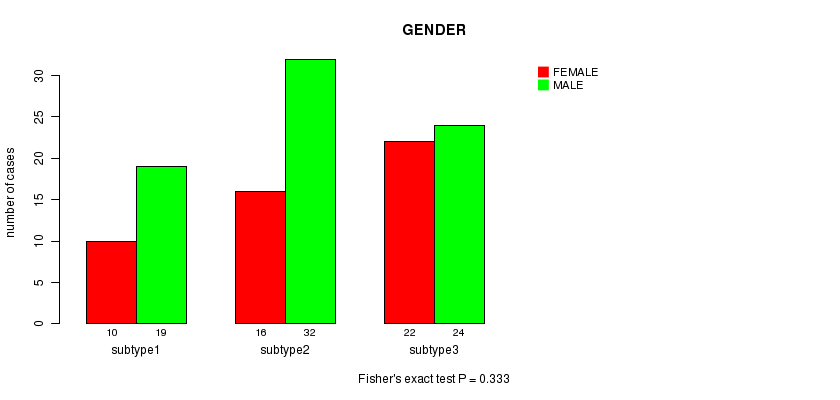
P value = 0.333 (Fisher's exact test)
Table S37. Clustering Approach #5: 'MIRseq cHierClus subtypes' versus Clinical Feature #3: 'GENDER'
| nPatients | FEMALE | MALE |
|---|---|---|
| ALL | 48 | 75 |
| subtype1 | 10 | 19 |
| subtype2 | 16 | 32 |
| subtype3 | 22 | 24 |
Figure S32. Get High-res Image Clustering Approach #5: 'MIRseq cHierClus subtypes' versus Clinical Feature #3: 'GENDER'
P value = 0.0547 (Chi-square test)
Table S38. Clustering Approach #5: 'MIRseq cHierClus subtypes' versus Clinical Feature #4: 'HISTOLOGICAL.TYPE'
| nPatients | STOMACH ADENOCARCINOMA - DIFFUSE TYPE | STOMACH ADENOCARCINOMA - NOT OTHERWISE SPECIFIED (NOS) | STOMACH INTESTINAL ADENOCARCINOMA - MUCINOUS TYPE | STOMACH INTESTINAL ADENOCARCINOMA - PAPILLARY TYPE | STOMACH INTESTINAL ADENOCARCINOMA - TUBULAR TYPE | STOMACH INTESTINAL ADENOCARCINOMA - TYPE NOT OTHERWISE SPECIFIED (NOS) |
|---|---|---|---|---|---|---|
| ALL | 12 | 68 | 4 | 2 | 9 | 23 |
| subtype1 | 0 | 14 | 0 | 2 | 4 | 9 |
| subtype2 | 6 | 26 | 3 | 0 | 3 | 7 |
| subtype3 | 6 | 28 | 1 | 0 | 2 | 7 |
Figure S33. Get High-res Image Clustering Approach #5: 'MIRseq cHierClus subtypes' versus Clinical Feature #4: 'HISTOLOGICAL.TYPE'

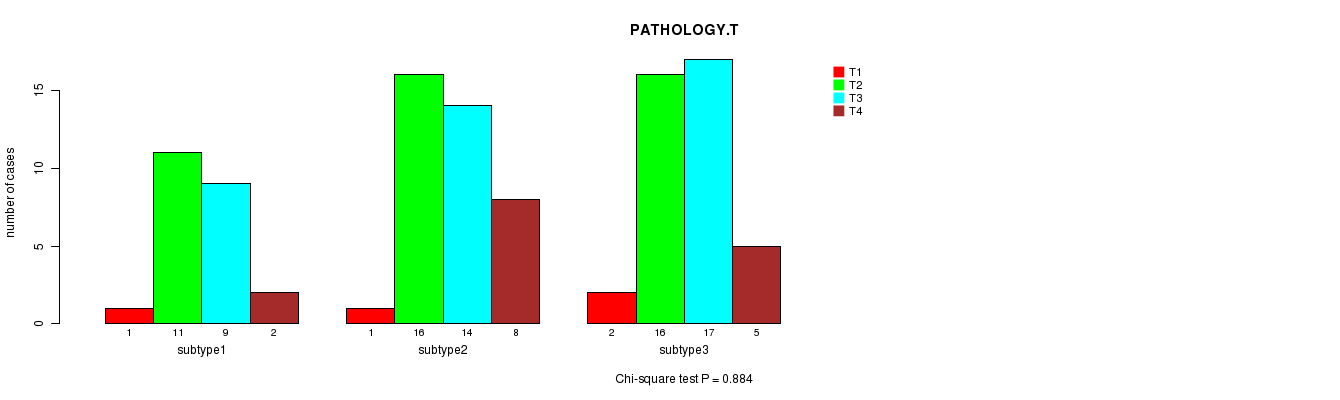
P value = 0.884 (Chi-square test)
Table S39. Clustering Approach #5: 'MIRseq cHierClus subtypes' versus Clinical Feature #5: 'PATHOLOGY.T'
| nPatients | T1 | T2 | T3 | T4 |
|---|---|---|---|---|
| ALL | 4 | 43 | 40 | 15 |
| subtype1 | 1 | 11 | 9 | 2 |
| subtype2 | 1 | 16 | 14 | 8 |
| subtype3 | 2 | 16 | 17 | 5 |
Figure S34. Get High-res Image Clustering Approach #5: 'MIRseq cHierClus subtypes' versus Clinical Feature #5: 'PATHOLOGY.T'
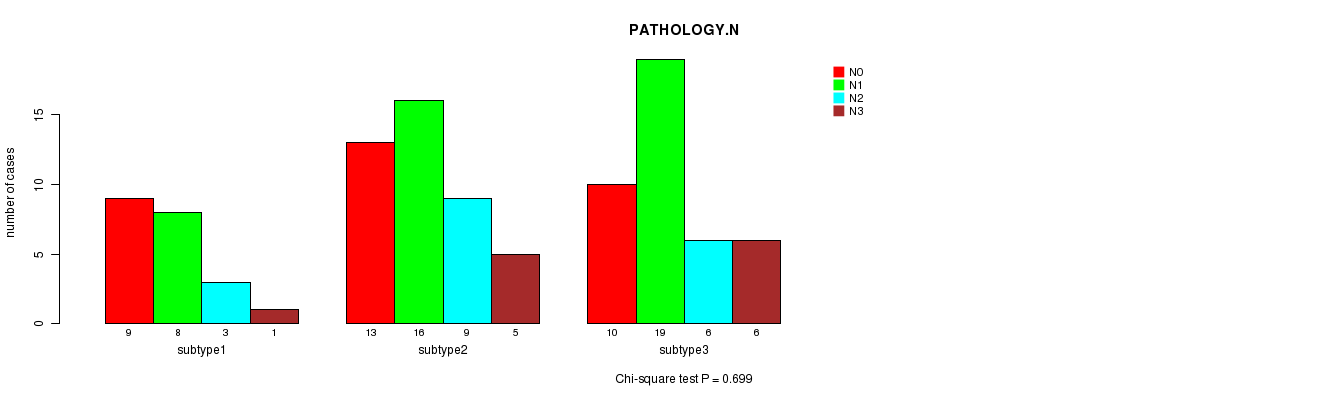
P value = 0.699 (Chi-square test)
Table S40. Clustering Approach #5: 'MIRseq cHierClus subtypes' versus Clinical Feature #6: 'PATHOLOGY.N'
| nPatients | N0 | N1 | N2 | N3 |
|---|---|---|---|---|
| ALL | 32 | 43 | 18 | 12 |
| subtype1 | 9 | 8 | 3 | 1 |
| subtype2 | 13 | 16 | 9 | 5 |
| subtype3 | 10 | 19 | 6 | 6 |
Figure S35. Get High-res Image Clustering Approach #5: 'MIRseq cHierClus subtypes' versus Clinical Feature #6: 'PATHOLOGY.N'
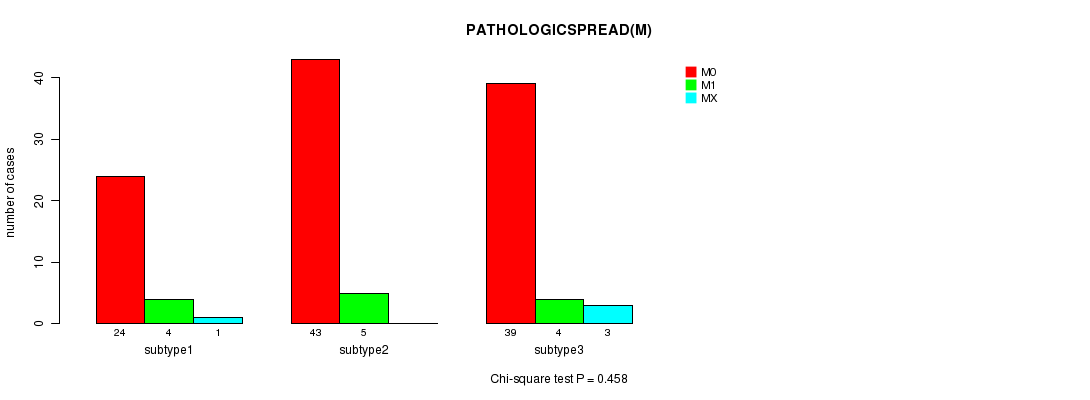
P value = 0.458 (Chi-square test)
Table S41. Clustering Approach #5: 'MIRseq cHierClus subtypes' versus Clinical Feature #7: 'PATHOLOGICSPREAD(M)'
| nPatients | M0 | M1 | MX |
|---|---|---|---|
| ALL | 106 | 13 | 4 |
| subtype1 | 24 | 4 | 1 |
| subtype2 | 43 | 5 | 0 |
| subtype3 | 39 | 4 | 3 |
Figure S36. Get High-res Image Clustering Approach #5: 'MIRseq cHierClus subtypes' versus Clinical Feature #7: 'PATHOLOGICSPREAD(M)'
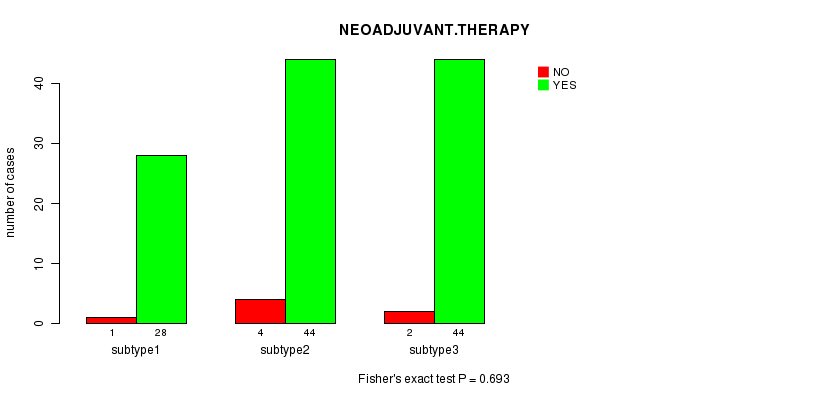
P value = 0.693 (Fisher's exact test)
Table S42. Clustering Approach #5: 'MIRseq cHierClus subtypes' versus Clinical Feature #8: 'NEOADJUVANT.THERAPY'
| nPatients | NO | YES |
|---|---|---|
| ALL | 116 | 7 |
| subtype1 | 28 | 1 |
| subtype2 | 44 | 4 |
| subtype3 | 44 | 2 |
Figure S37. Get High-res Image Clustering Approach #5: 'MIRseq cHierClus subtypes' versus Clinical Feature #8: 'NEOADJUVANT.THERAPY'
-
Cluster data file = STAD.mergedcluster.txt
-
Clinical data file = STAD.clin.merged.picked.txt
-
Number of patients = 124
-
Number of clustering approaches = 5
-
Number of selected clinical features = 8
-
Exclude small clusters that include fewer than K patients, K = 3
consensus non-negative matrix factorization clustering approach (Brunet et al. 2004)
Resampling-based clustering method (Monti et al. 2003)
For survival clinical features, the Kaplan-Meier survival curves of tumors with and without gene mutations were plotted and the statistical significance P values were estimated by logrank test (Bland and Altman 2004) using the 'survdiff' function in R
For continuous numerical clinical features, one-way analysis of variance (Howell 2002) was applied to compare the clinical values between tumor subtypes using 'anova' function in R
For binary clinical features, two-tailed Fisher's exact tests (Fisher 1922) were used to estimate the P values using the 'fisher.test' function in R
For multi-class clinical features (nominal or ordinal), Chi-square tests (Greenwood and Nikulin 1996) were used to estimate the P values using the 'chisq.test' function in R
For continuous numerical clinical features, two-tailed Student's t test with unequal variance (Lehmann and Romano 2005) was applied to compare the clinical values between two tumor subtypes using 't.test' function in R
This is an experimental feature. Location of data archives could not be determined.