This pipeline uses various statistical tests to identify mRNAs whose expression levels correlated to selected clinical features.
Testing the association between 17814 genes and 5 clinical features across 54 samples, statistically thresholded by Q value < 0.05, 1 clinical feature related to at least one genes.
-
155 genes correlated to 'HISTOLOGICAL.TYPE'.
-
KLHL34 , C19ORF12 , OR4S2 , KIAA1324 , FOXA2 , ...
-
No genes correlated to 'Time to Death', 'AGE', 'RADIATIONS.RADIATION.REGIMENINDICATION', and 'NEOADJUVANT.THERAPY'.
Complete statistical result table is provided in Supplement Table 1
Table 1. Get Full Table This table shows the clinical features, statistical methods used, and the number of genes that are significantly associated with each clinical feature at Q value < 0.05.
| Clinical feature | Statistical test | Significant genes | Associated with | Associated with | ||
|---|---|---|---|---|---|---|
| Time to Death | Cox regression test | N=0 | ||||
| AGE | Spearman correlation test | N=0 | ||||
| HISTOLOGICAL TYPE | ANOVA test | N=155 | ||||
| RADIATIONS RADIATION REGIMENINDICATION | t test | N=0 | ||||
| NEOADJUVANT THERAPY | t test | N=0 |
Table S1. Basic characteristics of clinical feature: 'Time to Death'
| Time to Death | Duration (Months) | 6-133.2 (median=35.4) |
| censored | N = 47 | |
| death | N = 7 | |
| Significant markers | N = 0 |
Table S2. Basic characteristics of clinical feature: 'AGE'
| AGE | Mean (SD) | 62.94 (12) |
| Significant markers | N = 0 |
Table S3. Basic characteristics of clinical feature: 'HISTOLOGICAL.TYPE'
| HISTOLOGICAL.TYPE | Labels | N |
| ENDOMETRIOID ENDOMETRIAL ADENOCARCINOMA (GRADE 1 OR 2) | 25 | |
| ENDOMETRIOID ENDOMETRIAL ADENOCARCINOMA (GRADE 3) | 16 | |
| MIXED SEROUS AND ENDOMETRIOID | 1 | |
| UTERINE SEROUS ENDOMETRIAL ADENOCARCINOMA | 12 | |
| Significant markers | N = 155 |
Table S4. Get Full Table List of top 10 genes differentially expressed by 'HISTOLOGICAL.TYPE'
| ANOVA_P | Q | |
|---|---|---|
| KLHL34 | 7.886e-16 | 1.4e-11 |
| C19ORF12 | 1.037e-13 | 1.85e-09 |
| OR4S2 | 1.263e-13 | 2.25e-09 |
| KIAA1324 | 1.448e-13 | 2.58e-09 |
| FOXA2 | 6.396e-13 | 1.14e-08 |
| TSP50 | 2.424e-12 | 4.32e-08 |
| PNOC | 3.792e-12 | 6.75e-08 |
| CDH6 | 1.536e-11 | 2.73e-07 |
| SLC25A35 | 1.773e-11 | 3.16e-07 |
| CLDN6 | 1.359e-10 | 2.42e-06 |
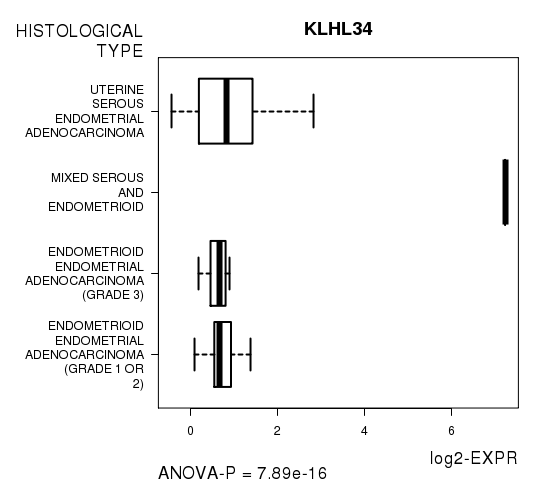
Figure S1. Get High-res Image As an example, this figure shows the association of KLHL34 to 'HISTOLOGICAL.TYPE'. P value = 7.89e-16 with ANOVA analysis.
No gene related to 'RADIATIONS.RADIATION.REGIMENINDICATION'.
Table S5. Basic characteristics of clinical feature: 'RADIATIONS.RADIATION.REGIMENINDICATION'
| RADIATIONS.RADIATION.REGIMENINDICATION | Labels | N |
| NO | 25 | |
| YES | 29 | |
| Significant markers | N = 0 |
-
Expresson data file = UCEC.medianexp.txt
-
Clinical data file = UCEC.clin.merged.picked.txt
-
Number of patients = 54
-
Number of genes = 17814
-
Number of clinical features = 5
For survival clinical features, Wald's test in univariate Cox regression analysis with proportional hazards model (Andersen and Gill 1982) was used to estimate the P values using the 'coxph' function in R. Kaplan-Meier survival curves were plot using the four quartile subgroups of patients based on expression levels
For continuous numerical clinical features, Spearman's rank correlation coefficients (Spearman 1904) and two-tailed P values were estimated using 'cor.test' function in R
For multi-class clinical features (ordinal or nominal), one-way analysis of variance (Howell 2002) was applied to compare the log2-expression levels between different clinical classes using 'anova' function in R
For two-class clinical features, two-tailed Student's t test with unequal variance (Lehmann and Romano 2005) was applied to compare the log2-expression levels between the two clinical classes using 't.test' function in R
For multiple hypothesis correction, Q value is the False Discovery Rate (FDR) analogue of the P value (Benjamini and Hochberg 1995), defined as the minimum FDR at which the test may be called significant. We used the 'Benjamini and Hochberg' method of 'p.adjust' function in R to convert P values into Q values.
This is an experimental feature. Location of data archives could not be determined.