This report serves to describe the mutational landscape and properties of a given individual set, as well as rank genes and genesets according to mutational significance. MutSig v1.5 was used to generate the results found in this report.
Working with individual set: BLCA.
Number of patients in set: 28
The input for this pipeline is a set of individuals with the following files associated for each:
1. An annotated .maf file describing the mutations called for the respective individual, and their properties.
2. A .wig file that contains information about the coverage of the sample.
Significantly mutated genes (q ≤ 0.1): 25
Mutations seen in COSMIC: 0
Significantly mutated genes in COSMIC territory: 0
Genes with clustered mutations (&le 3 aa apart): 0
Significantly mutated genesets: 6
Significantly mutated genesets: (excluding sig. mutated genes): 0
Table 1. Get Full Table Table representing breakdown of mutations by type.
| type | count |
|---|---|
| In_Frame_Del | 1 |
| Missense_Mutation | 79 |
| Nonsense_Mutation | 6 |
| Silent | 33 |
| Total | 119 |
Table 2. Get Full Table A breakdown of mutation rates per category discovered for this individual set.
| category | n | N | rate | rate_per_mb | relative_rate | exp_ns_s_ratio |
|---|---|---|---|---|---|---|
| Tp*C->(T/G) | 44 | 684404 | 0.000064 | 64 | 4.1 | 2.6 |
| Tp*C->A | 4 | 684404 | 5.8e-06 | 5.8 | 0.37 | 3.3 |
| (A/C/G)p*C->mut | 20 | 2423008 | 8.3e-06 | 8.3 | 0.52 | 2.6 |
| A->mut | 11 | 2353008 | 4.7e-06 | 4.7 | 0.3 | 4.2 |
| indel+null | 7 | 5460420 | 1.3e-06 | 1.3 | 0.081 | NaN |
| Total | 86 | 5460420 | 0.000016 | 16 | 1 | 3.2 |
The x axis represents the samples. The y axis represents the exons, one row per exon, and they are sorted by average coverage across samples. For exons with exactly the same average coverage, they are sorted next by the %GC of the exon. (The secondary sort is especially useful for the zero-coverage exons at the bottom).
Figure 1.
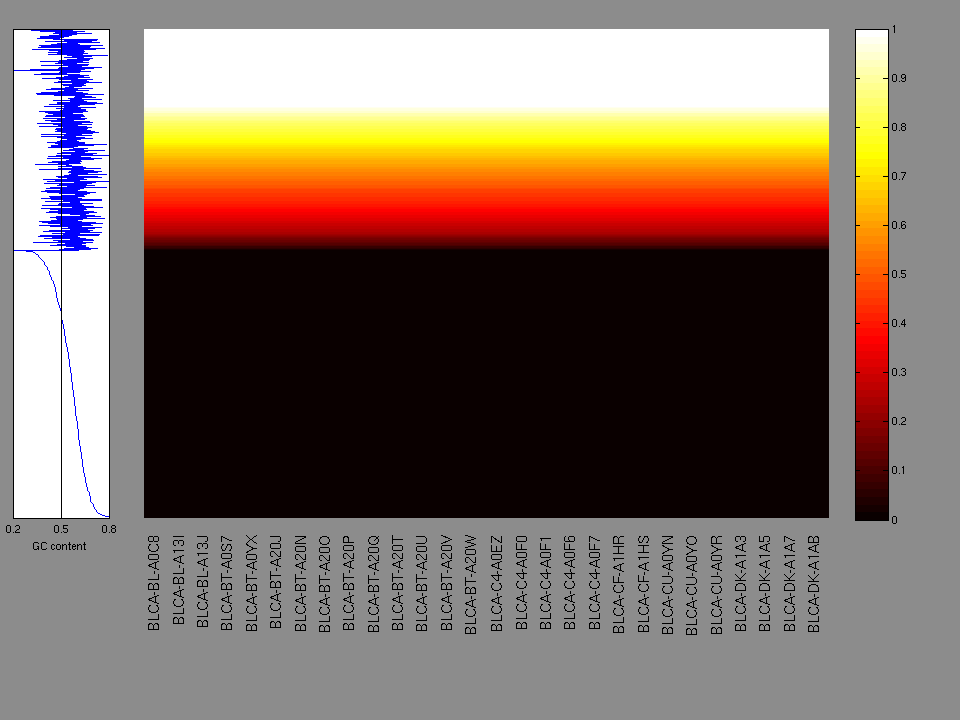
Figure 2.
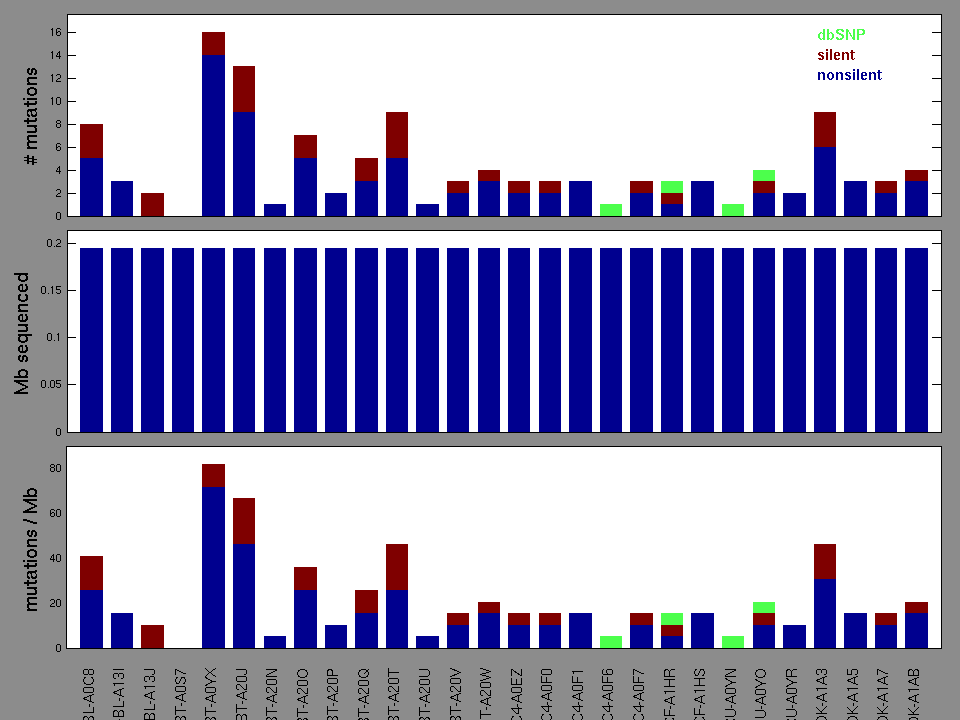
Table 3. Get Full Table A Ranked List of Significantly Mutated Genes. Number of significant genes found: 25. Number of genes displayed: 35
| rank | gene | description | N | n | npat | nsite | nsil | n1 | n2 | n3 | n4 | n5 | p_ns_s | p | q |
|---|---|---|---|---|---|---|---|---|---|---|---|---|---|---|---|
| 1 | MXRA5 | matrix-remodelling associated 5 | 60480 | 2 | 2 | 2 | 0 | 0 | 0 | 1 | 1 | 0 | 0.57 | 8.2e-06 | 0.0032 |
| 2 | B3GALT4 | UDP-Gal:betaGlcNAc beta 1,3-galactosyltransferase, polypeptide 4 | 9324 | 2 | 2 | 2 | 0 | 1 | 0 | 0 | 0 | 1 | 0.48 | 0.000033 | 0.0065 |
| 3 | CLUAP1 | clusterin associated protein 1 | 10388 | 2 | 2 | 2 | 0 | 1 | 0 | 1 | 0 | 0 | 0.66 | 0.000055 | 0.0071 |
| 4 | NISCH | nischarin | 34496 | 3 | 3 | 3 | 0 | 1 | 0 | 1 | 0 | 1 | 0.35 | 0.000095 | 0.0084 |
| 5 | NRBP1 | nuclear receptor binding protein 1 | 19180 | 2 | 2 | 2 | 0 | 0 | 0 | 1 | 1 | 0 | 0.63 | 0.00011 | 0.0084 |
| 6 | CRYBA2 | crystallin, beta A2 | 6524 | 1 | 1 | 1 | 0 | 0 | 0 | 0 | 0 | 1 | 1 | 0.00022 | 0.015 |
| 7 | OR6C70 | olfactory receptor, family 6, subfamily C, member 70 | 7504 | 1 | 1 | 1 | 1 | 0 | 0 | 1 | 0 | 0 | 0.96 | 0.00028 | 0.016 |
| 8 | C16orf54 | chromosome 16 open reading frame 54 | 5516 | 1 | 1 | 1 | 0 | 0 | 0 | 1 | 0 | 0 | 0.77 | 0.00032 | 0.016 |
| 9 | CACNG8 | calcium channel, voltage-dependent, gamma subunit 8 | 9212 | 1 | 1 | 1 | 0 | 0 | 0 | 0 | 1 | 0 | 0.98 | 0.00036 | 0.016 |
| 10 | OR4L1 | olfactory receptor, family 4, subfamily L, member 1 | 9436 | 1 | 1 | 1 | 0 | 0 | 0 | 0 | 1 | 0 | 0.79 | 0.00048 | 0.019 |
| 11 | CTU1 | 14336 | 1 | 1 | 1 | 0 | 0 | 0 | 0 | 1 | 0 | 0.9 | 0.00083 | 0.029 | |
| 12 | SYT3 | synaptotagmin III | 13076 | 2 | 2 | 2 | 0 | 1 | 0 | 0 | 1 | 0 | 0.54 | 0.00095 | 0.031 |
| 13 | PRR22 | 16912 | 1 | 1 | 1 | 0 | 0 | 0 | 1 | 0 | 0 | 0.68 | 0.0017 | 0.048 | |
| 14 | KLHL17 | kelch-like 17 (Drosophila) | 18480 | 1 | 1 | 1 | 0 | 0 | 1 | 0 | 0 | 0 | 0.79 | 0.0019 | 0.048 |
| 15 | GLYR1 | 14980 | 1 | 1 | 1 | 0 | 0 | 0 | 0 | 0 | 1 | 0.75 | 0.0019 | 0.048 | |
| 16 | PCDHB10 | protocadherin beta 10 | 18564 | 1 | 1 | 1 | 1 | 0 | 0 | 1 | 0 | 0 | 0.89 | 0.0023 | 0.055 |
| 17 | ZNF777 | zinc finger protein 777 | 19264 | 1 | 1 | 1 | 0 | 0 | 0 | 1 | 0 | 0 | 0.71 | 0.0028 | 0.059 |
| 18 | ZNF214 | zinc finger protein 214 | 19964 | 1 | 1 | 1 | 0 | 0 | 1 | 0 | 0 | 0 | 0.92 | 0.0029 | 0.059 |
| 19 | RBPJL | recombination signal binding protein for immunoglobulin kappa J region-like | 20748 | 1 | 1 | 1 | 0 | 0 | 0 | 0 | 1 | 0 | 0.9 | 0.0029 | 0.059 |
| 20 | MSH5 | mutS homolog 5 (E. coli) | 20804 | 1 | 1 | 1 | 1 | 0 | 0 | 1 | 0 | 0 | 0.93 | 0.0032 | 0.063 |
| 21 | ABCC10 | ATP-binding cassette, sub-family C (CFTR/MRP), member 10 | 32872 | 1 | 1 | 1 | 0 | 0 | 0 | 1 | 0 | 0 | 0.68 | 0.0049 | 0.086 |
| 22 | PCDHA4 | protocadherin alpha 4 | 36988 | 1 | 1 | 1 | 0 | 0 | 0 | 1 | 0 | 0 | 0.67 | 0.0051 | 0.086 |
| 23 | CIC | capicua homolog (Drosophila) | 40040 | 1 | 1 | 1 | 1 | 0 | 0 | 0 | 1 | 0 | 0.9 | 0.0052 | 0.086 |
| 24 | C17orf81 | chromosome 17 open reading frame 81 | 13692 | 3 | 2 | 3 | 1 | 2 | 0 | 1 | 0 | 0 | 0.77 | 0.0054 | 0.086 |
| 25 | PCDHGA5 | protocadherin gamma subfamily A, 5 | 34132 | 1 | 1 | 1 | 0 | 0 | 0 | 1 | 0 | 0 | 0.72 | 0.0055 | 0.086 |
| 26 | PCDHA10 | protocadherin alpha 10 | 55972 | 1 | 1 | 1 | 0 | 0 | 0 | 1 | 0 | 0 | 0.68 | 0.0087 | 0.13 |
| 27 | PHRF1 | 57596 | 1 | 1 | 1 | 1 | 0 | 0 | 1 | 0 | 0 | 0.92 | 0.011 | 0.16 | |
| 28 | SLC35B2 | solute carrier family 35, member B2 | 12096 | 1 | 1 | 1 | 0 | 0 | 0 | 1 | 0 | 0 | 0.72 | 0.013 | 0.18 |
| 29 | B3GNT1 | UDP-GlcNAc:betaGal beta-1,3-N-acetylglucosaminyltransferase 1 | 14504 | 1 | 1 | 1 | 0 | 1 | 0 | 0 | 0 | 0 | 0.69 | 0.03 | 0.38 |
| 30 | MCOLN1 | mucolipin 1 | 17192 | 1 | 1 | 1 | 0 | 0 | 0 | 0 | 0 | 1 | 0.69 | 0.03 | 0.38 |
| 31 | MAP4K2 | mitogen-activated protein kinase kinase kinase kinase 2 | 19852 | 2 | 2 | 2 | 0 | 2 | 0 | 0 | 0 | 0 | 0.4 | 0.031 | 0.38 |
| 32 | ZNF275 | zinc finger protein 275 | 8764 | 1 | 1 | 1 | 0 | 1 | 0 | 0 | 0 | 0 | 0.68 | 0.033 | 0.4 |
| 33 | TIAF1 | TGFB1-induced anti-apoptotic factor 1 | 2716 | 1 | 1 | 1 | 0 | 1 | 0 | 0 | 0 | 0 | 0.82 | 0.034 | 0.4 |
| 34 | NPFF | neuropeptide FF-amide peptide precursor | 2968 | 1 | 1 | 1 | 0 | 1 | 0 | 0 | 0 | 0 | 0.89 | 0.036 | 0.42 |
| 35 | FBXW12 | F-box and WD repeat domain containing 12 | 12152 | 1 | 1 | 1 | 0 | 0 | 0 | 0 | 0 | 1 | 0.76 | 0.038 | 0.42 |
Note:
N - number of sequenced bases in this gene across the individual set.
n - number of (nonsilent) mutations in this gene across the individual set.
npat - number of patients (individuals) with at least one nonsilent mutation.
nsite - number of unique sites having a non-silent mutation.
nsil - number of silent mutations in this gene across the individual set.
n1 - number of nonsilent mutations of type: Tp*C->(T/G) .
n2 - number of nonsilent mutations of type: Tp*C->A .
n3 - number of nonsilent mutations of type: (A/C/G)p*C->mut .
n4 - number of nonsilent mutations of type: A->mut .
n5 - number of nonsilent mutations of type: indel+null .
null - mutation category that includes nonsense, frameshift, splice-site mutations
p_classic = p-value for the observed amount of nonsilent mutations being elevated in this gene
p_ns_s = p-value for the observed nonsilent/silent ratio being elevated in this gene
p = p-value (overall)
q = q-value, False Discovery Rate (Benjamini-Hochberg procedure)
In this analysis, COSMIC is used as a filter to increase power by restricting the territory of each gene. Cosmic version: v48.
Table 4. Get Full Table Significantly mutated genes (COSMIC territory only). To access the database please go to: COSMIC. Number of significant genes found: 0. Number of genes displayed: 10
| rank | gene | description | n | cos | n_cos | N_cos | cos_ev | p | q |
|---|---|---|---|---|---|---|---|---|---|
| 1 | ABCC10 | ATP-binding cassette, sub-family C (CFTR/MRP), member 10 | 1 | 0 | 0 | 0 | 0 | 1 | 1 |
| 2 | BACH2 | BTB and CNC homology 1, basic leucine zipper transcription factor 2 | 1 | 0 | 0 | 0 | 0 | 1 | 1 |
| 3 | BSN | bassoon (presynaptic cytomatrix protein) | 1 | 0 | 0 | 0 | 0 | 1 | 1 |
| 4 | CLIC1 | chloride intracellular channel 1 | 0 | 0 | 0 | 0 | 0 | 1 | 1 |
| 5 | FAM78B | family with sequence similarity 78, member B | 0 | 0 | 0 | 0 | 0 | 1 | 1 |
| 6 | FGF23 | fibroblast growth factor 23 | 0 | 0 | 0 | 0 | 0 | 1 | 1 |
| 7 | GNAT1 | guanine nucleotide binding protein (G protein), alpha transducing activity polypeptide 1 | 0 | 0 | 0 | 0 | 0 | 1 | 1 |
| 8 | KLC4 | kinesin light chain 4 | 0 | 0 | 0 | 0 | 0 | 1 | 1 |
| 9 | LACRT | lacritin | 0 | 0 | 0 | 0 | 0 | 1 | 1 |
| 10 | MSH5 | mutS homolog 5 (E. coli) | 1 | 0 | 0 | 0 | 0 | 1 | 1 |
Note:
n - number of (nonsilent) mutations in this gene across the individual set.
cos = number of unique mutated sites in this gene in COSMIC
n_cos = overlap between n and cos.
N_cos = number of individuals times cos.
cos_ev = total evidence: number of reports in COSMIC for mutations seen in this gene.
p = p-value for seeing the observed amount of overlap in this gene)
q = q-value, False Discovery Rate (Benjamini-Hochberg procedure)
Table 5. Get Full Table Genes with Clustered Mutations
| num | gene | desc | n | mindist | npairs3 | npairs12 |
|---|---|---|---|---|---|---|
| 68 | ZNF200 | zinc finger protein 200 | 3 | 7 | 0 | 2 |
| 37 | MXRA5 | matrix-remodelling associated 5 | 2 | 48 | 0 | 0 |
| 5 | B3GALT4 | UDP-Gal:betaGlcNAc beta 1,3-galactosyltransferase, polypeptide 4 | 2 | 128 | 0 | 0 |
| 55 | PCDHGB4 | protocadherin gamma subfamily B, 4 | 2 | 141 | 0 | 0 |
| 33 | MAP4K2 | mitogen-activated protein kinase kinase kinase kinase 2 | 2 | 292 | 0 | 0 |
| 38 | NISCH | nischarin | 3 | 309 | 0 | 0 |
| 63 | SYT3 | synaptotagmin III | 2 | 379 | 0 | 0 |
| 40 | NRBP1 | nuclear receptor binding protein 1 | 2 | 446 | 0 | 0 |
| 11 | C17orf81 | chromosome 17 open reading frame 81 | 3 | Inf | 0 | 0 |
| 17 | CLUAP1 | clusterin associated protein 1 | 2 | Inf | 0 | 0 |
Note:
n - number of mutations in this gene in the individual set.
mindist - distance (in aa) between closest pair of mutations in this gene
npairs3 - how many pairs of mutations are within 3 aa of each other.
npairs12 - how many pairs of mutations are within 12 aa of each other.
Table 6. Get Full Table A Ranked List of Significantly Mutated Genesets. (Source: MSigDB GSEA Cannonical Pathway Set).Number of significant genesets found: 6. Number of genesets displayed: 10
| rank | geneset | description | genes | N_genes | mut_tally | N | n | npat | nsite | nsil | n1 | n2 | n3 | n4 | n5 | p_ns_s | p | q |
|---|---|---|---|---|---|---|---|---|---|---|---|---|---|---|---|---|---|---|
| 1 | GANGLIOSIDE_BIOSYNTHESIS | B3GALT4, GALGT, SIAT4A, SIAT4B, SIAT7B, SIAT7D, SIAT9, ST3GAL1, ST3GAL2, ST3GAL4, ST3GAL5, ST6GALNAC2, ST6GALNAC4, ST8SIA1 | 1 | B3GALT4(2) | 9324 | 2 | 2 | 2 | 0 | 1 | 0 | 0 | 0 | 1 | 0.48 | 0.000033 | 0.0026 | |
| 2 | HSA00604_GLYCOSPHINGOLIPID_BIOSYNTHESIS_GANGLIOSERIES | Genes involved in glycosphingolipid biosynthesis - ganglioseries | B3GALT4, B4GALNT1, GLB1, HEXA, HEXB, LCT, SLC33A1, ST3GAL1, ST3GAL2, ST3GAL5, ST6GALNAC3, ST6GALNAC4, ST6GALNAC5, ST6GALNAC6, ST8SIA1, ST8SIA5 | 1 | B3GALT4(2) | 9324 | 2 | 2 | 2 | 0 | 1 | 0 | 0 | 0 | 1 | 0.48 | 0.000033 | 0.0026 |
| 3 | HSA04010_MAPK_SIGNALING_PATHWAY | Genes involved in MAPK signaling pathway | ACVR1B, ACVR1C, AKT1, AKT2, AKT3, ARRB1, ARRB2, ATF2, ATF4, BDNF, BRAF, CACNA1A, CACNA1B, CACNA1C, CACNA1D, CACNA1E, CACNA1F, CACNA1G, CACNA1H, CACNA1I, CACNA1S, CACNA2D1, CACNA2D2, CACNA2D3, CACNA2D4, CACNB1, CACNB2, CACNB3, CACNB4, CACNG1, CACNG2, CACNG3, CACNG4, CACNG5, CACNG6, CACNG7, CACNG8, CASP3, CD14, CDC25B, CDC42, CHP, CHUK, CRK, CRKL, DAXX, DDIT3, DUSP1, DUSP10, DUSP14, DUSP16, DUSP2, DUSP3, DUSP4, DUSP5, DUSP6, DUSP7, DUSP8, DUSP9, ECSIT, EGF, EGFR, ELK1, ELK4, EVI1, FAS, FASLG, FGF1, FGF10, FGF11, FGF12, FGF13, FGF14, FGF16, FGF17, FGF18, FGF19, FGF2, FGF20, FGF21, FGF22, FGF23, FGF3, FGF4, FGF5, FGF6, FGF7, FGF8, FGF9, FGFR1, FGFR2, FGFR3, FGFR4, FLNA, FLNB, FLNC, FOS, GADD45A, GADD45B, GADD45G, GNA12, GNG12, GRB2, HRAS, IKBKB, IKBKG, IL1A, IL1B, IL1R1, IL1R2, JUN, JUND, KRAS, LOC653852, MAP2K1, MAP2K1IP1, MAP2K2, MAP2K3, MAP2K4, MAP2K5, MAP2K6, MAP2K7, MAP3K1, MAP3K10, MAP3K12, MAP3K13, MAP3K14, MAP3K2, MAP3K3, MAP3K4, MAP3K5, MAP3K6, MAP3K7, MAP3K7IP1, MAP3K7IP2, MAP3K8, MAP4K1, MAP4K2, MAP4K3, MAP4K4, MAPK1, MAPK10, MAPK11, MAPK12, MAPK13, MAPK14, MAPK3, MAPK7, MAPK8, MAPK8IP1, MAPK8IP2, MAPK8IP3, MAPK9, MAPKAPK2, MAPKAPK3, MAPKAPK5, MAPT, MAX, MEF2C, MKNK1, MKNK2, MOS, MRAS, MYC, NF1, NFATC2, NFATC4, NFKB1, NFKB2, NGFB, NLK, NR4A1, NRAS, NTF3, NTF5, NTRK1, NTRK2, PAK1, PAK2, PDGFA, PDGFB, PDGFRA, PDGFRB, PLA2G10, PLA2G12A, PLA2G12B, PLA2G1B, PLA2G2A, PLA2G2D, PLA2G2E, PLA2G2F, PLA2G3, PLA2G4A, PLA2G5, PLA2G6, PPM1A, PPM1B, PPP3CA, PPP3CB, PPP3CC, PPP3R1, PPP3R2, PPP5C, PRKACA, PRKACB, PRKACG, PRKCA, PRKCB1, PRKCG, PRKX, PRKY, PTPN5, PTPN7, PTPRR, RAC1, RAC2, RAC3, RAF1, RAP1A, RAP1B, RAPGEF2, RASA1, RASA2, RASGRF1, RASGRF2, RASGRP1, RASGRP2, RASGRP3, RASGRP4, RPS6KA1, RPS6KA2, RPS6KA3, RPS6KA4, RPS6KA5, RPS6KA6, RRAS, RRAS2, SOS1, SOS2, SRF, STK3, STK4, STMN1, TAOK1, TAOK2, TAOK3, TGFB1, TGFB2, TGFB3, TGFBR1, TGFBR2, TNF, TNFRSF1A, TP53, TRAF2, TRAF6, ZAK | 6 | CACNG8(1), MAP4K2(2) | 58240 | 3 | 3 | 3 | 0 | 2 | 0 | 0 | 1 | 0 | 0.38 | 0.00046 | 0.023 |
| 4 | HSA01031_GLYCAN_STRUCTURES_BIOSYNTHESIS_2 | Genes involved in glycan structures - biosynthesis 2 | A4GALT, ABO, B3GALNT1, B3GALT1, B3GALT2, B3GALT4, B3GALT5, B3GNT1, B3GNT2, B3GNT3, B3GNT4, B3GNT5, B4GALNT1, B4GALT1, B4GALT2, B4GALT3, B4GALT4, B4GALT6, FUT1, FUT2, FUT3, FUT4, FUT5, FUT6, FUT7, FUT9, GBGT1, GCNT2, PIGA, PIGB, PIGC, PIGF, PIGG, PIGH, PIGK, PIGL, PIGM, PIGN, PIGO, PIGP, PIGQ, PIGS, PIGT, PIGU, PIGV, PIGX, PIGZ, ST3GAL1, ST3GAL2, ST3GAL3, ST3GAL4, ST3GAL5, ST3GAL6, ST6GALNAC3, ST6GALNAC4, ST6GALNAC5, ST6GALNAC6, ST8SIA1, ST8SIA5, UGCG, UGCGL1, UGCGL2 | 4 | B3GALT4(2), B3GNT1(1) | 82572 | 3 | 3 | 3 | 0 | 2 | 0 | 0 | 0 | 1 | 0.34 | 0.00059 | 0.023 |
| 5 | RIBOSOMAL_PROTEINS | ANK2, APG10L, RPS23, B3GALT4, CDR1, DGKI, FAU, IL6ST, KIAA1394, LOC133957, MRPL19, NET_5, PIGK, RPL10, RPL11, RPL12, RPL13, RPL13, LOC388344, RPL13A, RPL13A, LOC283340, LOC387930, RPL14, RPL14, RPL14L, RPL15, RPL15, LOC136321, LOC402694, RPL17, RPL17, dJ612B15.1, RPL18, RPL18A, LOC285053, LOC347544, LOC390354, RPL18A, LOC390354, RPL19, RPL21, RPL21, LOC387753, LOC388143, LOC388532, LOC388621, LOC389156, LOC390488, LOC402336, LOC440487, LOC440575, RPL21, LOC387753, LOC388143, LOC388532, LOC388621, LOC389156, LOC390488, LOC440487, LOC440575, RPL22, RPL23, RPL24, RPL24, SLC36A2, RPL26, LOC391126, LOC392501, LOC400055, LOC441073, LOC441533, RPL27, RPL27A, RPL27A, LOC389435, RPL28, RPL29, RPL29, LOC283412, LOC284064, LOC389655, LOC391738, LOC401911, RPL3, RPL30, RPL31, RPL32, RPL34, LOC342994, RPL35, RPL35A, RPL36, RPL37, RPL38, RPL39, RPL3L, RPL4, RPL41, RPL5, RPL5, LOC388907, RPL5, RNU66, LOC388907, RPL6, RPL7, RPL7, LOC389305, RPL7, LOC90193, LOC388401, LOC389305, LOC392550, LOC439954, RPL7A, RPL7A, LOC133748, LOC388474, RPL7A, RNU36B, LOC133748, LOC388474, RPL8, RPL9, RPLP0, RPLP0, RPLP0_like, RPLP1, RPLP2, RPS10, RPS10, LOC158104, LOC388885, LOC389127, LOC390842, LOC401817, RPS10, LOC388885, RPS11, RPS12, RPS13, RPS14, RPS15, RPS16, RPS16, LOC441876, RPS17, RPS17, LOC402057, RPS18, RPS19, RPS2, RPS2, LOC91561, LOC148430, LOC286444, LOC400963, LOC440589, RPS20, RPS21, RPS23, RPS24, RPS25, RPS26, RPS26L, LOC440440, RPS27, RPS27A, RPS27A, LOC388720, LOC389425, RPS28, RPS29, RPS3, RPS3A, RPS3A, LOC146053, LOC400652, LOC401016, LOC439992, RPS4X, RPS4Y1, RPS5, RPS6, RPS6KA1, RPS6KA2, RPS6KA3, RPS6KA6, RPS6KB1, RPS6KB2, RPS7, RPS8, RPS9, RPSA, LOC388524, LOC388654, SCDR10, TBC1D10C, TSPAN9, UBA52, UBB, UBC | 7 | B3GALT4(2) | 46032 | 2 | 2 | 2 | 0 | 1 | 0 | 0 | 0 | 1 | 0.52 | 0.0011 | 0.035 | |
| 6 | OVARIAN_INFERTILITY_GENES | ATM, BMPR1B, CCND2, CDK4, CDKN1B, CEBPB, DAZL, DMC1, EGR1, ESR2, FSHR, GJA4, INHA, LHCGR, MLH1, MSH5, NCOR1, NR5A1, NRIP1, PGR, PRLR, PTGER2, SMPD1, VDR, ZP2 | 1 | MSH5(1) | 20804 | 1 | 1 | 1 | 1 | 0 | 0 | 1 | 0 | 0 | 0.93 | 0.0032 | 0.085 | |
| 7 | HSA02010_ABC_TRANSPORTERS_GENERAL | Genes involved in ABC transporters - general | ABCA1, ABCA10, ABCA12, ABCA13, ABCA2, ABCA3, ABCA4, ABCA5, ABCA6, ABCA7, ABCA8, ABCA9, ABCB1, ABCB10, ABCB11, ABCB4, ABCB5, ABCB6, ABCB7, ABCB8, ABCB9, ABCC1, ABCC10, ABCC11, ABCC12, ABCC2, ABCC3, ABCC4, ABCC5, ABCC6, ABCC8, ABCC9, ABCD1, ABCD2, ABCD3, ABCD4, ABCG1, ABCG2, ABCG4, ABCG5, ABCG8, CFTR, TAP1, TAP2 | 1 | ABCC10(1) | 32872 | 1 | 1 | 1 | 0 | 0 | 0 | 1 | 0 | 0 | 0.68 | 0.0049 | 0.11 |
| 8 | HSA04330_NOTCH_SIGNALING_PATHWAY | Genes involved in Notch signaling pathway | ADAM17, APH1A, CIR, CREBBP, CTBP1, CTBP2, DLL1, DLL3, DLL4, DTX1, DTX2, DTX3, DTX3L, DTX4, DVL1, DVL2, DVL3, EP300, GCN5L2, HDAC1, HDAC2, HES1, JAG1, JAG2, LFNG, LOC652788, MAML1, MAML2, MAML3, MFNG, NCOR2, NCSTN, NOTCH1, NOTCH2, NOTCH3, NOTCH4, NUMB, NUMBL, PCAF, PSEN1, PSEN2, PSENEN, PTCRA, RBPJ, RBPJL, RFNG, SNW1 | 3 | RBPJL(1) | 62580 | 1 | 1 | 1 | 0 | 0 | 0 | 0 | 1 | 0 | 0.84 | 0.011 | 0.22 |
| 9 | HSA00533_KERATAN_SULFATE_BIOSYNTHESIS | Genes involved in keratan sulfate biosynthesis | B3GNT1, B3GNT2, B3GNT7, B4GALT1, B4GALT2, B4GALT3, B4GALT4, CHST1, CHST2, CHST4, CHST6, FUT8, ST3GAL1, ST3GAL2, ST3GAL3, ST3GAL4 | 1 | B3GNT1(1) | 14504 | 1 | 1 | 1 | 0 | 1 | 0 | 0 | 0 | 0 | 0.69 | 0.03 | 0.4 |
| 10 | KERATAN_SULFATE_BIOSYNTHESIS | B3GNT1, B4GALT1, B4GALT2, B4GALT3, B4GALT5, FUT8, SIAT4A, SIAT4B, SIAT6, ST3GAL1, ST3GAL2, ST3GAL3, ST3GAL4 | 1 | B3GNT1(1) | 14504 | 1 | 1 | 1 | 0 | 1 | 0 | 0 | 0 | 0 | 0.69 | 0.03 | 0.4 |
Table 7. Get Full Table A Ranked List of Significantly Mutated Genesets (Excluding Significantly Mutated Genes). Number of significant genesets found: 0. Number of genesets displayed: 10
| rank | geneset | description | genes | N_genes | mut_tally | N | n | npat | nsite | nsil | n1 | n2 | n3 | n4 | n5 | p_ns_s | p | q |
|---|---|---|---|---|---|---|---|---|---|---|---|---|---|---|---|---|---|---|
| 1 | HSA00533_KERATAN_SULFATE_BIOSYNTHESIS | Genes involved in keratan sulfate biosynthesis | B3GNT1, B3GNT2, B3GNT7, B4GALT1, B4GALT2, B4GALT3, B4GALT4, CHST1, CHST2, CHST4, CHST6, FUT8, ST3GAL1, ST3GAL2, ST3GAL3, ST3GAL4 | 1 | B3GNT1(1) | 14504 | 1 | 1 | 1 | 0 | 1 | 0 | 0 | 0 | 0 | 0.69 | 0.03 | 1 |
| 2 | KERATAN_SULFATE_BIOSYNTHESIS | B3GNT1, B4GALT1, B4GALT2, B4GALT3, B4GALT5, FUT8, SIAT4A, SIAT4B, SIAT6, ST3GAL1, ST3GAL2, ST3GAL3, ST3GAL4 | 1 | B3GNT1(1) | 14504 | 1 | 1 | 1 | 0 | 1 | 0 | 0 | 0 | 0 | 0.69 | 0.03 | 1 | |
| 3 | MAPKPATHWAY | The mitogen-activated protein (MAP) kinase pathway is a common signaling mechanism and has four main sub-pathways: Erk, JNK/SAPK, p53, and ERK5. | ARAF1, ATF2, BRAF, CEBPA, CHUK, CREB1, DAXX, ELK1, FOS, GRB2, HRAS, IKBKB, JUN, MAP2K1, MAP2K2, MAP2K3, MAP2K4, MAP2K5, MAP2K6, MAP2K7, MAP3K1, MAP3K10, MAP3K11, MAP3K12, MAP3K13, MAP3K14, MAP3K2, MAP3K3, MAP3K4, MAP3K5, MAP3K6, MAP3K7, MAP3K8, MAP3K9, MAP4K1, MAP4K2, MAP4K3, MAP4K4, MAP4K5, MAPK1, MAPK10, MAPK11, MAPK12, MAPK13, MAPK14, MAPK3, MAPK4, MAPK6, MAPK7, MAPK8, MAPK9, MAPKAPK2, MAPKAPK3, MAPKAPK5, MAX, MEF2A, MEF2B, MEF2C, MEF2D, MKNK1, MKNK2, MYC, NFKB1, NFKBIA, PAK1, PAK2, PDZGEF1, RAC1, RAF1, RELA, RIPK1, RPS6KA1, RPS6KA2, RPS6KA3, RPS6KA4, RPS6KA5, RPS6KB1, RPS6KB2, SHC1, SP1, STAT1, TGFB1, TGFB2, TGFB3, TGFBR1, TRADD, TRAF2 | 1 | MAP4K2(2) | 19852 | 2 | 2 | 2 | 0 | 2 | 0 | 0 | 0 | 0 | 0.4 | 0.031 | 1 |
| 4 | STRESSPATHWAY | Tumor necrosis factor receptor TNFR1 promotes apoptosis and activates the pro-inflammatory NF-kB, while TNFR2 activates stress-activated protein kinases (SAPKs). | ATF1, CASP2, CHUK, CRADD, IKBKB, IKBKG, JUN, LTA, MAP2K3, MAP2K4, MAP2K6, MAP3K1, MAP3K14, MAP4K2, MAPK14, MAPK8, NFKB1, NFKBIA, RELA, RIPK1, TANK, TNF, TNFRSF1A, TRADD, TRAF2 | 1 | MAP4K2(2) | 19852 | 2 | 2 | 2 | 0 | 2 | 0 | 0 | 0 | 0 | 0.4 | 0.031 | 1 |
| 5 | ST_ADRENERGIC | Adrenergic receptors respond to epinephrine and norepinephrine signaling. | AKT1, APC, AR, ASAH1, BF, BRAF, CAMP, CCL13, CCL15, CCL16, DAG1, EGFR, GAS, GNA11, GNA15, GNAI1, GNAQ, ITPKA, ITPKB, ITPR1, ITPR2, ITPR3, KCNJ3, KCNJ5, KCNJ9, MAPK1, MAPK10, MAPK14, PHKA2, PIK3CA, PIK3CD, PIK3R1, PITX2, PTX1, PTX3, RAF1, SRC | 1 | CCL15(1) | 4732 | 1 | 1 | 1 | 0 | 1 | 0 | 0 | 0 | 0 | 0.61 | 0.051 | 1 |
| 6 | HSA01030_GLYCAN_STRUCTURES_BIOSYNTHESIS_1 | Genes involved in glycan structures - biosynthesis 1 | A4GNT, ALG1, ALG10, ALG10B, ALG11, ALG12, ALG13, ALG14, ALG2, ALG3, ALG6, ALG8, ALG9, B3GALT6, B3GNT1, B3GNT2, B3GNT6, B3GNT7, B4GALT1, B4GALT2, B4GALT3, B4GALT4, B4GALT5, B4GALT7, C1GALT1, C1GALT1C1, ChGn, CHPF, CHST1, CHST11, CHST12, CHST13, CHST14, CHST2, CHST3, CHST4, CHST6, CHST7, CHSY-2, CHSY1, CSGlcA-T, DAD1, DDOST, DPAGT1, EXT1, EXT2, EXTL1, EXTL2, EXTL3, FUT11, FUT8, GALNAC4S-6ST, GALNACT-2, GALNT1, GALNT10, GALNT11, GALNT12, GALNT13, GALNT14, GALNT17, GALNT2, GALNT3, GALNT4, GALNT5, GALNT6, GALNT7, GALNT8, GALNT9, GALNTL1, GALNTL2, GALNTL4, GALNTL5, GANAB, GCNT1, GCNT3, GCNT4, GCS1, HS2ST1, HS3ST1, HS3ST2, HS3ST3A1, HS3ST3B1, HS3ST5, HS6ST1, HS6ST2, HS6ST3, LOC728969, MAN1A1, MAN1A2, MAN1B1, MAN1C1, MAN2A1, MGAT1, MGAT2, MGAT3, MGAT4A, MGAT4B, MGAT5, MGAT5B, NDST1, NDST2, NDST3, NDST4, OGT, RPN1, RPN2, ST3GAL1, ST3GAL2, ST3GAL3, ST3GAL4, ST6GAL1, ST6GALNAC1, STT3B, UST, WBSCR17, XYLT1, XYLT2 | 2 | B3GNT1(1) | 22008 | 1 | 1 | 1 | 0 | 1 | 0 | 0 | 0 | 0 | 0.71 | 0.062 | 1 |
| 7 | GLYOXYLATE_AND_DICARBOXYLATE_METABOLISM | ACO1, ACO2, CS, GRHPR, HAO1, HAO2, HYI, MDH1, MDH2, MTHFD1, MTHFD1L, MTHFD2 | 1 | GRHPR(1) | 7924 | 1 | 1 | 1 | 0 | 1 | 0 | 0 | 0 | 0 | 0.61 | 0.11 | 1 | |
| 8 | HSA00620_PYRUVATE_METABOLISM | Genes involved in pyruvate metabolism | ACACA, ACACB, ACAT1, ACAT2, ACOT12, ACSS1, ACSS2, ACYP1, ACYP2, AKR1B1, ALDH1A3, ALDH1B1, ALDH2, ALDH3A1, ALDH3A2, ALDH7A1, ALDH9A1, DLAT, DLD, GLO1, GRHPR, HAGH, HAGHL, LDHA, LDHAL6A, LDHAL6B, LDHB, LDHC, LDHD, MDH1, MDH2, ME1, ME2, ME3, PC, PCK1, PCK2, PDHA1, PDHA2, PDHB, PKLR, PKM2 | 1 | GRHPR(1) | 7924 | 1 | 1 | 1 | 0 | 1 | 0 | 0 | 0 | 0 | 0.61 | 0.11 | 1 |
| 9 | HSA00630_GLYOXYLATE_AND_DICARBOXYLATE_METABOLISM | Genes involved in glyoxylate and dicarboxylate metabolism | ACO1, ACO2, AFMID, CS, GRHPR, HAO1, HAO2, HYI, LOC441996, MDH1, MDH2, MTHFD1, MTHFD1L, MTHFD2 | 1 | GRHPR(1) | 7924 | 1 | 1 | 1 | 0 | 1 | 0 | 0 | 0 | 0 | 0.61 | 0.11 | 1 |
| 10 | PYRUVATE_METABOLISM | ACACA, ACAS2, ACAS2L, ACAT1, ACAT2, ACYP1, ACYP2, ADH5, AKR1B1, ALDH1A1, ALDH1A2, ALDH1A3, ALDH1B1, ALDH2, ALDH3A1, ALDH3A2, ALDH9A1, CACH_1, DLAT, DLD, GLO1, GRHPR, HAGH, HAGHL, LDHA, LDHB, LDHC, LDHD, MDH1, MDH2, ME1, ME2, ME3, PC, PCK1, PDHA1, PDHA2, PDHB, PKLR, PKM2 | 1 | GRHPR(1) | 7924 | 1 | 1 | 1 | 0 | 1 | 0 | 0 | 0 | 0 | 0.61 | 0.11 | 1 |
In brief, we tabulate the number of mutations and the number of covered bases for each gene. The counts are broken down by mutation context category: four context categories that are discovered by MutSig, and one for indel and 'null' mutations, which include indels, nonsense mutations, splice-site mutations, and non-stop (read-through) mutations. For each gene, we calculate the probability of seeing the observed constellation of mutations, i.e. the product P1 x P2 x ... x Pm, or a more extreme one, given the background mutation rates calculated across the dataset.[1]
This is an experimental feature. The full results of the analysis summarized in this report can be downloaded from the TCGA Data Coordination Center.