This pipeline uses various statistical tests to identify mRNAs whose expression levels correlated to selected clinical features.
Testing the association between 17814 genes and 5 clinical features across 529 samples, statistically thresholded by Q value < 0.05, 5 clinical features related to at least one genes.
-
2 genes correlated to 'Time to Death'.
-
RPS26 , PPP1R14D
-
386 genes correlated to 'AGE'.
-
ESR1 , CNTNAP3 , FOXD2 , KLK6 , NUDT16 , ...
-
6 genes correlated to 'GENDER'.
-
PI3 , TMEM16C , CACNG1 , RP13-36C9.6 , MAPK4 , ...
-
3 genes correlated to 'RADIATIONS.RADIATION.REGIMENINDICATION'.
-
OR13C4 , TMEM92 , CYP3A5
-
11 genes correlated to 'NEOADJUVANT.THERAPY'.
-
ZCCHC7 , DUSP1 , MGC33407 , C2ORF60 , EGR1 , ...
Complete statistical result table is provided in Supplement Table 1
Table 1. Get Full Table This table shows the clinical features, statistical methods used, and the number of genes that are significantly associated with each clinical feature at Q value < 0.05.
| Clinical feature | Statistical test | Significant genes | Associated with | Associated with | ||
|---|---|---|---|---|---|---|
| Time to Death | Cox regression test | N=2 | shorter survival | N=2 | longer survival | N=0 |
| AGE | Spearman correlation test | N=386 | older | N=188 | younger | N=198 |
| GENDER | t test | N=6 | male | N=1 | female | N=5 |
| RADIATIONS RADIATION REGIMENINDICATION | t test | N=3 | yes | N=3 | no | N=0 |
| NEOADJUVANT THERAPY | t test | N=11 | yes | N=4 | no | N=7 |
Table S1. Basic characteristics of clinical feature: 'Time to Death'
| Time to Death | Duration (Months) | 0.1-223.4 (median=24.1) |
| censored | N = 432 | |
| death | N = 65 | |
| Significant markers | N = 2 | |
| associated with shorter survival | 2 | |
| associated with longer survival | 0 |
Table S2. Get Full Table List of 2 genes significantly associated with 'Time to Death' by Cox regression test
| HazardRatio | Wald_P | Q | C_index | |
|---|---|---|---|---|
| RPS26 | 2.7 | 9.865e-08 | 0.0018 | 0.682 |
| PPP1R14D | 2.3 | 2.637e-07 | 0.0047 | 0.593 |
Figure S1. Get High-res Image As an example, this figure shows the association of RPS26 to 'Time to Death'. four curves present the cumulative survival rates of 4 quartile subsets of patients. P value = 9.87e-08 with univariate Cox regression analysis using continuous log-2 expression values.
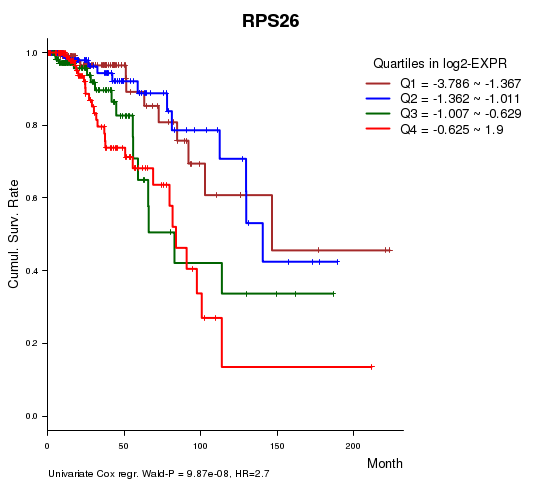
Table S3. Basic characteristics of clinical feature: 'AGE'
| AGE | Mean (SD) | 57.89 (13) |
| Significant markers | N = 386 | |
| pos. correlated | 188 | |
| neg. correlated | 198 |
Table S4. Get Full Table List of top 10 genes significantly correlated to 'AGE' by Spearman correlation test
| SpearmanCorr | corrP | Q | |
|---|---|---|---|
| ESR1 | 0.414 | 2.515e-23 | 4.48e-19 |
| CNTNAP3 | -0.2907 | 9.302e-12 | 1.66e-07 |
| FOXD2 | 0.289 | 1.233e-11 | 2.2e-07 |
| KLK6 | -0.2889 | 1.247e-11 | 2.22e-07 |
| NUDT16 | 0.2875 | 1.591e-11 | 2.83e-07 |
| MAGED4B | -0.2858 | 2.117e-11 | 3.77e-07 |
| KRT17 | -0.2842 | 2.751e-11 | 4.9e-07 |
| MFGE8 | -0.2842 | 2.763e-11 | 4.92e-07 |
| SYT8 | -0.2838 | 2.942e-11 | 5.24e-07 |
| PHOSPHO2 | 0.2791 | 6.34e-11 | 1.13e-06 |
Figure S2. Get High-res Image As an example, this figure shows the association of ESR1 to 'AGE'. P value = 2.51e-23 with Spearman correlation analysis. The straight line presents the best linear regression.
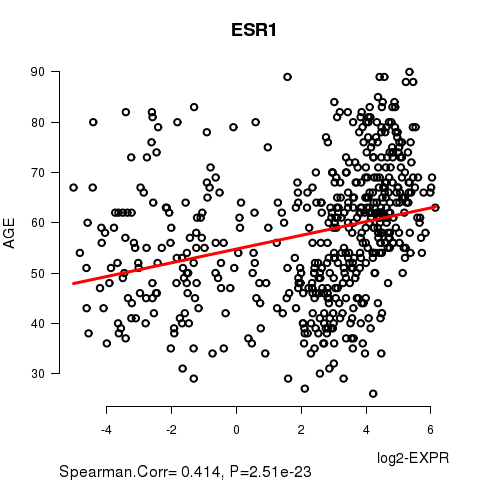
Table S5. Basic characteristics of clinical feature: 'GENDER'
| GENDER | Labels | N |
| FEMALE | 523 | |
| MALE | 6 | |
| Significant markers | N = 6 | |
| Higher in MALE | 1 | |
| Higher in FEMALE | 5 |
Table S6. Get Full Table List of 6 genes differentially expressed by 'GENDER'
| T(pos if higher in 'MALE') | ttestP | Q | AUC | |
|---|---|---|---|---|
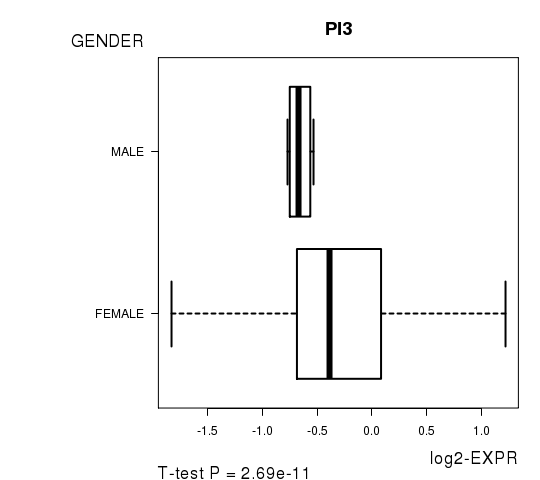
| PI3 | -9.33 | 2.686e-11 | 4.79e-07 | 0.7129 |
| TMEM16C | -14.29 | 1.571e-10 | 2.8e-06 | 0.9261 |
| CACNG1 | 18.46 | 1.712e-08 | 0.000305 | 0.9614 |
| RP13-36C9.6 | -6.29 | 6.462e-07 | 0.0115 | 0.6651 |
| MAPK4 | -9.13 | 1.424e-06 | 0.0254 | 0.8011 |
| PLA2G3 | -10.66 | 1.754e-06 | 0.0312 | 0.8311 |
Figure S3. Get High-res Image As an example, this figure shows the association of PI3 to 'GENDER'. P value = 2.69e-11 with T-test analysis.
3 genes related to 'RADIATIONS.RADIATION.REGIMENINDICATION'.
Table S7. Basic characteristics of clinical feature: 'RADIATIONS.RADIATION.REGIMENINDICATION'
| RADIATIONS.RADIATION.REGIMENINDICATION | Labels | N |
| NO | 147 | |
| YES | 382 | |
| Significant markers | N = 3 | |
| Higher in YES | 3 | |
| Higher in NO | 0 |
Table S8. Get Full Table List of 3 genes differentially expressed by 'RADIATIONS.RADIATION.REGIMENINDICATION'
| T(pos if higher in 'YES') | ttestP | Q | AUC | |
|---|---|---|---|---|
| OR13C4 | 5.11 | 6.374e-07 | 0.0114 | 0.63 |
| TMEM92 | 4.98 | 9.615e-07 | 0.0171 | 0.6099 |
| CYP3A5 | 4.96 | 1.028e-06 | 0.0183 | 0.5852 |
Figure S4. Get High-res Image As an example, this figure shows the association of OR13C4 to 'RADIATIONS.RADIATION.REGIMENINDICATION'. P value = 6.37e-07 with T-test analysis.
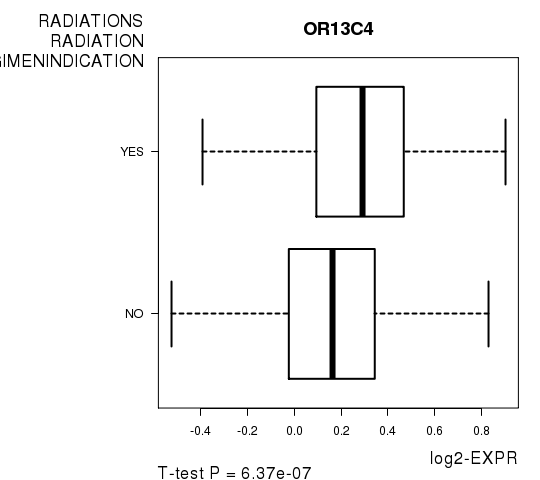
Table S9. Basic characteristics of clinical feature: 'NEOADJUVANT.THERAPY'
| NEOADJUVANT.THERAPY | Labels | N |
| NO | 222 | |
| YES | 307 | |
| Significant markers | N = 11 | |
| Higher in YES | 4 | |
| Higher in NO | 7 |
Table S10. Get Full Table List of top 10 genes differentially expressed by 'NEOADJUVANT.THERAPY'
| T(pos if higher in 'YES') | ttestP | Q | AUC | |
|---|---|---|---|---|
| ZCCHC7 | -5.69 | 2.257e-08 | 0.000402 | 0.6386 |
| DUSP1 | -5.44 | 8.342e-08 | 0.00149 | 0.6338 |
| MGC33407 | 5.39 | 1.153e-07 | 0.00205 | 0.6353 |
| C2ORF60 | 5.27 | 2.134e-07 | 0.0038 | 0.6198 |
| EGR1 | -5.21 | 2.787e-07 | 0.00496 | 0.6271 |
| RGS1 | -5.18 | 3.138e-07 | 0.00559 | 0.6152 |
| FOS | -5.09 | 5.13e-07 | 0.00914 | 0.6225 |
| EED | 5.06 | 5.964e-07 | 0.0106 | 0.6081 |
| OR13C4 | 5.03 | 7.065e-07 | 0.0126 | 0.6202 |
| JUN | -4.92 | 1.205e-06 | 0.0215 | 0.6195 |
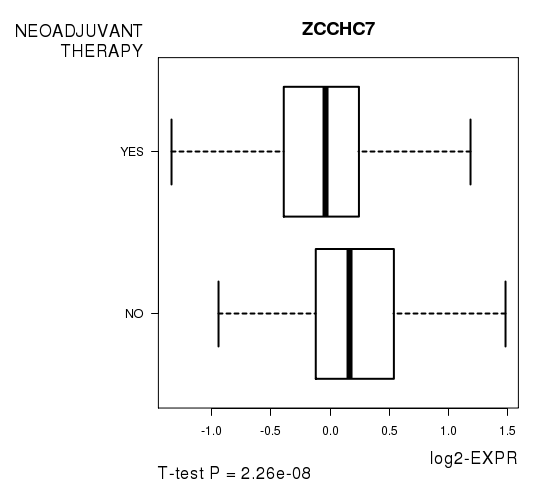
Figure S5. Get High-res Image As an example, this figure shows the association of ZCCHC7 to 'NEOADJUVANT.THERAPY'. P value = 2.26e-08 with T-test analysis.
-
Expresson data file = BRCA.medianexp.txt
-
Clinical data file = BRCA.clin.merged.picked.txt
-
Number of patients = 529
-
Number of genes = 17814
-
Number of clinical features = 5
For survival clinical features, Wald's test in univariate Cox regression analysis with proportional hazards model (Andersen and Gill 1982) was used to estimate the P values using the 'coxph' function in R. Kaplan-Meier survival curves were plot using the four quartile subgroups of patients based on expression levels
For continuous numerical clinical features, Spearman's rank correlation coefficients (Spearman 1904) and two-tailed P values were estimated using 'cor.test' function in R
For two-class clinical features, two-tailed Student's t test with unequal variance (Lehmann and Romano 2005) was applied to compare the log2-expression levels between the two clinical classes using 't.test' function in R
For multiple hypothesis correction, Q value is the False Discovery Rate (FDR) analogue of the P value (Benjamini and Hochberg 1995), defined as the minimum FDR at which the test may be called significant. We used the 'Benjamini and Hochberg' method of 'p.adjust' function in R to convert P values into Q values.
This is an experimental feature. The full results of the analysis summarized in this report can be downloaded from the TCGA Data Coordination Center.