This report serves to describe the mutational landscape and properties of a given individual set, as well as rank genes and genesets according to mutational significance. MutSig v1.5 was used to generate the results found in this report.
Working with individual set: BRCA.
Number of patients in set: 507
The input for this pipeline is a set of individuals with the following files associated for each:
1. An annotated .maf file describing the mutations called for the respective individual, and their properties.
2. A .wig file that contains information about the coverage of the sample.
Significantly mutated genes (q ≤ 0.1): 68
Mutations seen in COSMIC: 9
Significantly mutated genes in COSMIC territory: 1
Genes with clustered mutations (&le 3 aa apart): 16
Significantly mutated genesets: 84
Significantly mutated genesets: (excluding sig. mutated genes): 0
Table 1. Get Full Table Table representing breakdown of mutations by type.
| type | count |
|---|---|
| Frame_Shift_Del | 37 |
| Frame_Shift_Ins | 7 |
| In_Frame_Del | 16 |
| In_Frame_Ins | 2 |
| Indel | 2 |
| Missense_Mutation | 714 |
| Nonsense_Mutation | 41 |
| Nonstop_Mutation | 2 |
| Silent | 302 |
| Splice_Site | 21 |
| Total | 1144 |
Table 2. Get Full Table A breakdown of mutation rates per category discovered for this individual set.
| category | n | N | rate | rate_per_mb | relative_rate | exp_ns_s_ratio |
|---|---|---|---|---|---|---|
| *CpG->T | 174 | 19606704 | 8.9e-06 | 8.9 | 2.6 | 2 |
| *Cp(A/C/T)->T | 146 | 120962595 | 1.2e-06 | 1.2 | 0.36 | 1.5 |
| C->(G/A) | 264 | 140569299 | 1.9e-06 | 1.9 | 0.56 | 3.9 |
| A->mut | 130 | 108766203 | 1.2e-06 | 1.2 | 0.35 | 4.2 |
| indel+null | 122 | 249335502 | 4.9e-07 | 0.49 | 0.14 | NaN |
| double_null | 6 | 249335502 | 2.4e-08 | 0.024 | 0.0071 | NaN |
| Total | 842 | 249335502 | 3.4e-06 | 3.4 | 1 | 3.3 |
The x axis represents the samples. The y axis represents the exons, one row per exon, and they are sorted by average coverage across samples. For exons with exactly the same average coverage, they are sorted next by the %GC of the exon. (The secondary sort is especially useful for the zero-coverage exons at the bottom).
Figure 1.
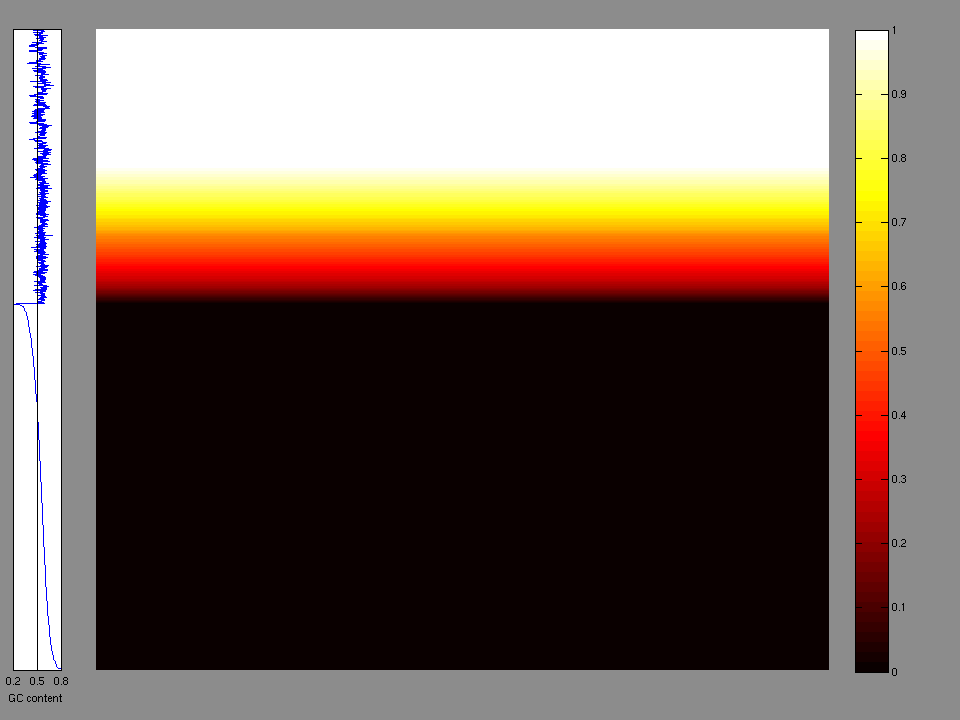
Figure 2.
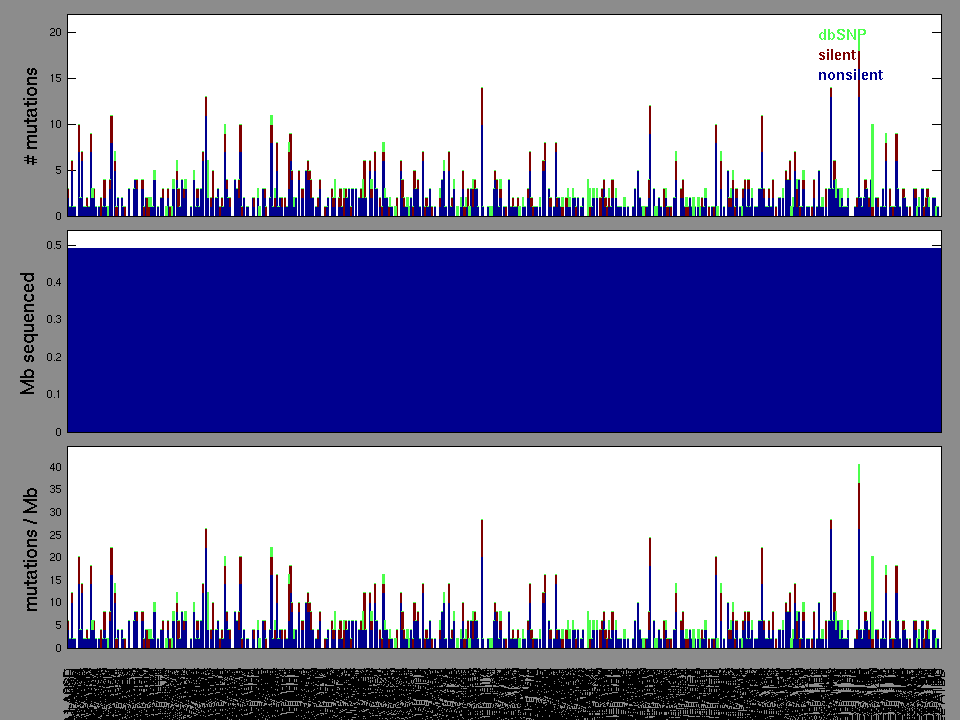
Table 3. Get Full Table A Ranked List of Significantly Mutated Genes. Number of significant genes found: 68. Number of genes displayed: 35
| rank | gene | description | N | n | npat | nsite | nsil | n1 | n2 | n3 | n4 | n5 | n6 | p_ns_s | p | q |
|---|---|---|---|---|---|---|---|---|---|---|---|---|---|---|---|---|
| 1 | ERBB3 | v-erb-b2 erythroblastic leukemia viral oncogene homolog 3 (avian) | 563277 | 9 | 9 | 9 | 0 | 0 | 1 | 5 | 2 | 1 | 0 | 0.092 | 1.3e-11 | 1.2e-08 |
| 2 | SHD | Src homology 2 domain containing transforming protein D | 150579 | 6 | 6 | 5 | 0 | 1 | 1 | 2 | 2 | 0 | 0 | 0.21 | 2.8e-10 | 1.2e-07 |
| 3 | ATN1 | atrophin 1 | 770640 | 8 | 8 | 6 | 1 | 0 | 3 | 1 | 0 | 4 | 0 | 0.49 | 4.2e-10 | 1.2e-07 |
| 4 | VASN | vasorin | 381771 | 6 | 6 | 3 | 0 | 0 | 0 | 1 | 4 | 1 | 0 | 0.41 | 9.6e-09 | 2.1e-06 |
| 5 | TLN1 | talin 1 | 1514409 | 9 | 9 | 9 | 1 | 1 | 1 | 3 | 1 | 3 | 0 | 0.41 | 4.2e-08 | 7.4e-06 |
| 6 | ERBB2 | v-erb-b2 erythroblastic leukemia viral oncogene homolog 2, neuro/glioblastoma derived oncogene homolog (avian) | 500409 | 8 | 7 | 6 | 1 | 2 | 0 | 3 | 3 | 0 | 0 | 0.37 | 2.8e-07 | 0.000041 |
| 7 | ZCWPW1 | zinc finger, CW type with PWWP domain 1 | 320424 | 4 | 4 | 4 | 0 | 0 | 0 | 2 | 0 | 2 | 0 | 0.5 | 4e-06 | 0.0005 |
| 8 | FAM169A | 319917 | 4 | 4 | 4 | 0 | 0 | 0 | 1 | 0 | 3 | 0 | 0.72 | 4.6e-06 | 0.0005 | |
| 9 | PDCD11 | programmed cell death 11 | 753402 | 6 | 6 | 6 | 1 | 1 | 1 | 2 | 1 | 1 | 0 | 0.37 | 0.000019 | 0.0018 |
| 10 | PRPF38B | PRP38 pre-mRNA processing factor 38 (yeast) domain containing B | 278343 | 4 | 4 | 4 | 0 | 0 | 0 | 2 | 1 | 1 | 0 | 0.61 | 0.000029 | 0.0026 |
| 11 | FAM58A | family with sequence similarity 58, member A | 137397 | 3 | 3 | 3 | 0 | 0 | 1 | 0 | 0 | 2 | 0 | 0.21 | 0.000085 | 0.0067 |
| 12 | AQP7 | aquaporin 7 | 147030 | 3 | 3 | 3 | 0 | 1 | 0 | 0 | 1 | 1 | 0 | 0.46 | 0.0001 | 0.0075 |
| 13 | HLA-C | major histocompatibility complex, class I, C | 175422 | 3 | 3 | 3 | 1 | 0 | 1 | 1 | 1 | 0 | 0 | 0.68 | 0.00012 | 0.0083 |
| 14 | KIFC1 | kinesin family member C1 | 488241 | 5 | 5 | 5 | 0 | 0 | 1 | 4 | 0 | 0 | 0 | 0.26 | 0.00015 | 0.0096 |
| 15 | SPINT3 | serine peptidase inhibitor, Kunitz type, 3 | 79092 | 2 | 2 | 2 | 0 | 0 | 0 | 1 | 0 | 1 | 0 | 0.78 | 0.00017 | 0.0099 |
| 16 | HIST1H3B | histone cluster 1, H3b | 172380 | 4 | 4 | 4 | 0 | 0 | 2 | 1 | 0 | 1 | 0 | 0.22 | 0.00023 | 0.012 |
| 17 | CAD | carbamoyl-phosphate synthetase 2, aspartate transcarbamylase, and dihydroorotase | 1563588 | 7 | 7 | 7 | 0 | 0 | 3 | 3 | 0 | 1 | 0 | 0.063 | 0.00023 | 0.012 |
| 18 | DHRS2 | dehydrogenase/reductase (SDR family) member 2 | 188097 | 3 | 3 | 3 | 0 | 1 | 0 | 0 | 1 | 1 | 0 | 0.54 | 0.00027 | 0.013 |
| 19 | KRT28 | keratin 28 | 218010 | 3 | 3 | 3 | 0 | 1 | 0 | 2 | 0 | 0 | 0 | 0.39 | 0.00036 | 0.016 |
| 20 | KLC4 | kinesin light chain 4 | 416754 | 4 | 4 | 4 | 0 | 1 | 1 | 0 | 1 | 1 | 0 | 0.39 | 0.00039 | 0.016 |
| 21 | FCRL1 | Fc receptor-like 1 | 291525 | 3 | 3 | 3 | 0 | 0 | 2 | 1 | 0 | 0 | 0 | 0.32 | 0.00039 | 0.016 |
| 22 | DLGAP4 | discs, large (Drosophila) homolog-associated protein 4 | 401544 | 6 | 6 | 6 | 0 | 3 | 2 | 1 | 0 | 0 | 0 | 0.11 | 0.00045 | 0.018 |
| 23 | NKTR | natural killer-tumor recognition sequence | 591669 | 3 | 3 | 3 | 0 | 0 | 0 | 1 | 2 | 0 | 0 | 0.54 | 0.00051 | 0.019 |
| 24 | ACADSB | acyl-Coenzyme A dehydrogenase, short/branched chain | 185562 | 3 | 3 | 3 | 0 | 0 | 2 | 0 | 1 | 0 | 0 | 0.39 | 0.00053 | 0.019 |
| 25 | ZNF473 | zinc finger protein 473 | 495846 | 3 | 3 | 3 | 0 | 0 | 0 | 2 | 1 | 0 | 0 | 0.59 | 0.00054 | 0.019 |
| 26 | C17orf68 | chromosome 17 open reading frame 68 | 497874 | 3 | 3 | 3 | 1 | 0 | 0 | 1 | 1 | 1 | 0 | 0.89 | 0.0006 | 0.02 |
| 27 | CA9 | carbonic anhydrase IX | 308763 | 3 | 3 | 3 | 0 | 0 | 0 | 3 | 0 | 0 | 0 | 0.55 | 0.00066 | 0.021 |
| 28 | MYH4 | myosin, heavy chain 4, skeletal muscle | 1015521 | 6 | 6 | 6 | 1 | 3 | 0 | 1 | 1 | 1 | 0 | 0.67 | 0.00067 | 0.021 |
| 29 | ZNF296 | 232713 | 3 | 3 | 3 | 0 | 1 | 0 | 1 | 0 | 1 | 0 | 0.56 | 0.0007 | 0.021 | |
| 30 | GLYR1 | 293553 | 3 | 3 | 3 | 0 | 1 | 0 | 0 | 0 | 2 | 0 | 0.64 | 0.00071 | 0.021 | |
| 31 | OR6C2 | olfactory receptor, family 6, subfamily C, member 2 | 204828 | 2 | 2 | 2 | 1 | 0 | 0 | 0 | 1 | 1 | 0 | 0.9 | 0.00073 | 0.021 |
| 32 | PCDHGA9 | protocadherin gamma subfamily A, 9 | 484185 | 3 | 3 | 3 | 1 | 0 | 0 | 0 | 0 | 3 | 0 | 0.93 | 0.00077 | 0.021 |
| 33 | USF1 | upstream transcription factor 1 | 139932 | 2 | 2 | 2 | 0 | 0 | 0 | 1 | 0 | 1 | 0 | 0.68 | 0.00082 | 0.022 |
| 34 | DNAH2 | dynein, axonemal, heavy chain 2 | 1809483 | 11 | 10 | 11 | 2 | 3 | 0 | 3 | 4 | 1 | 0 | 0.37 | 0.00092 | 0.024 |
| 35 | RBPJL | recombination signal binding protein for immunoglobulin kappa J region-like | 375687 | 4 | 4 | 4 | 0 | 1 | 0 | 2 | 0 | 1 | 0 | 0.29 | 0.00098 | 0.024 |
Note:
N - number of sequenced bases in this gene across the individual set.
n - number of (nonsilent) mutations in this gene across the individual set.
npat - number of patients (individuals) with at least one nonsilent mutation.
nsite - number of unique sites having a non-silent mutation.
nsil - number of silent mutations in this gene across the individual set.
n1 - number of nonsilent mutations of type: *CpG->T .
n2 - number of nonsilent mutations of type: *Cp(A/C/T)->T .
n3 - number of nonsilent mutations of type: C->(G/A) .
n4 - number of nonsilent mutations of type: A->mut .
n5 - number of nonsilent mutations of type: indel+null .
null - mutation category that includes nonsense, frameshift, splice-site mutations
p_classic = p-value for the observed amount of nonsilent mutations being elevated in this gene
p_ns_s = p-value for the observed nonsilent/silent ratio being elevated in this gene
p = p-value (overall)
q = q-value, False Discovery Rate (Benjamini-Hochberg procedure)
In this analysis, COSMIC is used as a filter to increase power by restricting the territory of each gene. Cosmic version: v48.
Table 4. Get Full Table Significantly mutated genes (COSMIC territory only). To access the database please go to: COSMIC. Number of significant genes found: 1. Number of genes displayed: 10
| rank | gene | description | n | cos | n_cos | N_cos | cos_ev | p | q |
|---|---|---|---|---|---|---|---|---|---|
| 1 | ERBB2 | v-erb-b2 erythroblastic leukemia viral oncogene homolog 2, neuro/glioblastoma derived oncogene homolog (avian) | 8 | 41 | 6 | 20787 | 44 | 1.6e-10 | 2.4e-08 |
| 2 | RAB43 | RAB43, member RAS oncogene family | 1 | 1 | 1 | 507 | 1 | 0.0017 | 0.13 |
| 3 | MEN1 | multiple endocrine neoplasia I | 2 | 207 | 2 | 104949 | 17 | 0.05 | 1 |
| 4 | ABCC10 | ATP-binding cassette, sub-family C (CFTR/MRP), member 10 | 3 | 0 | 0 | 0 | 0 | 1 | 1 |
| 5 | AGPAT1 | 1-acylglycerol-3-phosphate O-acyltransferase 1 (lysophosphatidic acid acyltransferase, alpha) | 1 | 0 | 0 | 0 | 0 | 1 | 1 |
| 6 | BACH2 | BTB and CNC homology 1, basic leucine zipper transcription factor 2 | 5 | 0 | 0 | 0 | 0 | 1 | 1 |
| 7 | BSN | bassoon (presynaptic cytomatrix protein) | 4 | 0 | 0 | 0 | 0 | 1 | 1 |
| 8 | C12orf68 | 1 | 0 | 0 | 0 | 0 | 1 | 1 | |
| 9 | C14orf43 | chromosome 14 open reading frame 43 | 1 | 0 | 0 | 0 | 0 | 1 | 1 |
| 10 | C1orf59 | chromosome 1 open reading frame 59 | 0 | 0 | 0 | 0 | 0 | 1 | 1 |
Note:
n - number of (nonsilent) mutations in this gene across the individual set.
cos = number of unique mutated sites in this gene in COSMIC
n_cos = overlap between n and cos.
N_cos = number of individuals times cos.
cos_ev = total evidence: number of reports in COSMIC for mutations seen in this gene.
p = p-value for seeing the observed amount of overlap in this gene)
q = q-value, False Discovery Rate (Benjamini-Hochberg procedure)
Table 5. Get Full Table Genes with Clustered Mutations
| num | gene | desc | n | mindist | npairs3 | npairs12 |
|---|---|---|---|---|---|---|
| 399 | VASN | vasorin | 6 | 0 | 6 | 6 |
| 109 | ERBB2 | v-erb-b2 erythroblastic leukemia viral oncogene homolog 2, neuro/glioblastoma derived oncogene homolog (avian) | 8 | 0 | 3 | 4 |
| 12 | ANKLE1 | ankyrin repeat and LEM domain containing 1 | 2 | 0 | 1 | 1 |
| 125 | FUT2 | fucosyltransferase 2 (secretor status included) | 2 | 0 | 1 | 1 |
| 219 | MUC12 | mucin 12, cell surface associated | 10 | 0 | 1 | 1 |
| 285 | PCDHGB4 | protocadherin gamma subfamily B, 4 | 3 | 0 | 1 | 1 |
| 342 | SHD | Src homology 2 domain containing transforming protein D | 6 | 0 | 1 | 1 |
| 376 | TMEM150B | 2 | 0 | 1 | 1 | |
| 76 | CELA1 | 2 | 1 | 1 | 1 | |
| 99 | DNAH1 | dynein, axonemal, heavy chain 1 | 7 | 1 | 1 | 1 |
Note:
n - number of mutations in this gene in the individual set.
mindist - distance (in aa) between closest pair of mutations in this gene
npairs3 - how many pairs of mutations are within 3 aa of each other.
npairs12 - how many pairs of mutations are within 12 aa of each other.
Table 6. Get Full Table A Ranked List of Significantly Mutated Genesets. (Source: MSigDB GSEA Cannonical Pathway Set).Number of significant genesets found: 84. Number of genesets displayed: 10
| rank | geneset | description | genes | N_genes | mut_tally | N | n | npat | nsite | nsil | n1 | n2 | n3 | n4 | n5 | n6 | p_ns_s | p | q |
|---|---|---|---|---|---|---|---|---|---|---|---|---|---|---|---|---|---|---|---|
| 1 | HSA04012_ERBB_SIGNALING_PATHWAY | Genes involved in ErbB signaling pathway | ABL1, ABL2, AKT1, AKT2, AKT3, ARAF, AREG, BAD, BRAF, BTC, CAMK2A, CAMK2B, CAMK2D, CAMK2G, CBL, CBLB, CBLC, CDKN1A, CDKN1B, CRK, CRKL, EGF, EGFR, EIF4EBP1, ELK1, ERBB2, ERBB3, ERBB4, EREG, FRAP1, GAB1, GRB2, GSK3B, HBEGF, HRAS, JUN, KRAS, MAP2K1, MAP2K2, MAP2K4, MAP2K7, MAPK1, MAPK10, MAPK3, MAPK8, MAPK9, MYC, NCK1, NCK2, NRAS, NRG1, NRG2, NRG3, NRG4, PAK1, PAK2, PAK3, PAK4, PAK6, PAK7, PIK3CA, PIK3CB, PIK3CD, PIK3CG, PIK3R1, PIK3R2, PIK3R3, PIK3R5, PLCG1, PLCG2, PRKCA, PRKCB1, PRKCG, PTK2, RAF1, RPS6KB1, RPS6KB2, SHC1, SHC2, SHC3, SHC4, SOS1, SOS2, SRC, STAT5A, STAT5B, TGFA | 4 | AKT2(1), ERBB2(8), ERBB3(9) | 1530126 | 18 | 16 | 16 | 1 | 3 | 1 | 8 | 5 | 1 | 0 | 0.046 | 9.3e-14 | 1.8e-11 |
| 2 | HSA04020_CALCIUM_SIGNALING_PATHWAY | Genes involved in calcium signaling pathway | ADCY1, ADCY2, ADCY3, ADCY4, ADCY7, ADCY8, ADCY9, ADORA2A, ADORA2B, ADRA1A, ADRA1B, ADRA1D, ADRB1, ADRB2, ADRB3, AGTR1, ATP2A1, ATP2A2, ATP2A3, ATP2B1, ATP2B2, ATP2B3, ATP2B4, AVPR1A, AVPR1B, BDKRB1, BDKRB2, BST1, CACNA1A, CACNA1B, CACNA1C, CACNA1D, CACNA1E, CACNA1F, CACNA1G, CACNA1H, CACNA1I, CACNA1S, CALM1, CALM2, CALM3, CALML3, CALML6, CAMK2A, CAMK2B, CAMK2D, CAMK2G, CAMK4, CCKAR, CCKBR, CD38, CHP, CHRM1, CHRM2, CHRM3, CHRM5, CHRNA7, CYSLTR1, CYSLTR2, DRD1, EDNRA, EDNRB, EGFR, ERBB2, ERBB3, ERBB4, F2R, GNA11, GNA14, GNA15, GNAL, GNAQ, GNAS, GRIN1, GRIN2A, GRIN2C, GRIN2D, GRM1, GRM5, GRPR, HRH1, HRH2, HTR2A, HTR2B, HTR2C, HTR4, HTR5A, HTR6, HTR7, ITPKA, ITPKB, ITPR1, ITPR2, ITPR3, LHCGR, LTB4R2, MLCK, MYLK, MYLK2, NOS1, NOS2A, NOS3, NTSR1, OXTR, P2RX1, P2RX2, P2RX3, P2RX4, P2RX5, P2RX7, P2RXL1, PDE1A, PDE1B, PDE1C, PDGFRA, PDGFRB, PHKA1, PHKA2, PHKB, PHKG1, PHKG2, PLCB1, PLCB2, PLCB3, PLCB4, PLCD1, PLCD3, PLCD4, PLCE1, PLCG1, PLCG2, PLCZ1, PLN, PPID, PPP3CA, PPP3CB, PPP3CC, PPP3R1, PPP3R2, PRKACA, PRKACB, PRKACG, PRKCA, PRKCB1, PRKCG, PRKX, PRKY, PTAFR, PTGER1, PTGER3, PTGFR, PTK2B, RYR1, RYR2, RYR3, SLC25A4, SLC25A5, SLC25A6, SLC8A1, SLC8A2, SLC8A3, SPHK1, SPHK2, TACR1, TACR2, TACR3, TBXA2R, TNNC1, TNNC2, TRHR, TRPC1, VDAC1, VDAC2, VDAC3 | 7 | ERBB2(8), ERBB3(9), PPP3CB(3) | 2075151 | 20 | 18 | 18 | 1 | 2 | 3 | 8 | 6 | 1 | 0 | 0.019 | 1e-13 | 1.8e-11 |
| 3 | ERBB3PATHWAY | Neuregulins bind to the receptor tyrosine kinases ErbB3 and ErbB4, surface-localized receptors whose overexpression induces tumor formation. | EGF, EGFR, ERBB3, NRG1, UBE2D1 | 1 | ERBB3(9) | 563277 | 9 | 9 | 9 | 0 | 0 | 1 | 5 | 2 | 1 | 0 | 0.092 | 1.3e-11 | 1.6e-09 |
| 4 | HSA05050_DENTATORUBROPALLIDOLUYSIAN_ATROPHY | Genes involved in dentatorubropallidoluysian atrophy (DRPLA) | ATN1, BAIAP2, CASP1, CASP3, CASP7, CASP8, GAPDH, INS, INSR, ITCH, MAGI1, MAGI2, RERE, WWP1, WWP2 | 1 | ATN1(8) | 770640 | 8 | 8 | 6 | 1 | 0 | 3 | 1 | 0 | 4 | 0 | 0.49 | 4.2e-10 | 3.6e-08 |
| 5 | INTEGRINPATHWAY | Integrins are cell surface receptors commonly present at focal adhensions that interact with the extracellular matrix and transduce extracellular signaling. | ACTA1, ACTN1, ACTN2, ACTN3, ARHA, BCAR1, BCR, CAPN1, CAPNS1, CAPNS2, CAV1, CRKL, CSK, FYN, GRB2, GRF2, HRAS, ITGA1, ITGB1, JUN, MAP2K1, MAP2K2, MAPK1, MAPK3, MAPK8, PPP1R12B, PTK2, PXN, RAF1, RAP1A, ROCK1, SHC1, SOS1, SRC, TLN1, TNS, VCL, ZYX | 2 | CAV1(1), TLN1(9) | 1689831 | 10 | 10 | 10 | 1 | 1 | 1 | 4 | 1 | 3 | 0 | 0.35 | 2.9e-08 | 1.6e-06 |
| 6 | CHEMICALPATHWAY | DNA damage promotes Bid cleavage, which stimulates mitochondrial cytochrome c release and consequent caspase activation, resulting in apoptosis. | ADPRT, AKT1, APAF1, ATM, BAD, BAX, BCL2, BCL2L1, BID, CASP3, CASP6, CASP7, CASP9, CYCS, EIF2S1, PRKCA, PRKCB1, PTK2, PXN, STAT1, TLN1, TP53 | 1 | TLN1(9) | 1514409 | 9 | 9 | 9 | 1 | 1 | 1 | 3 | 1 | 3 | 0 | 0.41 | 4.2e-08 | 1.6e-06 |
| 7 | ECMPATHWAY | Extracellular matrix induces integrin-mediated FAK phosphorylation in epithelial cells, leading to PI3 and MAP kinase activation and actin reorganization. | ARHA, ARHGAP5, DIAPH1, FYN, GSN, HRAS, ITGA1, ITGB1, MAP2K1, MAPK1, MAPK3, MYL2, MYLK, PFN1, PIK3CA, PIK3R1, PTK2, PXN, RAF1, ROCK1, SHC1, SRC, TLN1 | 1 | TLN1(9) | 1514409 | 9 | 9 | 9 | 1 | 1 | 1 | 3 | 1 | 3 | 0 | 0.41 | 4.2e-08 | 1.6e-06 |
| 8 | MCALPAINPATHWAY | In integrin-mediated cell migration, calpains digest links between the actin cytoskeleton and focal adhesion proteins. | ACTA1, CAPN1, CAPN2, CAPNS1, CAPNS2, CXCR3, EGF, EGFR, HRAS, ITGA1, ITGB1, MAPK1, MAPK3, MYL2, MYLK, PRKACB, PRKACG, PRKAR1A, PRKAR1B, PRKAR2A, PRKAR2B, PTK2, PXN, TLN1, VIL2 | 1 | TLN1(9) | 1514409 | 9 | 9 | 9 | 1 | 1 | 1 | 3 | 1 | 3 | 0 | 0.41 | 4.2e-08 | 1.6e-06 |
| 9 | UCALPAINPATHWAY | Calpains promote formation of integrin adhesion clusters which recruit Rac to enable the formation of mature focal adhesions that do not contain calpain. | ACTA1, ACTN1, ACTN2, ACTN3, ARHA, CAPN1, CAPNS1, CAPNS2, ITGA1, ITGB1, ITGB3, PTK2, PXN, RAC1, SPTAN1, SRC, TLN1, VIL2 | 1 | TLN1(9) | 1514409 | 9 | 9 | 9 | 1 | 1 | 1 | 3 | 1 | 3 | 0 | 0.41 | 4.2e-08 | 1.6e-06 |
| 10 | RHOPATHWAY | RhoA is a G protein whose active form stabilizes actin structures such as focal adhesions and activates Rock1, which phosphorylates myosin light chains. | ACTR2, ACTR3, ARHA, ARHGAP1, ARHGAP4, ARHGAP5, ARHGAP6, ARHGEF1, ARHGEF11, ARHGEF5, ARPC1A, ARPC1B, ARPC2, ARPC3, ARPC4, BAIAP2, CFL1, DIAPH1, GSN, LIMK1, MYL2, MYLK, OPHN1, PFN1, PIP5K1A, PIP5K1B, PPP1R12B, ROCK1, SRC, TLN1, VCL | 2 | TLN1(9) | 1594515 | 9 | 9 | 9 | 1 | 1 | 1 | 3 | 1 | 3 | 0 | 0.41 | 6.7e-08 | 2.3e-06 |
Table 7. Get Full Table A Ranked List of Significantly Mutated Genesets (Excluding Significantly Mutated Genes). Number of significant genesets found: 0. Number of genesets displayed: 10
| rank | geneset | description | genes | N_genes | mut_tally | N | n | npat | nsite | nsil | n1 | n2 | n3 | n4 | n5 | n6 | p_ns_s | p | q |
|---|---|---|---|---|---|---|---|---|---|---|---|---|---|---|---|---|---|---|---|
| 1 | HSA00062_FATTY_ACID_ELONGATION_IN_MITOCHONDRIA | Genes involved in fatty acid elongation in mitochondria | ACAA2, ECHS1, HADH, HADHA, HADHB, HSD17B10, HSD17B4, MECR, PPT1, PPT2 | 2 | HSD17B10(1), PPT2(1) | 311298 | 2 | 2 | 2 | 0 | 0 | 1 | 1 | 0 | 0 | 0 | 0.48 | 0.0035 | 0.39 |
| 2 | GLYCEROLIPID_METABOLISM | ADH1A, ADH1A, ADH1B, ADH1C, ADH1B, ADH1C, ADH4, ADH6, ADH7, ADHFE1, AGPAT1, AGPAT2, AGPAT3, AGPAT4, AKR1A1, AKR1B1, ALDH1A1, ALDH1A2, ALDH1A3, ALDH1B1, ALDH2, ALDH3A1, ALDH3A2, ALDH9A1, CEL, DGAT1, DGKA, DGKB, DGKD, DGKE, DGKG, DGKH, DGKQ, DGKZ, GK, GLA, GLB1, LCT, LIPC, LIPF, LIPG, LPL, PNLIP, PNLIPRP1, PNLIPRP2, PPAP2A, PPAP2B, PPAP2C | 2 | ADH7(2), AGPAT1(1) | 369096 | 3 | 3 | 3 | 0 | 1 | 1 | 0 | 0 | 1 | 0 | 0.34 | 0.0059 | 0.39 | |
| 3 | HSA00561_GLYCEROLIPID_METABOLISM | Genes involved in glycerolipid metabolism | ADH1A, ADH1B, ADH1C, ADH4, ADH5, ADH6, ADH7, ADHFE1, AGK, AGPAT1, AGPAT2, AGPAT3, AGPAT4, AGPAT6, AKR1A1, AKR1B1, ALDH1A3, ALDH1B1, ALDH2, ALDH3A1, ALDH3A2, ALDH7A1, ALDH9A1, CEL, DAK, DGAT1, DGAT2, DGKA, DGKB, DGKD, DGKE, DGKG, DGKH, DGKI, DGKQ, DGKZ, GK, GK2, GLA, GLB1, GPAM, LCT, LIPA, LIPC, LIPF, LIPG, LPL, LYCAT, MGLL, PNLIP, PNLIPRP1, PNLIPRP2, PNPLA3, PPAP2A, PPAP2B, PPAP2C, UGCGL1, UGCGL2 | 2 | ADH7(2), AGPAT1(1) | 369096 | 3 | 3 | 3 | 0 | 1 | 1 | 0 | 0 | 1 | 0 | 0.34 | 0.0059 | 0.39 |
| 4 | HSA00071_FATTY_ACID_METABOLISM | Genes involved in fatty acid metabolism | ACAA1, ACAA2, ACADL, ACADM, ACADS, ACADSB, ACADVL, ACAT1, ACAT2, ACOX1, ACOX3, ACSL1, ACSL3, ACSL4, ACSL5, ACSL6, ADH1A, ADH1B, ADH1C, ADH4, ADH5, ADH6, ADH7, ADHFE1, ALDH1A3, ALDH1B1, ALDH2, ALDH3A1, ALDH3A2, ALDH7A1, ALDH9A1, CPT1A, CPT1B, CPT1C, CPT2, CYP4A11, CYP4A22, DCI, ECHS1, EHHADH, GCDH, HADH, HADHA, HADHB, HSD17B10, HSD17B4, PECI | 3 | ACADVL(2), ADH7(2), HSD17B10(1) | 708279 | 5 | 5 | 5 | 0 | 2 | 3 | 0 | 0 | 0 | 0 | 0.15 | 0.0066 | 0.39 |
| 5 | NUCLEAR_RECEPTORS | ALK, AR, ESR1, ESR2, ESRRA, HNF4A, NPM1, NR0B1, NR1D2, NR1H2, NR1H3, NR1I2, NR1I3, NR2C2, NR2E1, NR2F1, NR2F2, NR2F6, NR3C1, NR4A1, NR4A2, NR5A1, NR5A2, PGR, PPARA, PPARD, PPARG, RARA, RARB, RARG, ROR1, RORA, RORC, RXRA, RXRB, RXRG, THRA, THRA, NR1D1, THRB, VDR | 2 | NR1D1(2), THRA(1) | 489255 | 3 | 3 | 3 | 1 | 1 | 0 | 1 | 1 | 0 | 0 | 0.82 | 0.0076 | 0.39 | |
| 6 | ETCPATHWAY | Energy is extracted from carbohydrates via oxidation and transferred to the mitochondrial electron transport chain, which couples ATP synthesis to the reduction of oxygen to water. | ATP5A1, CYCS, GPD2, MTCO1, NDUFA1, SDHA, SDHB, SDHC, SDHD, UQCRC1 | 1 | UQCRC1(2) | 238290 | 2 | 2 | 2 | 0 | 0 | 0 | 1 | 0 | 1 | 0 | 0.82 | 0.012 | 0.39 |
| 7 | PEPTIDE_GPCRS | AGTR1, AGTR2, ATP8A1, AVPR1A, AVPR1B, AVPR2, BDKRB1, BDKRB2, BLR1, BRS3, C3AR1, C5R1, CCKAR, CCKBR, CCR1, CCR10, CCR2, CCR3, CCR4, CCR5, CCR6, CCR7, CCR8, CX3CR1, CXCR3, CXCR4, CXCR6, EDNRA, EDNRB, ELA3A, FPR1, FPRL1, FPRL2, FSHR, FY, GALR1, GALR2, GALR3, GALT, GHSR, GNB2L1, GNRHR, GPR77, GRPR, IL8RA, IL8RB, LHCGR, MC1R, MC2R, MC3R, MC4R, MC5R, NMBR, NPY1R, NPY2R, NPY5R, NPY6R, NTSR1, NTSR2, OPRD1, OPRK1, OPRL1, OPRM1, OXTR, PPYR1, SSTR1, SSTR2, SSTR3, SSTR4, TAC4, TACR1, TACR2, TACR3, TRHR, TSHR | 3 | GALT(1), MC4R(1), SSTR2(1) | 674817 | 3 | 3 | 3 | 1 | 0 | 0 | 1 | 2 | 0 | 0 | 0.74 | 0.013 | 0.39 | |
| 8 | HSA04060_CYTOKINE_CYTOKINE_RECEPTOR_INTERACTION | Genes involved in cytokine-cytokine receptor interaction | ACVR1, ACVR1B, ACVR2A, ACVR2B, AMH, AMHR2, BMP2, BMP7, BMPR1A, BMPR1B, BMPR2, CCL1, CCL11, CCL13, CCL14, CCL15, CCL16, CCL17, CCL18, CCL19, CCL2, CCL20, CCL21, CCL22, CCL23, CCL24, CCL25, CCL26, CCL27, CCL28, CCL3, CCL4, CCL5, CCL7, CCL8, CCR1, CCR2, CCR3, CCR4, CCR5, CCR6, CCR7, CCR8, CCR9, CD27, CD40, CD40LG, CD70, CLCF1, CNTF, CNTFR, CRLF2, CSF1, CSF1R, CSF2, CSF2RA, CSF2RB, CSF3, CSF3R, CTF1, CX3CL1, CX3CR1, CXCL1, CXCL10, CXCL11, CXCL12, CXCL13, CXCL14, CXCL16, CXCL2, CXCL3, CXCL5, CXCL6, CXCL9, CXCR3, CXCR4, CXCR6, EDA, EDA2R, EDAR, EGF, EGFR, EPO, EPOR, FAS, FASLG, FLJ78302, FLT1, FLT3, FLT3LG, FLT4, GDF5, GH1, GH2, GHR, HGF, IFNA1, IFNA10, IFNA13, IFNA14, IFNA16, IFNA17, IFNA2, IFNA21, IFNA4, IFNA5, IFNA6, IFNA7, IFNA8, IFNAR1, IFNAR2, IFNB1, IFNE1, IFNG, IFNGR1, IFNGR2, IFNK, IFNW1, IL10, IL10RA, IL10RB, IL11, IL11RA, IL12A, IL12B, IL12RB1, IL12RB2, IL13, IL13RA1, IL15, IL15RA, IL17A, IL17B, IL17RA, IL17RB, IL18, IL18R1, IL18RAP, IL19, IL1A, IL1B, IL1R1, IL1R2, IL1RAP, IL2, IL20, IL20RA, IL21, IL21R, IL22, IL22RA1, IL22RA2, IL23A, IL23R, IL24, IL25, IL26, IL28A, IL28B, IL28RA, IL29, IL2RA, IL2RB, IL2RG, IL3, IL3RA, IL4, IL4R, IL5, IL5RA, IL6, IL6R, IL6ST, IL7, IL7R, IL8, IL8RA, IL8RB, IL9, IL9R, INHBA, INHBB, INHBC, INHBE, KDR, KIT, KITLG, LEP, LEPR, LIF, LIFR, LOC728045, LTA, LTB, LTBR, MET, MPL, NGFR, OSM, OSMR, PDGFB, PDGFC, PDGFRA, PDGFRB, PF4, PF4V1, PLEKHO2, PPBP, PRL, PRLR, RELT, TGFB1, TGFB2, TGFB3, TGFBR1, TGFBR2, TNF, TNFRSF10A, TNFRSF10B, TNFRSF10C, TNFRSF10D, TNFRSF11A, TNFRSF11B, TNFRSF12A, TNFRSF13B, TNFRSF13C, TNFRSF14, TNFRSF17, TNFRSF18, TNFRSF19, TNFRSF1A, TNFRSF1B, TNFRSF21, TNFRSF25, TNFRSF4, TNFRSF6B, TNFRSF8, TNFRSF9, TNFSF10, TNFSF11, TNFSF12, TNFSF13, TNFSF13B, TNFSF14, TNFSF15, TNFSF18, TNFSF4, TNFSF8, TNFSF9, TPO, TSLP, VEGFA, VEGFB, VEGFC, XCL1, XCL2, XCR1 | 10 | IFNA10(1), IL10RA(1), IL21(1), IL25(1) | 1417065 | 4 | 4 | 4 | 0 | 1 | 0 | 1 | 2 | 0 | 0 | 0.39 | 0.013 | 0.39 |
| 9 | HSA00280_VALINE_LEUCINE_AND_ISOLEUCINE_DEGRADATION | Genes involved in valine, leucine and isoleucine degradation | ABAT, ACAA1, ACAA2, ACADM, ACADS, ACAT1, ACAT2, ALDH1A3, ALDH1B1, ALDH2, ALDH3A1, ALDH3A2, ALDH6A1, ALDH7A1, ALDH9A1, AOX1, AUH, BCAT1, BCAT2, BCKDHA, BCKDHB, DBT, DLD, ECHS1, EHHADH, HADH, HADHA, HADHB, HIBADH, HIBCH, HMGCL, HMGCS1, HMGCS2, HSD17B10, HSD17B4, IVD, MCCC1, MCCC2, MCEE, MUT, OXCT1, OXCT2, PCCA, PCCB | 2 | BCAT2(2), HSD17B10(1) | 382785 | 3 | 3 | 3 | 1 | 2 | 1 | 0 | 0 | 0 | 0 | 0.62 | 0.019 | 0.39 |
| 10 | NFATPATHWAY | Cardiac hypertrophy is induced by NF-ATc4 and GATA4, which are stimulated through calcineurin activated by CaMK. | ACTA1, AGT, AKT1, CALM1, CALM2, CALM3, CALR, CAMK1, CAMK1G, CAMK4, CREBBP, CSNK1A1, CTF1, DTR, EDN1, ELSPBP1, F2, FGF2, FKBP1A, GATA4, GSK3B, HAND1, HAND2, HRAS, IGF1, LIF, MAP2K1, MAPK1, MAPK14, MAPK3, MAPK8, MEF2C, MYH2, NFATC1, NFATC2, NFATC3, NFATC4, NKX2-5, NPPA, PIK3CA, PIK3R1, PPP3CA, PPP3CB, PPP3CC, PRKACB, PRKACG, PRKAR1A, PRKAR1B, PRKAR2A, PRKAR2B, RAF1, RPS6KB1, SYT1 | 1 | HAND2(2) | 92781 | 2 | 2 | 2 | 0 | 0 | 0 | 2 | 0 | 0 | 0 | 0.58 | 0.02 | 0.39 |
In brief, we tabulate the number of mutations and the number of covered bases for each gene. The counts are broken down by mutation context category: four context categories that are discovered by MutSig, and one for indel and 'null' mutations, which include indels, nonsense mutations, splice-site mutations, and non-stop (read-through) mutations. For each gene, we calculate the probability of seeing the observed constellation of mutations, i.e. the product P1 x P2 x ... x Pm, or a more extreme one, given the background mutation rates calculated across the dataset.[1]
This is an experimental feature. The full results of the analysis summarized in this report can be downloaded from the TCGA Data Coordination Center.