This report serves to describe the mutational landscape and properties of a given individual set, as well as rank genes and genesets according to mutational significance. MutSig v1.5 was used to generate the results found in this report.
Working with individual set: CESC.
Number of patients in set: 36
The input for this pipeline is a set of individuals with the following files associated for each:
1. An annotated .maf file describing the mutations called for the respective individual, and their properties.
2. A .wig file that contains information about the coverage of the sample.
Significantly mutated genes (q ≤ 0.1): 32
Mutations seen in COSMIC: 0
Significantly mutated genes in COSMIC territory: 0
Genes with clustered mutations (&le 3 aa apart): 1
Significantly mutated genesets: 31
Significantly mutated genesets: (excluding sig. mutated genes): 0
Table 1. Get Full Table Table representing breakdown of mutations by type.
| type | count |
|---|---|
| Missense_Mutation | 72 |
| Nonsense_Mutation | 8 |
| Silent | 39 |
| Total | 119 |
Table 2. Get Full Table A breakdown of mutation rates per category discovered for this individual set.
| category | n | N | rate | rate_per_mb | relative_rate | exp_ns_s_ratio |
|---|---|---|---|---|---|---|
| Tp*C->(T/G) | 49 | 879948 | 0.000056 | 56 | 4.9 | 2.6 |
| Tp*C->A | 2 | 879948 | 2.3e-06 | 2.3 | 0.2 | 3.3 |
| (A/C/G)p*C->mut | 18 | 3115296 | 5.8e-06 | 5.8 | 0.51 | 2.6 |
| A->mut | 3 | 3025296 | 9.9e-07 | 0.99 | 0.087 | 4.2 |
| indel+null | 8 | 7020540 | 1.1e-06 | 1.1 | 0.1 | NaN |
| Total | 80 | 7020540 | 0.000011 | 11 | 1 | 3.2 |
The x axis represents the samples. The y axis represents the exons, one row per exon, and they are sorted by average coverage across samples. For exons with exactly the same average coverage, they are sorted next by the %GC of the exon. (The secondary sort is especially useful for the zero-coverage exons at the bottom).
Figure 1.
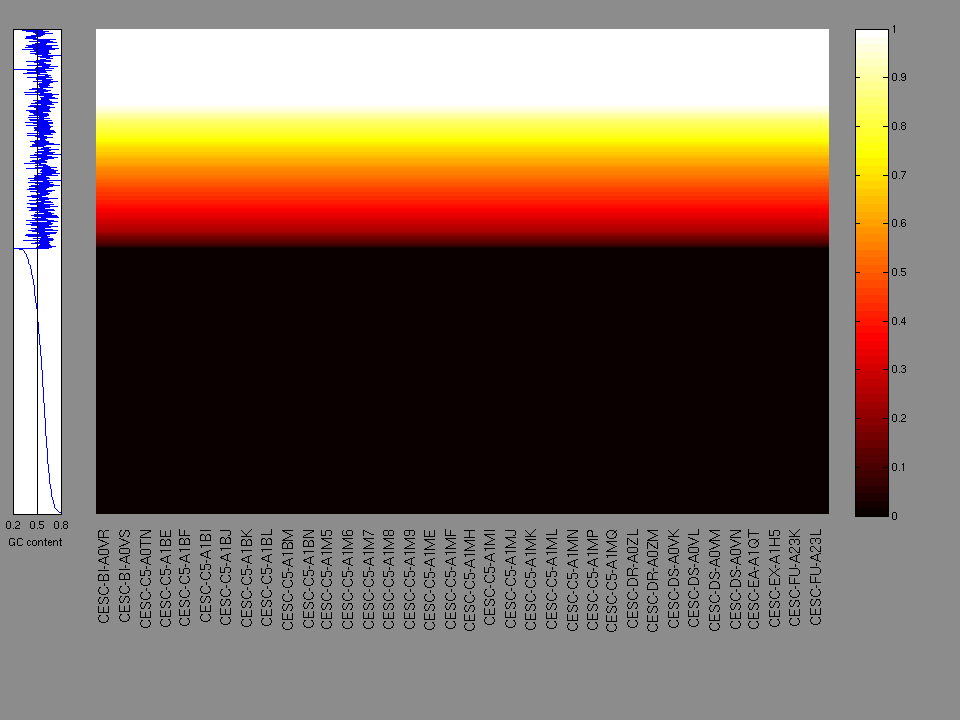
Figure 2.
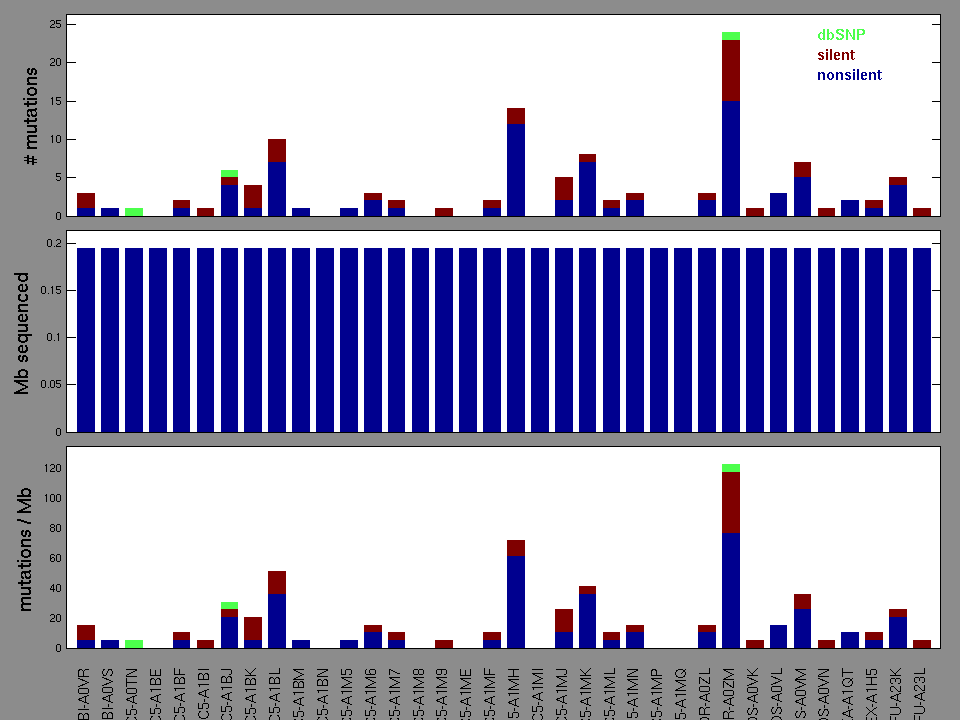
Table 3. Get Full Table A Ranked List of Significantly Mutated Genes. Number of significant genes found: 32. Number of genes displayed: 35
| rank | gene | description | N | n | npat | nsite | nsil | n1 | n2 | n3 | n4 | n5 | p_ns_s | p | q |
|---|---|---|---|---|---|---|---|---|---|---|---|---|---|---|---|
| 1 | FCRL1 | Fc receptor-like 1 | 19872 | 3 | 3 | 3 | 0 | 1 | 0 | 0 | 2 | 0 | 0.43 | 1.6e-08 | 6.1e-06 |
| 2 | MXRA5 | matrix-remodelling associated 5 | 77760 | 4 | 4 | 4 | 0 | 3 | 0 | 0 | 0 | 1 | 0.44 | 0.000019 | 0.0037 |
| 3 | HLA-DMB | major histocompatibility complex, class II, DM beta | 9612 | 2 | 2 | 2 | 0 | 1 | 0 | 1 | 0 | 0 | 0.42 | 0.000035 | 0.0045 |
| 4 | ZNF776 | zinc finger protein 776 | 24588 | 2 | 2 | 2 | 0 | 1 | 0 | 1 | 0 | 0 | 0.67 | 0.000076 | 0.0066 |
| 5 | EHMT2 | euchromatic histone-lysine N-methyltransferase 2 | 36108 | 3 | 3 | 3 | 1 | 2 | 0 | 1 | 0 | 0 | 0.79 | 0.000085 | 0.0066 |
| 6 | PNP | 9288 | 1 | 1 | 1 | 0 | 0 | 0 | 0 | 0 | 1 | 0.8 | 0.00015 | 0.0095 | |
| 7 | EPO | erythropoietin | 7020 | 1 | 1 | 1 | 0 | 0 | 0 | 1 | 0 | 0 | 0.69 | 0.00018 | 0.0099 |
| 8 | WNT10A | wingless-type MMTV integration site family, member 10A | 12096 | 1 | 1 | 1 | 0 | 0 | 0 | 1 | 0 | 0 | 0.73 | 0.00032 | 0.015 |
| 9 | ZNF200 | zinc finger protein 200 | 11844 | 1 | 1 | 1 | 0 | 0 | 0 | 0 | 0 | 1 | 0.8 | 0.00035 | 0.015 |
| 10 | STK16 | serine/threonine kinase 16 | 13284 | 1 | 1 | 1 | 0 | 0 | 0 | 1 | 0 | 0 | 0.77 | 0.00041 | 0.015 |
| 11 | HOXA4 | homeobox A4 | 9468 | 2 | 2 | 2 | 1 | 2 | 0 | 0 | 0 | 0 | 0.5 | 0.00043 | 0.015 |
| 12 | FKBP7 | FK506 binding protein 7 | 17892 | 1 | 1 | 1 | 0 | 0 | 0 | 0 | 1 | 0 | 0.79 | 0.00066 | 0.021 |
| 13 | TUBA8 | tubulin, alpha 8 | 16848 | 1 | 1 | 1 | 0 | 0 | 0 | 0 | 0 | 1 | 0.63 | 0.0007 | 0.021 |
| 14 | CAD | carbamoyl-phosphate synthetase 2, aspartate transcarbamylase, and dihydroorotase | 71424 | 2 | 2 | 2 | 0 | 1 | 0 | 1 | 0 | 0 | 0.53 | 0.00078 | 0.021 |
| 15 | SCNN1D | sodium channel, nonvoltage-gated 1, delta | 20124 | 1 | 1 | 1 | 0 | 0 | 0 | 1 | 0 | 0 | 0.76 | 0.00081 | 0.021 |
| 16 | C17orf81 | chromosome 17 open reading frame 81 | 17604 | 1 | 1 | 1 | 0 | 0 | 0 | 0 | 0 | 1 | 0.82 | 0.00087 | 0.021 |
| 17 | ACADVL | acyl-Coenzyme A dehydrogenase, very long chain | 19476 | 1 | 1 | 1 | 1 | 0 | 0 | 0 | 0 | 1 | 0.84 | 0.00093 | 0.021 |
| 18 | LEMD2 | LEM domain containing 2 | 20340 | 1 | 1 | 1 | 0 | 0 | 0 | 1 | 0 | 0 | 0.73 | 0.001 | 0.022 |
| 19 | MCOLN1 | mucolipin 1 | 22104 | 1 | 1 | 1 | 0 | 0 | 0 | 0 | 0 | 1 | 0.59 | 0.0012 | 0.024 |
| 20 | LIMA1 | LIM domain and actin binding 1 | 22140 | 1 | 1 | 1 | 0 | 0 | 0 | 1 | 0 | 0 | 0.81 | 0.0013 | 0.024 |
| 21 | LRIT2 | leucine-rich repeat, immunoglobulin-like and transmembrane domains 2 | 28980 | 1 | 1 | 1 | 0 | 0 | 0 | 1 | 0 | 0 | 0.75 | 0.0015 | 0.028 |
| 22 | MAML1 | mastermind-like 1 (Drosophila) | 29016 | 1 | 1 | 1 | 2 | 0 | 0 | 0 | 0 | 1 | 0.97 | 0.0017 | 0.03 |
| 23 | USP48 | ubiquitin specific peptidase 48 | 35892 | 1 | 1 | 1 | 0 | 0 | 0 | 1 | 0 | 0 | 0.83 | 0.0019 | 0.032 |
| 24 | C1QL1 | complement component 1, q subcomponent-like 1 | 7488 | 1 | 1 | 1 | 0 | 1 | 0 | 0 | 0 | 0 | 0.66 | 0.0021 | 0.034 |
| 25 | CDK5RAP3 | CDK5 regulatory subunit associated protein 3 | 17244 | 2 | 2 | 2 | 1 | 1 | 0 | 1 | 0 | 0 | 0.82 | 0.0034 | 0.052 |
| 26 | HSPB8 | heat shock 22kDa protein 8 | 5940 | 1 | 1 | 1 | 0 | 1 | 0 | 0 | 0 | 0 | 0.8 | 0.0039 | 0.058 |
| 27 | PCDHGB4 | protocadherin gamma subfamily B, 4 | 68436 | 1 | 1 | 1 | 0 | 0 | 0 | 1 | 0 | 0 | 0.72 | 0.0044 | 0.062 |
| 28 | PCDHGA8 | protocadherin gamma subfamily A, 8 | 69444 | 1 | 1 | 1 | 0 | 0 | 0 | 1 | 0 | 0 | 0.71 | 0.0045 | 0.062 |
| 29 | BARHL2 | BarH-like homeobox 2 | 11412 | 1 | 1 | 1 | 0 | 0 | 0 | 1 | 0 | 0 | 0.71 | 0.005 | 0.067 |
| 30 | PCDHGA1 | protocadherin gamma subfamily A, 1 | 79344 | 1 | 1 | 1 | 0 | 0 | 0 | 1 | 0 | 0 | 0.71 | 0.0059 | 0.076 |
| 31 | RHOV | ras homolog gene family, member V | 8640 | 1 | 1 | 1 | 0 | 1 | 0 | 0 | 0 | 0 | 0.78 | 0.007 | 0.086 |
| 32 | SPANXN2 | SPANX family, member N2 | 7560 | 2 | 2 | 2 | 0 | 2 | 0 | 0 | 0 | 0 | 1 | 0.0071 | 0.086 |
| 33 | CIC | capicua homolog (Drosophila) | 51480 | 2 | 2 | 2 | 0 | 1 | 1 | 0 | 0 | 0 | 0.56 | 0.014 | 0.17 |
| 34 | ZNF777 | zinc finger protein 777 | 24768 | 2 | 2 | 2 | 1 | 2 | 0 | 0 | 0 | 0 | 0.81 | 0.031 | 0.36 |
| 35 | CHAC2 | ChaC, cation transport regulator homolog 2 (E. coli) | 5292 | 1 | 1 | 1 | 0 | 1 | 0 | 0 | 0 | 0 | 0.82 | 0.039 | 0.44 |
Note:
N - number of sequenced bases in this gene across the individual set.
n - number of (nonsilent) mutations in this gene across the individual set.
npat - number of patients (individuals) with at least one nonsilent mutation.
nsite - number of unique sites having a non-silent mutation.
nsil - number of silent mutations in this gene across the individual set.
n1 - number of nonsilent mutations of type: Tp*C->(T/G) .
n2 - number of nonsilent mutations of type: Tp*C->A .
n3 - number of nonsilent mutations of type: (A/C/G)p*C->mut .
n4 - number of nonsilent mutations of type: A->mut .
n5 - number of nonsilent mutations of type: indel+null .
null - mutation category that includes nonsense, frameshift, splice-site mutations
p_classic = p-value for the observed amount of nonsilent mutations being elevated in this gene
p_ns_s = p-value for the observed nonsilent/silent ratio being elevated in this gene
p = p-value (overall)
q = q-value, False Discovery Rate (Benjamini-Hochberg procedure)
In this analysis, COSMIC is used as a filter to increase power by restricting the territory of each gene. Cosmic version: v48.
Table 4. Get Full Table Significantly mutated genes (COSMIC territory only). To access the database please go to: COSMIC. Number of significant genes found: 0. Number of genes displayed: 10
| rank | gene | description | n | cos | n_cos | N_cos | cos_ev | p | q |
|---|---|---|---|---|---|---|---|---|---|
| 1 | ABCC10 | ATP-binding cassette, sub-family C (CFTR/MRP), member 10 | 0 | 0 | 0 | 0 | 0 | 1 | 1 |
| 2 | BACH2 | BTB and CNC homology 1, basic leucine zipper transcription factor 2 | 0 | 0 | 0 | 0 | 0 | 1 | 1 |
| 3 | BSN | bassoon (presynaptic cytomatrix protein) | 2 | 0 | 0 | 0 | 0 | 1 | 1 |
| 4 | CLIC1 | chloride intracellular channel 1 | 0 | 0 | 0 | 0 | 0 | 1 | 1 |
| 5 | FAM78B | family with sequence similarity 78, member B | 0 | 0 | 0 | 0 | 0 | 1 | 1 |
| 6 | FGF23 | fibroblast growth factor 23 | 0 | 0 | 0 | 0 | 0 | 1 | 1 |
| 7 | GNAT1 | guanine nucleotide binding protein (G protein), alpha transducing activity polypeptide 1 | 1 | 0 | 0 | 0 | 0 | 1 | 1 |
| 8 | KLC4 | kinesin light chain 4 | 0 | 0 | 0 | 0 | 0 | 1 | 1 |
| 9 | LACRT | lacritin | 0 | 0 | 0 | 0 | 0 | 1 | 1 |
| 10 | MSH5 | mutS homolog 5 (E. coli) | 0 | 0 | 0 | 0 | 0 | 1 | 1 |
Note:
n - number of (nonsilent) mutations in this gene across the individual set.
cos = number of unique mutated sites in this gene in COSMIC
n_cos = overlap between n and cos.
N_cos = number of individuals times cos.
cos_ev = total evidence: number of reports in COSMIC for mutations seen in this gene.
p = p-value for seeing the observed amount of overlap in this gene)
q = q-value, False Discovery Rate (Benjamini-Hochberg procedure)
Table 5. Get Full Table Genes with Clustered Mutations
| num | gene | desc | n | mindist | npairs3 | npairs12 |
|---|---|---|---|---|---|---|
| 23 | HLA-DMB | major histocompatibility complex, class II, DM beta | 2 | 2 | 1 | 1 |
| 24 | HOXA4 | homeobox A4 | 2 | 8 | 0 | 1 |
| 18 | FCRL1 | Fc receptor-like 1 | 3 | 12 | 0 | 0 |
| 49 | SPANXN2 | SPANX family, member N2 | 2 | 12 | 0 | 0 |
| 15 | EHMT2 | euchromatic histone-lysine N-methyltransferase 2 | 3 | 16 | 0 | 0 |
| 32 | MXRA5 | matrix-remodelling associated 5 | 4 | 20 | 0 | 0 |
| 6 | BSN | bassoon (presynaptic cytomatrix protein) | 2 | 52 | 0 | 0 |
| 63 | ZNF777 | zinc finger protein 777 | 2 | 97 | 0 | 0 |
| 62 | ZNF776 | zinc finger protein 776 | 2 | 126 | 0 | 0 |
| 11 | CDK5RAP3 | CDK5 regulatory subunit associated protein 3 | 2 | 130 | 0 | 0 |
Note:
n - number of mutations in this gene in the individual set.
mindist - distance (in aa) between closest pair of mutations in this gene
npairs3 - how many pairs of mutations are within 3 aa of each other.
npairs12 - how many pairs of mutations are within 12 aa of each other.
Table 6. Get Full Table A Ranked List of Significantly Mutated Genesets. (Source: MSigDB GSEA Cannonical Pathway Set).Number of significant genesets found: 31. Number of genesets displayed: 10
| rank | geneset | description | genes | N_genes | mut_tally | N | n | npat | nsite | nsil | n1 | n2 | n3 | n4 | n5 | p_ns_s | p | q |
|---|---|---|---|---|---|---|---|---|---|---|---|---|---|---|---|---|---|---|
| 1 | HISTONE_METHYLTRANSFERASE | Genes with HMT activity | AOF2, KDM6A, ASH1L, ASH2L, C17orf79, CARM1, CTCFL, DOT1L, EED, EHMT1, EHMT2, EZH1, EZH2, FBXL10, FBXL11, FBXO11, HCFC1, HSF4, JMJD1A, JMJD1B, JMJD2A, JMJD2B, JMJD2C, JMJD2D, JMJD3, JMJD4, JMJD6, MEN1, MLL, MLL2, MLL3, MLL4, MLL5, NSD1, OGT, PAXIP1, PPP1CA, PPP1CB, PPP1CC, PRDM2, PRDM6, PRDM7, PRDM9, PRMT1, PRMT5, PRMT6, PRMT7, PRMT8, RBBP5, SATB1, SETD1A, SETD1B, SETD2, SETD7, SETD8, SETDB1, SETDB2, SETMAR, SMYD3, STK38, SUV39H1, SUV39H2, SUV420H1, SUV420H2, SUZ12, WHSC1, WHSC1L1 | 1 | EHMT2(3) | 36108 | 3 | 3 | 3 | 1 | 2 | 0 | 1 | 0 | 0 | 0.79 | 0.000085 | 0.004 |
| 2 | LYSINE_DEGRADATION | AADAT, AASDH, AASDHPPT, AASS, ACAT1, ACAT2, ALDH1A1, ALDH1A2, ALDH1A3, ALDH1B1, ALDH2, ALDH3A1, ALDH3A2, ALDH9A1, ATP6V0C, SHMT1, BAT8, BBOX1, DLST, DLSTP, DOT1L, ECHS1, EHHADH, EHMT1, EHMT2, GCDH, HADHA, PLOD1, PLOD2, PLOD3, SDS, SHMT1, SHMT2, TMLHE | 1 | EHMT2(3) | 36108 | 3 | 3 | 3 | 1 | 2 | 0 | 1 | 0 | 0 | 0.79 | 0.000085 | 0.004 | |
| 3 | EPONFKBPATHWAY | The cytokine erythropoietin (Epo) prevents stress-induced neuronal apoptosis by stimulating anti-apoptotic pathways through JAK2 kinase and NF-kB. | ARNT, CDKN1A, EPO, EPOR, GRIN1, HIF1A, JAK2, NFKB1, NFKBIA, RELA, SOD2 | 1 | EPO(1) | 7020 | 1 | 1 | 1 | 0 | 0 | 0 | 1 | 0 | 0 | 0.69 | 0.00018 | 0.004 |
| 4 | EPOPATHWAY | Erythropoietin, which activates the MAPK pathway, stimulates erythrocyte production and is an effective treatment for anemia. | CSNK2A1, ELK1, EPO, EPOR, FOS, GRB2, HRAS, JAK2, JUN, MAP2K1, MAPK3, MAPK8, PLCG1, PTPN6, RAF1, SHC1, SOS1, STAT5A, STAT5B | 1 | EPO(1) | 7020 | 1 | 1 | 1 | 0 | 0 | 0 | 1 | 0 | 0 | 0.69 | 0.00018 | 0.004 |
| 5 | ERYTHPATHWAY | Erythropoietin selectively stimulates erythrocyte differentiation from CFU-GEMM cells in bone marrow. | CCL3, CSF2, CSF3, EPO, FLT3, IGF1, IL11, IL1A, IL3, IL6, IL9, KITLG, TGFB1, TGFB2, TGFB3 | 1 | EPO(1) | 7020 | 1 | 1 | 1 | 0 | 0 | 0 | 1 | 0 | 0 | 0.69 | 0.00018 | 0.004 |
| 6 | HIFPATHWAY | Under normal conditions, hypoxia inducible factor HIF-1 is degraded; under hypoxic conditions, it activates transcription of genes controlled by hpoxic response elements (HREs). | ARNT, ASPH, COPS5, CREB1, EDN1, EP300, EPO, HIF1A, HSPCA, JUN, LDHA, NOS3, P4HB, VEGF, VHL | 1 | EPO(1) | 7020 | 1 | 1 | 1 | 0 | 0 | 0 | 1 | 0 | 0 | 0.69 | 0.00018 | 0.004 |
| 7 | STEMPATHWAY | In the absence of infection, bone marrow stromal cells release hematopoietic cytokines; activated macrophages and Th cells induce hematopoiesis during infection. | CD4, CD8A, CSF1, CSF2, CSF3, EPO, IL11, IL2, IL3, IL4, IL5, IL6, IL7, IL8, IL9 | 1 | EPO(1) | 7020 | 1 | 1 | 1 | 0 | 0 | 0 | 1 | 0 | 0 | 0.69 | 0.00018 | 0.004 |
| 8 | HSA04340_HEDGEHOG_SIGNALING_PATHWAY | Genes involved in Hedgehog signaling pathway | BMP2, BMP4, BMP5, BMP6, BMP7, BMP8A, BMP8B, BTRC, CSNK1A1, CSNK1A1L, CSNK1D, CSNK1E, CSNK1G1, CSNK1G2, CSNK1G3, DHH, FBXW11, GAS1, GLI1, GLI2, GLI3, GSK3B, HHIP, IHH, LRP2, PRKACA, PRKACB, PRKACG, PRKX, PRKY, PTCH1, PTCH2, RAB23, SHH, SMO, STK36, SUFU, WNT1, WNT10A, WNT10B, WNT11, WNT16, WNT2, WNT2B, WNT3, WNT3A, WNT4, WNT5A, WNT5B, WNT6, WNT7A, WNT7B, WNT8A, WNT8B, WNT9A, WNT9B, ZIC2 | 1 | WNT10A(1) | 12096 | 1 | 1 | 1 | 0 | 0 | 0 | 1 | 0 | 0 | 0.73 | 0.00032 | 0.0063 |
| 9 | HSA00310_LYSINE_DEGRADATION | Genes involved in lysine degradation | AADAT, AASDHPPT, AASS, ACAT1, ACAT2, AKR1B10, ALDH1A3, ALDH1B1, ALDH2, ALDH3A1, ALDH3A2, ALDH7A1, ALDH9A1, BBOX1, DLST, DOT1L, ECHS1, EHHADH, EHMT1, EHMT2, GCDH, HADH, HADHA, HSD17B10, HSD17B4, HSD3B7, NSD1, OGDH, OGDHL, PIPOX, PLOD1, PLOD2, PLOD3, RDH11, RDH12, RDH13, RDH14, SETD1A, SETD7, SETDB1, SHMT1, SHMT2, SPCS1, SPCS3, SUV39H1, SUV39H2, TMLHE | 3 | EHMT2(3) | 85464 | 3 | 3 | 3 | 1 | 2 | 0 | 1 | 0 | 0 | 0.74 | 0.00061 | 0.0077 |
| 10 | HSA04540_GAP_JUNCTION | Genes involved in gap junction | ADCY1, ADCY2, ADCY3, ADCY4, ADCY5, ADCY6, ADCY7, ADCY8, ADCY9, ADRB1, CDC2, CSNK1D, DRD1, DRD2, EDG2, EGF, EGFR, GJA1, GJD2, GNA11, GNAI1, GNAI2, GNAI3, GNAQ, GNAS, GRB2, GRM1, GRM5, GUCY1A2, GUCY1A3, GUCY1B3, GUCY2C, GUCY2D, GUCY2F, HRAS, HTR2A, HTR2B, HTR2C, ITPR1, ITPR2, ITPR3, KRAS, LOC643224, LOC654264, MAP2K1, MAP2K2, MAP2K5, MAP3K2, MAPK1, MAPK3, MAPK7, NPR1, NPR2, NRAS, PDGFA, PDGFB, PDGFC, PDGFD, PDGFRA, PDGFRB, PLCB1, PLCB2, PLCB3, PLCB4, PRKACA, PRKACB, PRKACG, PRKCA, PRKCB1, PRKCG, PRKG1, PRKG2, PRKX, PRKY, RAF1, SOS1, SOS2, SRC, TJP1, TUBA1A, TUBA1B, TUBA1C, TUBA3C, TUBA3D, TUBA3E, TUBA4A, TUBA8, TUBAL3, TUBB, TUBB1, TUBB2A, TUBB2B, TUBB2C, TUBB3, TUBB4, TUBB4Q, TUBB6, TUBB8 | 1 | TUBA8(1) | 16848 | 1 | 1 | 1 | 0 | 0 | 0 | 0 | 0 | 1 | 0.63 | 0.0007 | 0.0077 |
Table 7. Get Full Table A Ranked List of Significantly Mutated Genesets (Excluding Significantly Mutated Genes). Number of significant genesets found: 0. Number of genesets displayed: 10
| rank | geneset | description | genes | N_genes | mut_tally | N | n | npat | nsite | nsil | n1 | n2 | n3 | n4 | n5 | p_ns_s | p | q |
|---|---|---|---|---|---|---|---|---|---|---|---|---|---|---|---|---|---|---|
| 1 | HSA03060_PROTEIN_EXPORT | Genes involved in protein export | OXA1L, SEC61A2, SRP19, SRP54, SRP68, SRP72, SRP9, SRPR | 1 | SRP19(1) | 4968 | 1 | 1 | 1 | 0 | 1 | 0 | 0 | 0 | 0 | 0.83 | 0.04 | 1 |
| 2 | HSA00830_RETINOL_METABOLISM | Genes involved in retinol metabolism | ALDH1A1, ALDH1A2, BCMO1, RDH5 | 1 | RDH5(1) | 10620 | 1 | 1 | 1 | 0 | 1 | 0 | 0 | 0 | 0 | 0.64 | 0.075 | 1 |
| 3 | GANGLIOSIDE_BIOSYNTHESIS | B3GALT4, GALGT, SIAT4A, SIAT4B, SIAT7B, SIAT7D, SIAT9, ST3GAL1, ST3GAL2, ST3GAL4, ST3GAL5, ST6GALNAC2, ST6GALNAC4, ST8SIA1 | 1 | B3GALT4(1) | 11988 | 1 | 1 | 1 | 0 | 1 | 0 | 0 | 0 | 0 | 0.68 | 0.1 | 1 | |
| 4 | HSA00604_GLYCOSPHINGOLIPID_BIOSYNTHESIS_GANGLIOSERIES | Genes involved in glycosphingolipid biosynthesis - ganglioseries | B3GALT4, B4GALNT1, GLB1, HEXA, HEXB, LCT, SLC33A1, ST3GAL1, ST3GAL2, ST3GAL5, ST6GALNAC3, ST6GALNAC4, ST6GALNAC5, ST6GALNAC6, ST8SIA1, ST8SIA5 | 1 | B3GALT4(1) | 11988 | 1 | 1 | 1 | 0 | 1 | 0 | 0 | 0 | 0 | 0.68 | 0.1 | 1 |
| 5 | HSA05050_DENTATORUBROPALLIDOLUYSIAN_ATROPHY | Genes involved in dentatorubropallidoluysian atrophy (DRPLA) | ATN1, BAIAP2, CASP1, CASP3, CASP7, CASP8, GAPDH, INS, INSR, ITCH, MAGI1, MAGI2, RERE, WWP1, WWP2 | 1 | ATN1(1) | 34128 | 1 | 1 | 1 | 0 | 1 | 0 | 0 | 0 | 0 | 0.78 | 0.25 | 1 |
| 6 | HSA04360_AXON_GUIDANCE | Genes involved in axon guidance | ABL1, ABLIM1, ABLIM2, ABLIM3, ARHGEF12, CDC42, CDK5, CFL1, CFL2, CHP, CXCL12, CXCR4, DCC, DPYSL2, DPYSL5, EFNA1, EFNA2, EFNA3, EFNA4, EFNA5, EFNB1, EFNB2, EFNB3, EPHA1, EPHA2, EPHA3, EPHA4, EPHA5, EPHA6, EPHA7, EPHA8, EPHB1, EPHB2, EPHB3, EPHB4, EPHB6, FES, FYN, GNAI1, GNAI2, GNAI3, GSK3B, HRAS, ITGB1, KRAS, L1CAM, LIMK1, LIMK2, LRRC4C, MAPK1, MAPK3, MET, NCK1, NCK2, NFAT5, NFATC1, NFATC2, NFATC3, NFATC4, NGEF, NRAS, NRP1, NTN1, NTN2L, NTN4, NTNG1, PAK1, PAK2, PAK3, PAK4, PAK6, PAK7, PLXNA1, PLXNA2, PLXNA3, PLXNB1, PLXNB2, PLXNB3, PLXNC1, PPP3CA, PPP3CB, PPP3CC, PPP3R1, PPP3R2, PTK2, RAC1, RAC2, RAC3, RASA1, RGS3, RHOA, RHOD, RND1, ROBO1, ROBO2, ROBO3, ROCK1, ROCK2, SEMA3A, SEMA3B, SEMA3C, SEMA3D, SEMA3E, SEMA3F, SEMA3G, SEMA4A, SEMA4B, SEMA4C, SEMA4D, SEMA4F, SEMA4G, SEMA5A, SEMA5B, SEMA6A, SEMA6B, SEMA6C, SEMA6D, SEMA7A, SLIT1, SLIT2, SLIT3, SRGAP1, SRGAP2, SRGAP3, UNC5A, UNC5B, UNC5C, UNC5D | 2 | SEMA4G(1) | 43596 | 1 | 1 | 1 | 0 | 1 | 0 | 0 | 0 | 0 | 0.7 | 0.35 | 1 |
| 7 | RIBOSOMAL_PROTEINS | ANK2, APG10L, RPS23, B3GALT4, CDR1, DGKI, FAU, IL6ST, KIAA1394, LOC133957, MRPL19, NET_5, PIGK, RPL10, RPL11, RPL12, RPL13, RPL13, LOC388344, RPL13A, RPL13A, LOC283340, LOC387930, RPL14, RPL14, RPL14L, RPL15, RPL15, LOC136321, LOC402694, RPL17, RPL17, dJ612B15.1, RPL18, RPL18A, LOC285053, LOC347544, LOC390354, RPL18A, LOC390354, RPL19, RPL21, RPL21, LOC387753, LOC388143, LOC388532, LOC388621, LOC389156, LOC390488, LOC402336, LOC440487, LOC440575, RPL21, LOC387753, LOC388143, LOC388532, LOC388621, LOC389156, LOC390488, LOC440487, LOC440575, RPL22, RPL23, RPL24, RPL24, SLC36A2, RPL26, LOC391126, LOC392501, LOC400055, LOC441073, LOC441533, RPL27, RPL27A, RPL27A, LOC389435, RPL28, RPL29, RPL29, LOC283412, LOC284064, LOC389655, LOC391738, LOC401911, RPL3, RPL30, RPL31, RPL32, RPL34, LOC342994, RPL35, RPL35A, RPL36, RPL37, RPL38, RPL39, RPL3L, RPL4, RPL41, RPL5, RPL5, LOC388907, RPL5, RNU66, LOC388907, RPL6, RPL7, RPL7, LOC389305, RPL7, LOC90193, LOC388401, LOC389305, LOC392550, LOC439954, RPL7A, RPL7A, LOC133748, LOC388474, RPL7A, RNU36B, LOC133748, LOC388474, RPL8, RPL9, RPLP0, RPLP0, RPLP0_like, RPLP1, RPLP2, RPS10, RPS10, LOC158104, LOC388885, LOC389127, LOC390842, LOC401817, RPS10, LOC388885, RPS11, RPS12, RPS13, RPS14, RPS15, RPS16, RPS16, LOC441876, RPS17, RPS17, LOC402057, RPS18, RPS19, RPS2, RPS2, LOC91561, LOC148430, LOC286444, LOC400963, LOC440589, RPS20, RPS21, RPS23, RPS24, RPS25, RPS26, RPS26L, LOC440440, RPS27, RPS27A, RPS27A, LOC388720, LOC389425, RPS28, RPS29, RPS3, RPS3A, RPS3A, LOC146053, LOC400652, LOC401016, LOC439992, RPS4X, RPS4Y1, RPS5, RPS6, RPS6KA1, RPS6KA2, RPS6KA3, RPS6KA6, RPS6KB1, RPS6KB2, RPS7, RPS8, RPS9, RPSA, LOC388524, LOC388654, SCDR10, TBC1D10C, TSPAN9, UBA52, UBB, UBC | 7 | B3GALT4(1) | 59184 | 1 | 1 | 1 | 0 | 1 | 0 | 0 | 0 | 0 | 0.7 | 0.38 | 1 | |
| 8 | HSA01031_GLYCAN_STRUCTURES_BIOSYNTHESIS_2 | Genes involved in glycan structures - biosynthesis 2 | A4GALT, ABO, B3GALNT1, B3GALT1, B3GALT2, B3GALT4, B3GALT5, B3GNT1, B3GNT2, B3GNT3, B3GNT4, B3GNT5, B4GALNT1, B4GALT1, B4GALT2, B4GALT3, B4GALT4, B4GALT6, FUT1, FUT2, FUT3, FUT4, FUT5, FUT6, FUT7, FUT9, GBGT1, GCNT2, PIGA, PIGB, PIGC, PIGF, PIGG, PIGH, PIGK, PIGL, PIGM, PIGN, PIGO, PIGP, PIGQ, PIGS, PIGT, PIGU, PIGV, PIGX, PIGZ, ST3GAL1, ST3GAL2, ST3GAL3, ST3GAL4, ST3GAL5, ST3GAL6, ST6GALNAC3, ST6GALNAC4, ST6GALNAC5, ST6GALNAC6, ST8SIA1, ST8SIA5, UGCG, UGCGL1, UGCGL2 | 4 | B3GALT4(1) | 106164 | 1 | 1 | 1 | 1 | 1 | 0 | 0 | 0 | 0 | 0.9 | 0.61 | 1 |
| 9 | AMINOACYL_TRNA_BIOSYNTHESIS | AARS, CARS, DARS, EPRS, FARS2, FARSLB, GARS, HARS, HARSL, IARS, KARS, LARS, LARS2, MARS, MARS2, NARS, QARS, RARS, SARS, TARS, WARS, WARS2, YARS | 1 | 45180 | 0 | 0 | 0 | 0 | 0 | 0 | 0 | 0 | 0 | 1 | 1 | 1 | ||
| 10 | APOPTOSIS_GENMAPP | APAF1, BAK1, BCL2L7P1, BAX, BCL2, BCL2L1, BID, BIRC2, BIRC3, BIRC4, CASP2, CASP3, CASP6, CASP7, CASP8, CASP9, CYCS, FADD, FAS, FASLG, GZMB, IKBKG, JUN, MAP2K4, MAP3K1, MAP3K14, MAPK10, MCL1, MDM2, MYC, NFKB1, NFKBIA, PARP1, PRF1, RELA, RIPK1, TNF, TNFRSF1A, TNFRSF1B, TNFSF10, TP53, TRADD, TRAF1, TRAF2 | 1 | 38736 | 0 | 0 | 0 | 0 | 0 | 0 | 0 | 0 | 0 | 1 | 1 | 1 |
In brief, we tabulate the number of mutations and the number of covered bases for each gene. The counts are broken down by mutation context category: four context categories that are discovered by MutSig, and one for indel and 'null' mutations, which include indels, nonsense mutations, splice-site mutations, and non-stop (read-through) mutations. For each gene, we calculate the probability of seeing the observed constellation of mutations, i.e. the product P1 x P2 x ... x Pm, or a more extreme one, given the background mutation rates calculated across the dataset.[1]
This is an experimental feature. The full results of the analysis summarized in this report can be downloaded from the TCGA Data Coordination Center.