This pipeline computes the correlation between cancer subtypes identified by different molecular patterns and selected clinical features.
Testing the association between subtypes identified by 7 different clustering approaches and 10 clinical features across 585 patients, 12 significant findings detected with P value < 0.05.
-
CNMF clustering analysis on array-based mRNA expression data identified 4 subtypes that correlate to 'PRIMARY.SITE.OF.DISEASE', 'HISTOLOGICAL.TYPE', 'PATHOLOGY.N', and 'PATHOLOGICSPREAD(M)'.
-
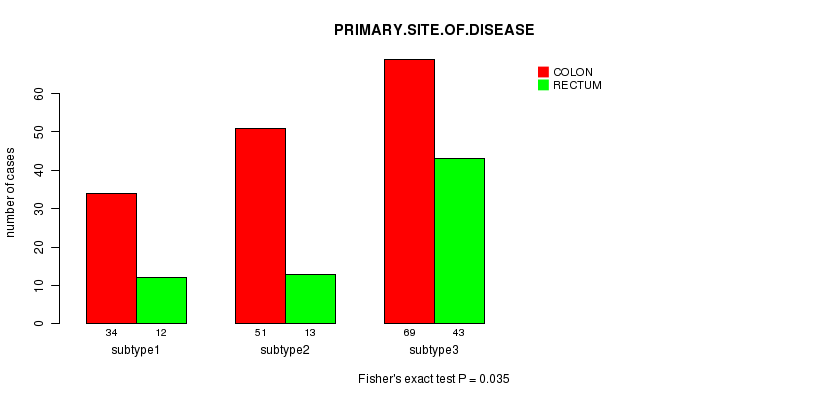
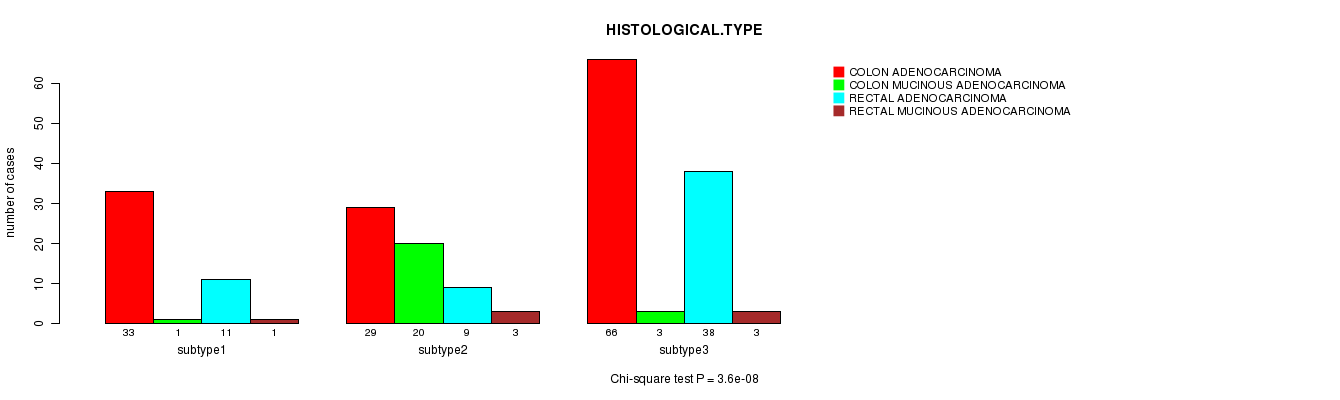
Consensus hierarchical clustering analysis on array-based mRNA expression data identified 3 subtypes that correlate to 'PRIMARY.SITE.OF.DISEASE' and 'HISTOLOGICAL.TYPE'.
-
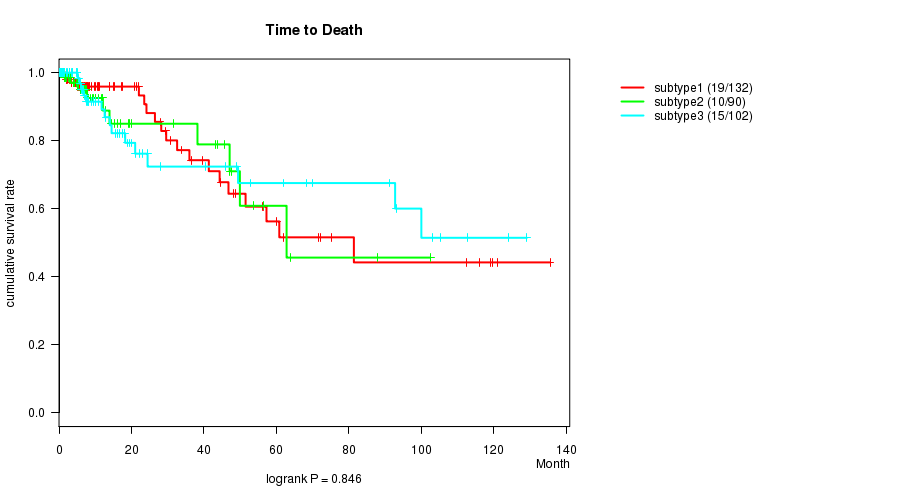
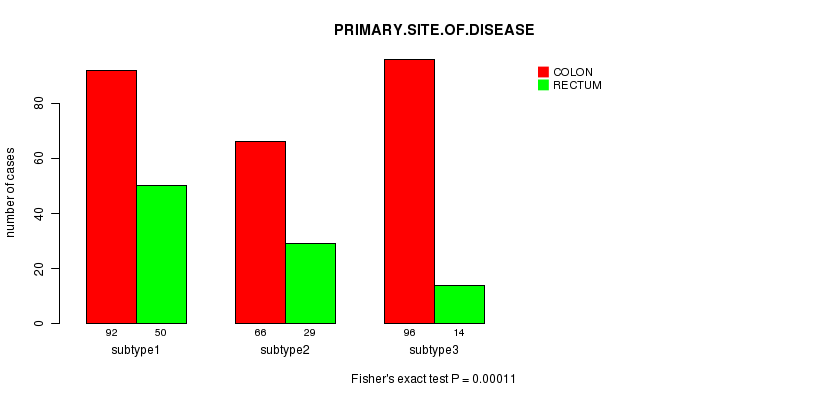
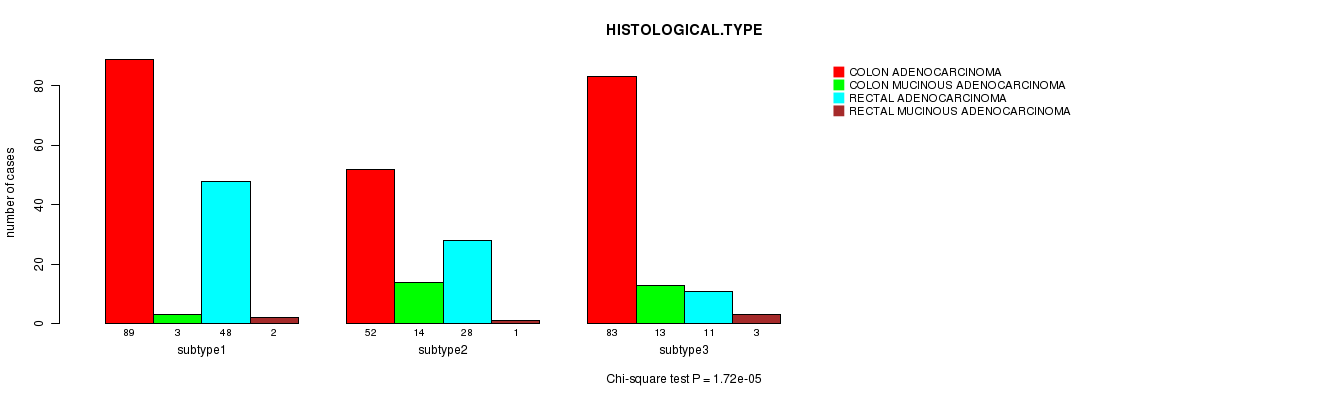
3 subtypes identified in current cancer cohort by 'METHLYATION CNMF'. These subtypes correlate to 'PRIMARY.SITE.OF.DISEASE' and 'HISTOLOGICAL.TYPE'.
-
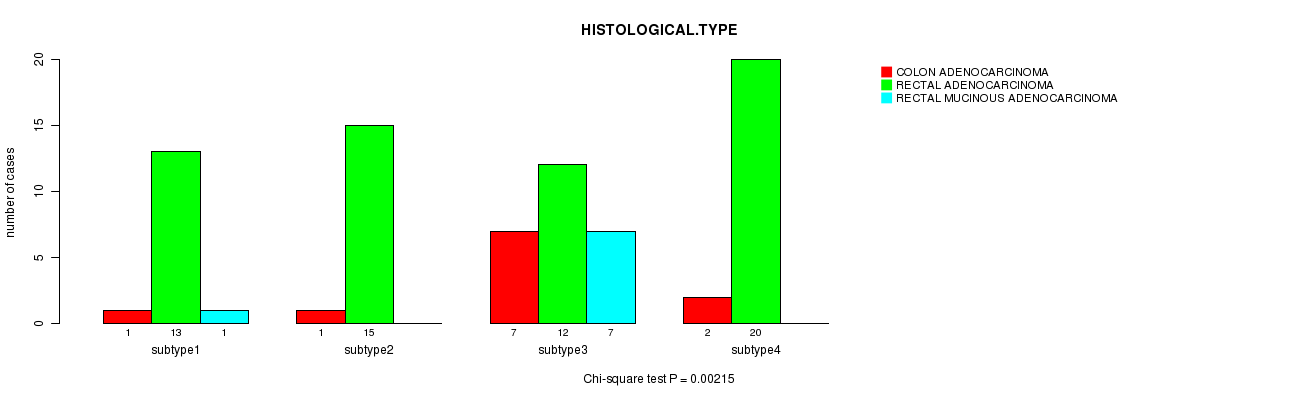
CNMF clustering analysis on sequencing-based mRNA expression data identified 4 subtypes that correlate to 'HISTOLOGICAL.TYPE'.
-
Consensus hierarchical clustering analysis on sequencing-based mRNA expression data identified 4 subtypes that correlate to 'HISTOLOGICAL.TYPE'.
-
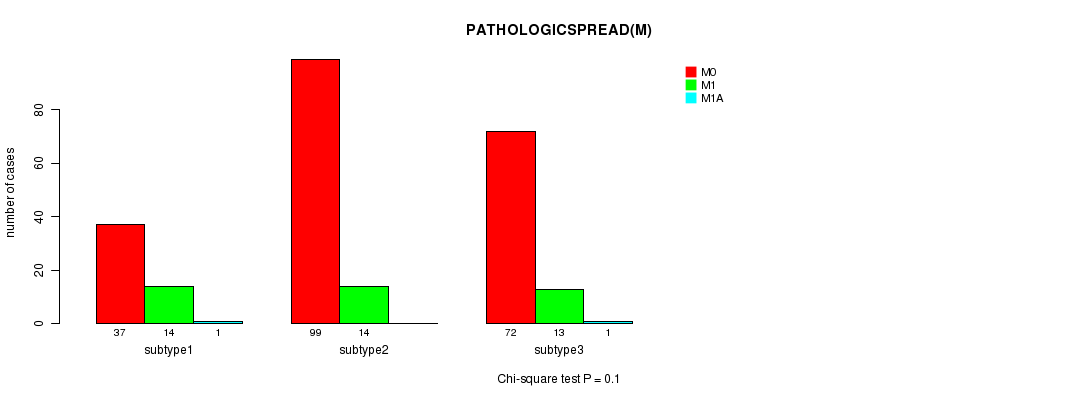
CNMF clustering analysis on sequencing-based miR expression data identified 3 subtypes that correlate to 'PATHOLOGY.N' and 'NEOADJUVANT.THERAPY'.
-
Consensus hierarchical clustering analysis on sequencing-based miR expression data identified 2 subtypes that do not correlate to any clinical features.
Table 1. Get Full Table Overview of the association between subtypes identified by 7 different clustering approaches and 10 clinical features. Shown in the table are P values from statistical tests. Thresholded by P value < 0.05, 12 significant findings detected.
|
Clinical Features |
Statistical Tests |
mRNA CNMF subtypes |
mRNA cHierClus subtypes |
METHLYATION CNMF |
RNAseq CNMF subtypes |
RNAseq cHierClus subtypes |
MIRseq CNMF subtypes |
MIRseq cHierClus subtypes |
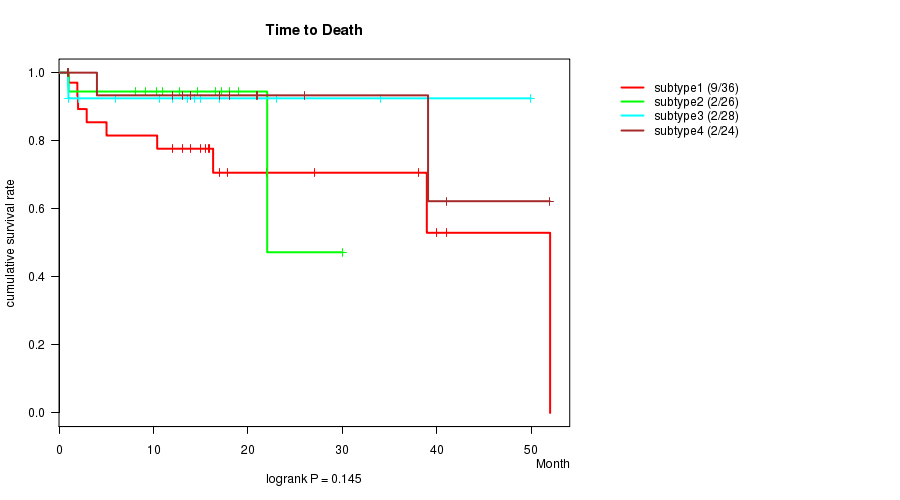
| Time to Death | logrank test | 0.145 | 0.805 | 0.846 | 0.12 | 0.176 | 0.0895 | 0.738 |
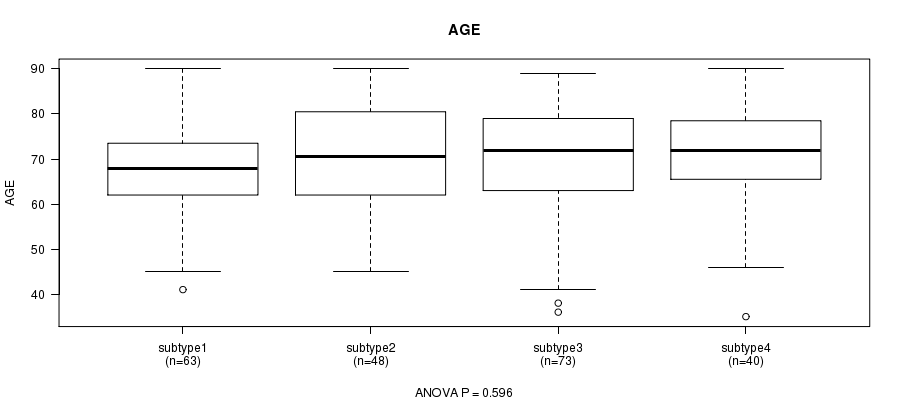
| AGE | t-test | 0.596 | 0.148 | 0.135 | 0.416 | 0.884 | 0.82 | 0.472 |
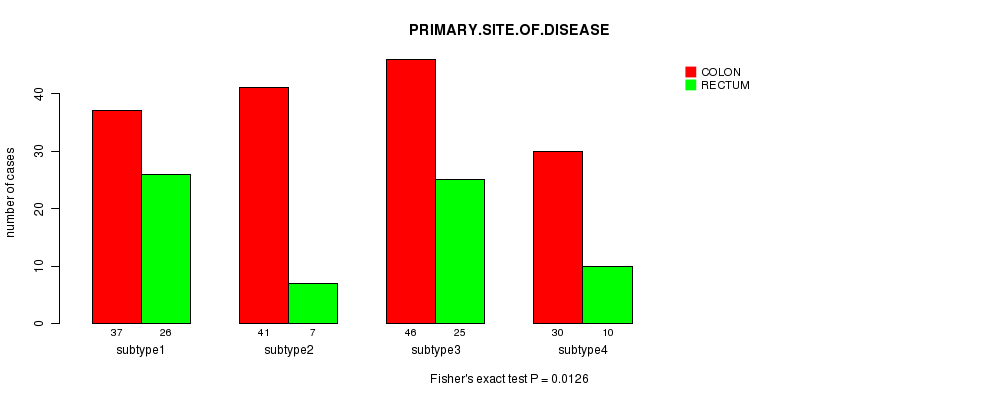
| PRIMARY SITE OF DISEASE | Fisher's exact test | 0.0126 | 0.035 | 0.00011 | 0.111 | 0.265 | 0.965 | 0.76 |
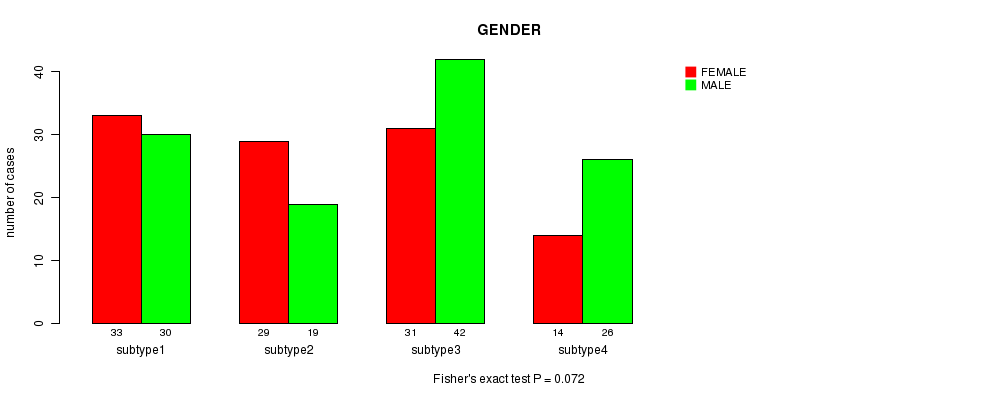
| GENDER | Fisher's exact test | 0.072 | 0.796 | 0.162 | 0.869 | 0.924 | 0.653 | 0.42 |
| HISTOLOGICAL TYPE | Chi-square test | 6.39e-07 | 3.6e-08 | 1.72e-05 | 0.0132 | 0.00215 | 0.942 | 0.513 |
| PATHOLOGY T | Chi-square test | 0.184 | 0.866 | 0.177 | 0.439 | 0.71 | 0.331 | 0.208 |
| PATHOLOGY N | Chi-square test | 0.00595 | 0.65 | 0.529 | 0.872 | 0.969 | 0.0292 | 0.946 |
| PATHOLOGICSPREAD(M) | Chi-square test | 0.00173 | 0.498 | 0.578 | 0.28 | 0.852 | 0.1 | 0.313 |
| RADIATIONS RADIATION REGIMENINDICATION | Fisher's exact test | 0.393 | 0.496 | 0.0864 | 0.41 | 1 | 0.553 | 0.314 |
| NEOADJUVANT THERAPY | Fisher's exact test | 0.127 | 0.712 | 0.626 | 0.41 | 1 | 0.0117 | 0.237 |
Table S1. Get Full Table Description of clustering approach #1: 'mRNA CNMF subtypes'
| Cluster Labels | 1 | 2 | 3 | 4 |
|---|---|---|---|---|
| Number of samples | 63 | 48 | 73 | 40 |
P value = 0.145 (logrank test)
Table S2. Clustering Approach #1: 'mRNA CNMF subtypes' versus Clinical Feature #1: 'Time to Death'
| nPatients | nDeath | Duration Range (Median), Month | |
|---|---|---|---|
| ALL | 114 | 15 | 0.9 - 52.0 (5.5) |
| subtype1 | 36 | 9 | 1.0 - 52.0 (13.0) |
| subtype2 | 26 | 2 | 1.0 - 30.0 (1.0) |
| subtype3 | 28 | 2 | 0.9 - 49.9 (1.0) |
| subtype4 | 24 | 2 | 0.9 - 52.0 (12.5) |
Figure S1. Get High-res Image Clustering Approach #1: 'mRNA CNMF subtypes' versus Clinical Feature #1: 'Time to Death'
P value = 0.596 (ANOVA)
Table S3. Clustering Approach #1: 'mRNA CNMF subtypes' versus Clinical Feature #2: 'AGE'
| nPatients | Mean (Std.Dev) | |
|---|---|---|
| ALL | 224 | 69.3 (11.5) |
| subtype1 | 63 | 67.7 (9.7) |
| subtype2 | 48 | 70.3 (11.8) |
| subtype3 | 73 | 69.6 (12.3) |
| subtype4 | 40 | 70.2 (12.2) |
Figure S2. Get High-res Image Clustering Approach #1: 'mRNA CNMF subtypes' versus Clinical Feature #2: 'AGE'
P value = 0.0126 (Fisher's exact test)
Table S4. Clustering Approach #1: 'mRNA CNMF subtypes' versus Clinical Feature #3: 'PRIMARY.SITE.OF.DISEASE'
| nPatients | COLON | RECTUM |
|---|---|---|
| ALL | 154 | 68 |
| subtype1 | 37 | 26 |
| subtype2 | 41 | 7 |
| subtype3 | 46 | 25 |
| subtype4 | 30 | 10 |
Figure S3. Get High-res Image Clustering Approach #1: 'mRNA CNMF subtypes' versus Clinical Feature #3: 'PRIMARY.SITE.OF.DISEASE'
P value = 0.072 (Fisher's exact test)
Table S5. Clustering Approach #1: 'mRNA CNMF subtypes' versus Clinical Feature #4: 'GENDER'
| nPatients | FEMALE | MALE |
|---|---|---|
| ALL | 117 | 107 |
| subtype1 | 30 | 33 |
| subtype2 | 19 | 29 |
| subtype3 | 42 | 31 |
| subtype4 | 26 | 14 |
Figure S4. Get High-res Image Clustering Approach #1: 'mRNA CNMF subtypes' versus Clinical Feature #4: 'GENDER'
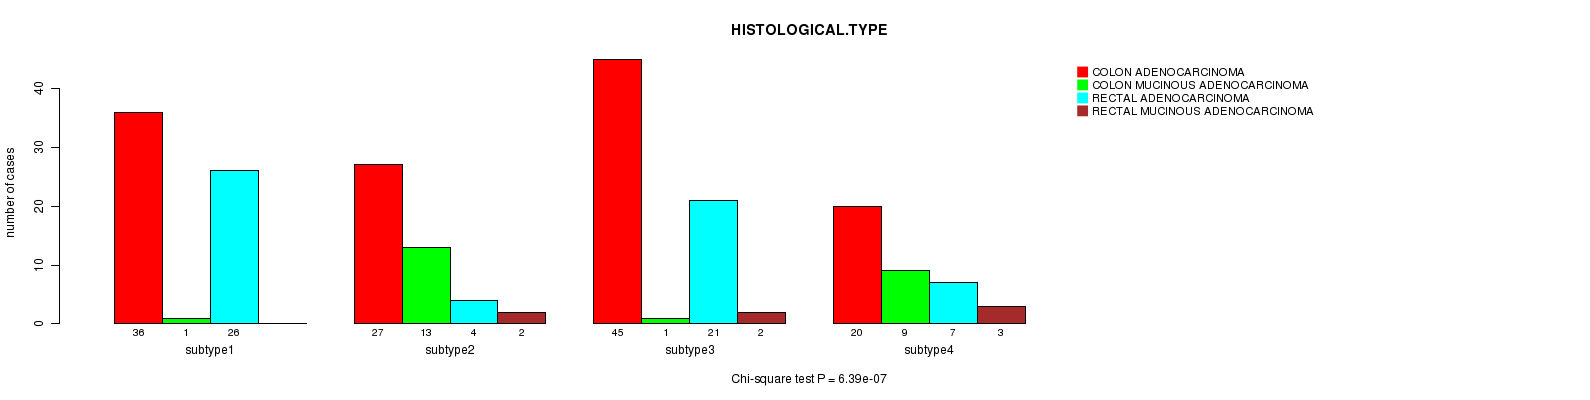
P value = 6.39e-07 (Chi-square test)
Table S6. Clustering Approach #1: 'mRNA CNMF subtypes' versus Clinical Feature #5: 'HISTOLOGICAL.TYPE'
| nPatients | COLON ADENOCARCINOMA | COLON MUCINOUS ADENOCARCINOMA | RECTAL ADENOCARCINOMA | RECTAL MUCINOUS ADENOCARCINOMA |
|---|---|---|---|---|
| ALL | 128 | 24 | 58 | 7 |
| subtype1 | 36 | 1 | 26 | 0 |
| subtype2 | 27 | 13 | 4 | 2 |
| subtype3 | 45 | 1 | 21 | 2 |
| subtype4 | 20 | 9 | 7 | 3 |
Figure S5. Get High-res Image Clustering Approach #1: 'mRNA CNMF subtypes' versus Clinical Feature #5: 'HISTOLOGICAL.TYPE'
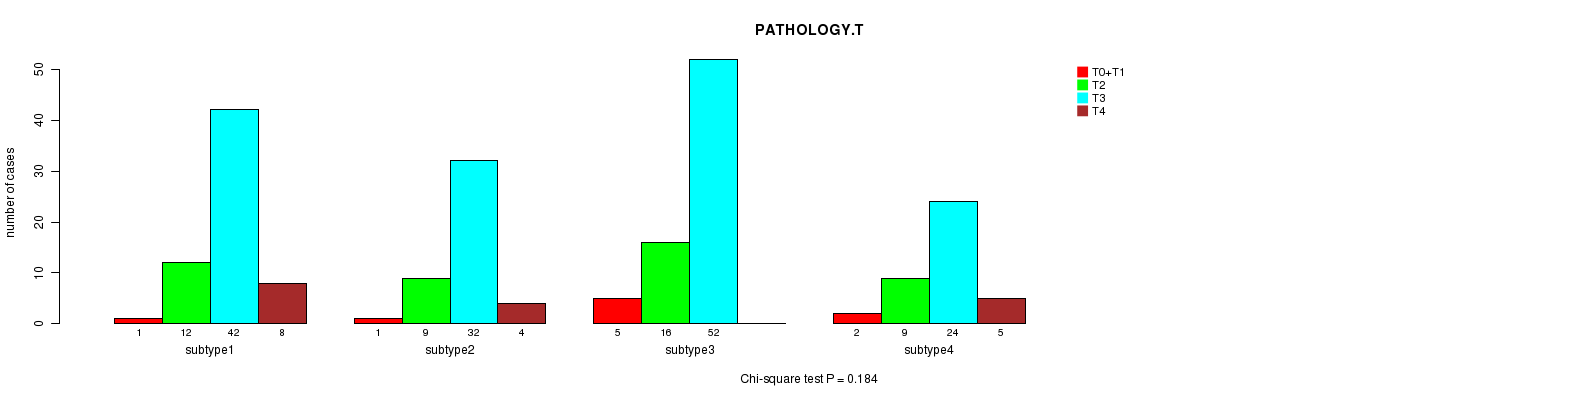
P value = 0.184 (Chi-square test)
Table S7. Clustering Approach #1: 'mRNA CNMF subtypes' versus Clinical Feature #6: 'PATHOLOGY.T'
| nPatients | T0+T1 | T2 | T3 | T4 |
|---|---|---|---|---|
| ALL | 9 | 46 | 150 | 17 |
| subtype1 | 1 | 12 | 42 | 8 |
| subtype2 | 1 | 9 | 32 | 4 |
| subtype3 | 5 | 16 | 52 | 0 |
| subtype4 | 2 | 9 | 24 | 5 |
Figure S6. Get High-res Image Clustering Approach #1: 'mRNA CNMF subtypes' versus Clinical Feature #6: 'PATHOLOGY.T'
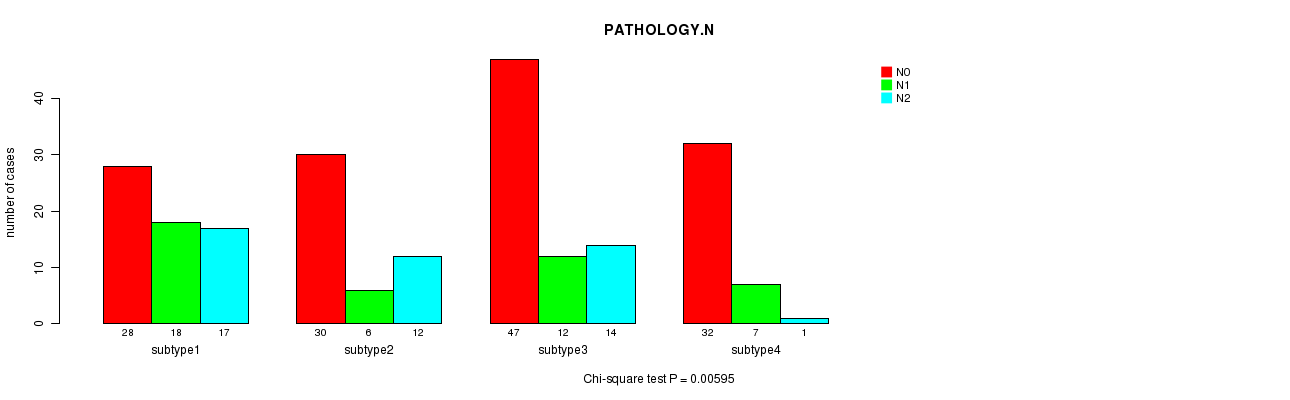
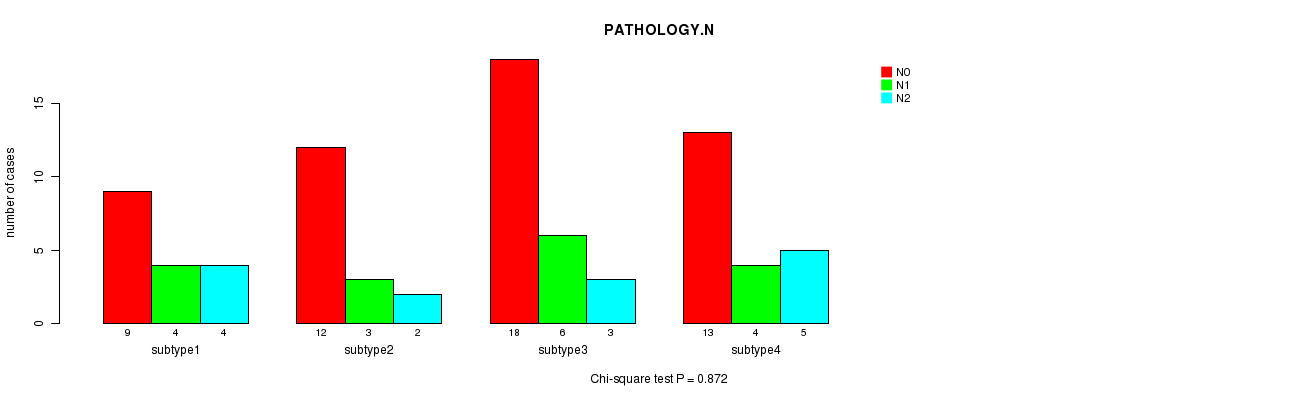
P value = 0.00595 (Chi-square test)
Table S8. Clustering Approach #1: 'mRNA CNMF subtypes' versus Clinical Feature #7: 'PATHOLOGY.N'
| nPatients | N0 | N1 | N2 |
|---|---|---|---|
| ALL | 137 | 43 | 44 |
| subtype1 | 28 | 18 | 17 |
| subtype2 | 30 | 6 | 12 |
| subtype3 | 47 | 12 | 14 |
| subtype4 | 32 | 7 | 1 |
Figure S7. Get High-res Image Clustering Approach #1: 'mRNA CNMF subtypes' versus Clinical Feature #7: 'PATHOLOGY.N'
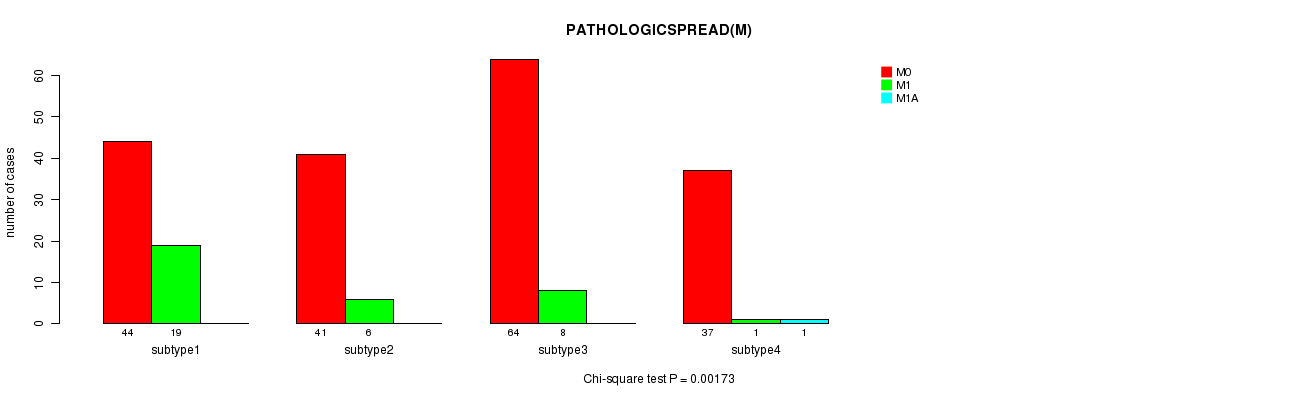
P value = 0.00173 (Chi-square test)
Table S9. Clustering Approach #1: 'mRNA CNMF subtypes' versus Clinical Feature #8: 'PATHOLOGICSPREAD(M)'
| nPatients | M0 | M1 | M1A |
|---|---|---|---|
| ALL | 186 | 34 | 1 |
| subtype1 | 44 | 19 | 0 |
| subtype2 | 41 | 6 | 0 |
| subtype3 | 64 | 8 | 0 |
| subtype4 | 37 | 1 | 1 |
Figure S8. Get High-res Image Clustering Approach #1: 'mRNA CNMF subtypes' versus Clinical Feature #8: 'PATHOLOGICSPREAD(M)'
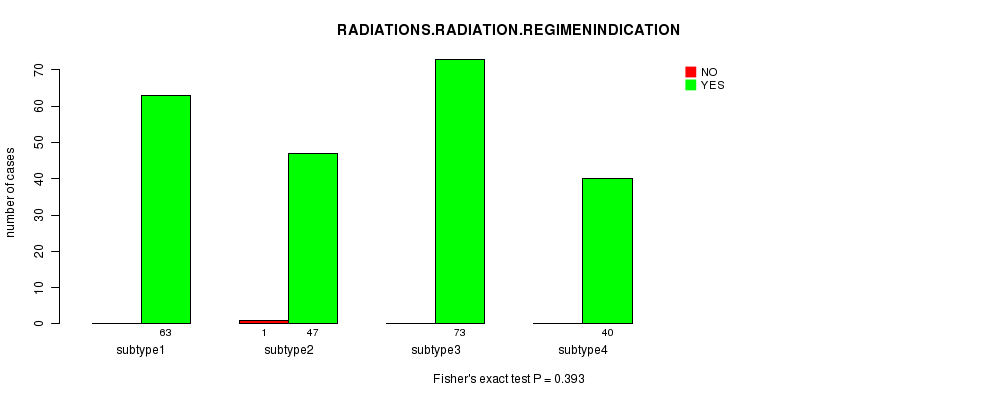
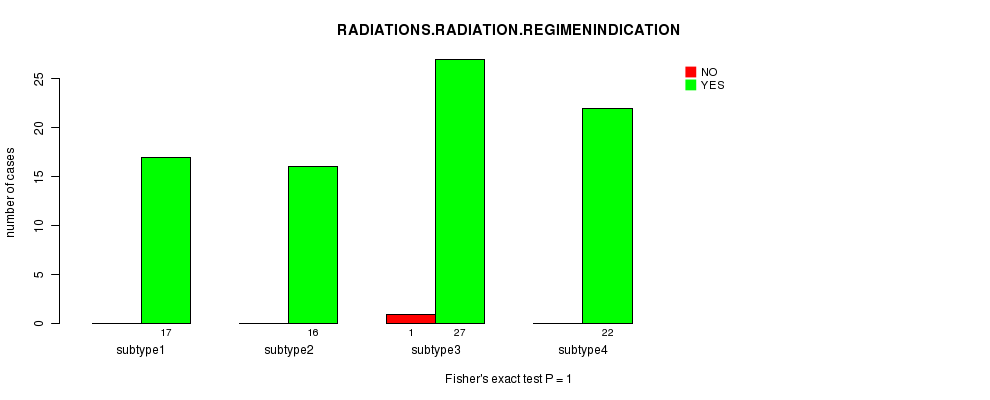
P value = 0.393 (Fisher's exact test)
Table S10. Clustering Approach #1: 'mRNA CNMF subtypes' versus Clinical Feature #9: 'RADIATIONS.RADIATION.REGIMENINDICATION'
| nPatients | NO | YES |
|---|---|---|
| ALL | 223 | 1 |
| subtype1 | 63 | 0 |
| subtype2 | 47 | 1 |
| subtype3 | 73 | 0 |
| subtype4 | 40 | 0 |
Figure S9. Get High-res Image Clustering Approach #1: 'mRNA CNMF subtypes' versus Clinical Feature #9: 'RADIATIONS.RADIATION.REGIMENINDICATION'
P value = 0.127 (Fisher's exact test)
Table S11. Clustering Approach #1: 'mRNA CNMF subtypes' versus Clinical Feature #10: 'NEOADJUVANT.THERAPY'
| nPatients | NO | YES |
|---|---|---|
| ALL | 216 | 8 |
| subtype1 | 60 | 3 |
| subtype2 | 44 | 4 |
| subtype3 | 72 | 1 |
| subtype4 | 40 | 0 |
Figure S10. Get High-res Image Clustering Approach #1: 'mRNA CNMF subtypes' versus Clinical Feature #10: 'NEOADJUVANT.THERAPY'
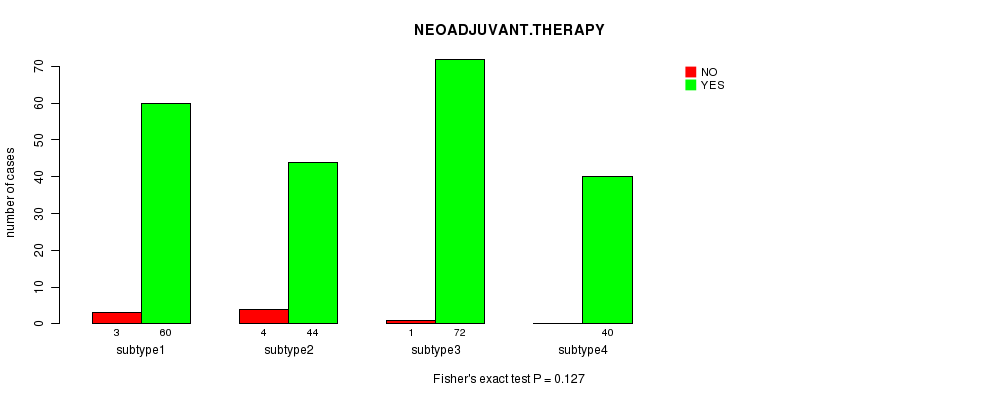
Table S12. Get Full Table Description of clustering approach #2: 'mRNA cHierClus subtypes'
| Cluster Labels | 1 | 2 | 3 |
|---|---|---|---|
| Number of samples | 47 | 64 | 113 |
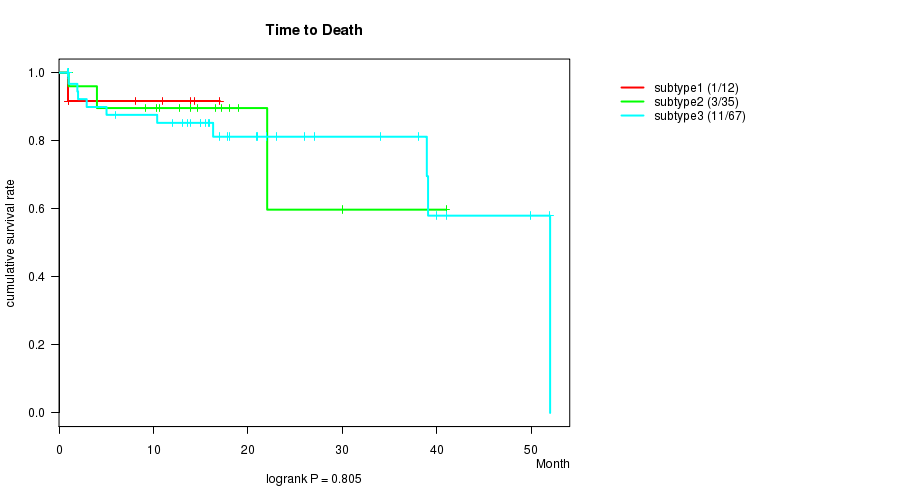
P value = 0.805 (logrank test)
Table S13. Clustering Approach #2: 'mRNA cHierClus subtypes' versus Clinical Feature #1: 'Time to Death'
| nPatients | nDeath | Duration Range (Median), Month | |
|---|---|---|---|
| ALL | 114 | 15 | 0.9 - 52.0 (5.5) |
| subtype1 | 12 | 1 | 0.9 - 17.0 (1.0) |
| subtype2 | 35 | 3 | 1.0 - 41.0 (1.0) |
| subtype3 | 67 | 11 | 0.9 - 52.0 (12.0) |
Figure S11. Get High-res Image Clustering Approach #2: 'mRNA cHierClus subtypes' versus Clinical Feature #1: 'Time to Death'
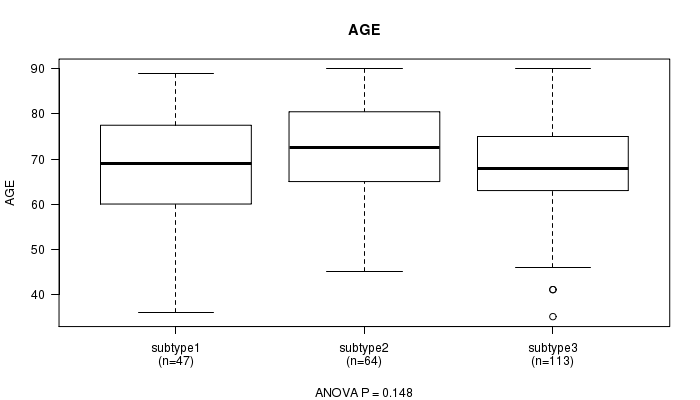
P value = 0.148 (ANOVA)
Table S14. Clustering Approach #2: 'mRNA cHierClus subtypes' versus Clinical Feature #2: 'AGE'
| nPatients | Mean (Std.Dev) | |
|---|---|---|
| ALL | 224 | 69.3 (11.5) |
| subtype1 | 47 | 67.5 (13.0) |
| subtype2 | 64 | 71.6 (11.3) |
| subtype3 | 113 | 68.8 (10.8) |
Figure S12. Get High-res Image Clustering Approach #2: 'mRNA cHierClus subtypes' versus Clinical Feature #2: 'AGE'
P value = 0.035 (Fisher's exact test)
Table S15. Clustering Approach #2: 'mRNA cHierClus subtypes' versus Clinical Feature #3: 'PRIMARY.SITE.OF.DISEASE'
| nPatients | COLON | RECTUM |
|---|---|---|
| ALL | 154 | 68 |
| subtype1 | 34 | 12 |
| subtype2 | 51 | 13 |
| subtype3 | 69 | 43 |
Figure S13. Get High-res Image Clustering Approach #2: 'mRNA cHierClus subtypes' versus Clinical Feature #3: 'PRIMARY.SITE.OF.DISEASE'
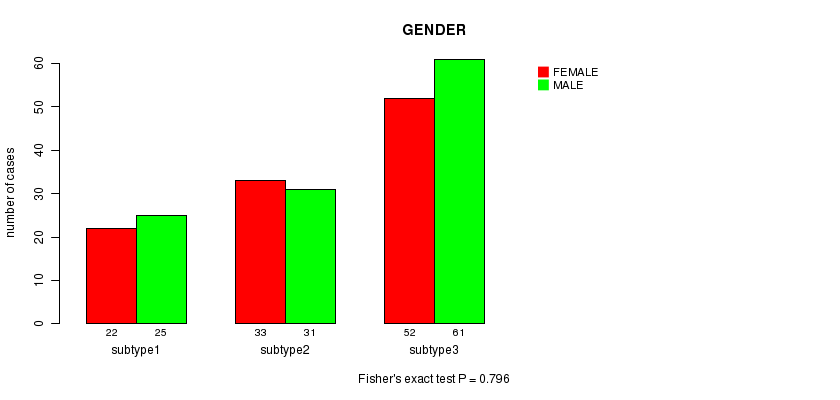
P value = 0.796 (Fisher's exact test)
Table S16. Clustering Approach #2: 'mRNA cHierClus subtypes' versus Clinical Feature #4: 'GENDER'
| nPatients | FEMALE | MALE |
|---|---|---|
| ALL | 117 | 107 |
| subtype1 | 25 | 22 |
| subtype2 | 31 | 33 |
| subtype3 | 61 | 52 |
Figure S14. Get High-res Image Clustering Approach #2: 'mRNA cHierClus subtypes' versus Clinical Feature #4: 'GENDER'
P value = 3.6e-08 (Chi-square test)
Table S17. Clustering Approach #2: 'mRNA cHierClus subtypes' versus Clinical Feature #5: 'HISTOLOGICAL.TYPE'
| nPatients | COLON ADENOCARCINOMA | COLON MUCINOUS ADENOCARCINOMA | RECTAL ADENOCARCINOMA | RECTAL MUCINOUS ADENOCARCINOMA |
|---|---|---|---|---|
| ALL | 128 | 24 | 58 | 7 |
| subtype1 | 33 | 1 | 11 | 1 |
| subtype2 | 29 | 20 | 9 | 3 |
| subtype3 | 66 | 3 | 38 | 3 |
Figure S15. Get High-res Image Clustering Approach #2: 'mRNA cHierClus subtypes' versus Clinical Feature #5: 'HISTOLOGICAL.TYPE'
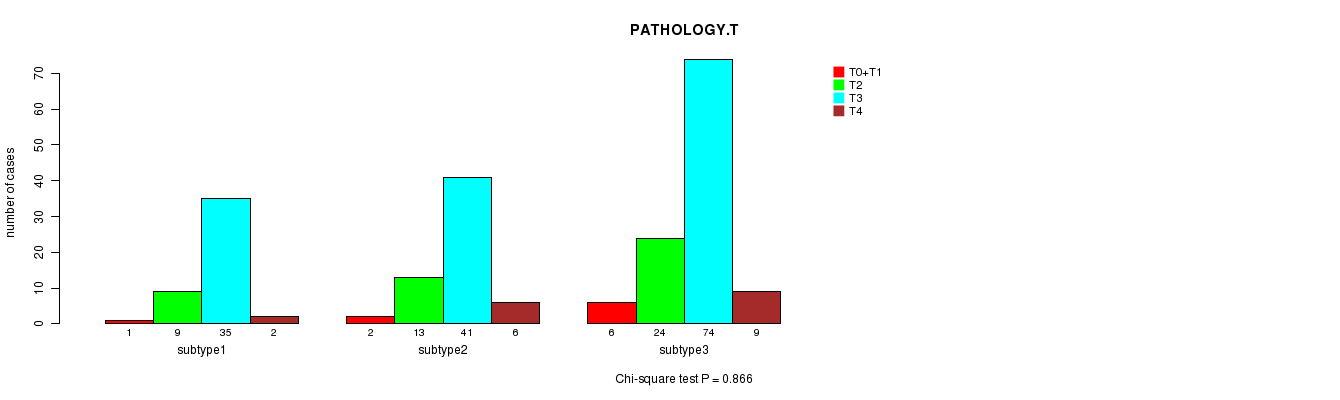
P value = 0.866 (Chi-square test)
Table S18. Clustering Approach #2: 'mRNA cHierClus subtypes' versus Clinical Feature #6: 'PATHOLOGY.T'
| nPatients | T0+T1 | T2 | T3 | T4 |
|---|---|---|---|---|
| ALL | 9 | 46 | 150 | 17 |
| subtype1 | 1 | 9 | 35 | 2 |
| subtype2 | 2 | 13 | 41 | 6 |
| subtype3 | 6 | 24 | 74 | 9 |
Figure S16. Get High-res Image Clustering Approach #2: 'mRNA cHierClus subtypes' versus Clinical Feature #6: 'PATHOLOGY.T'
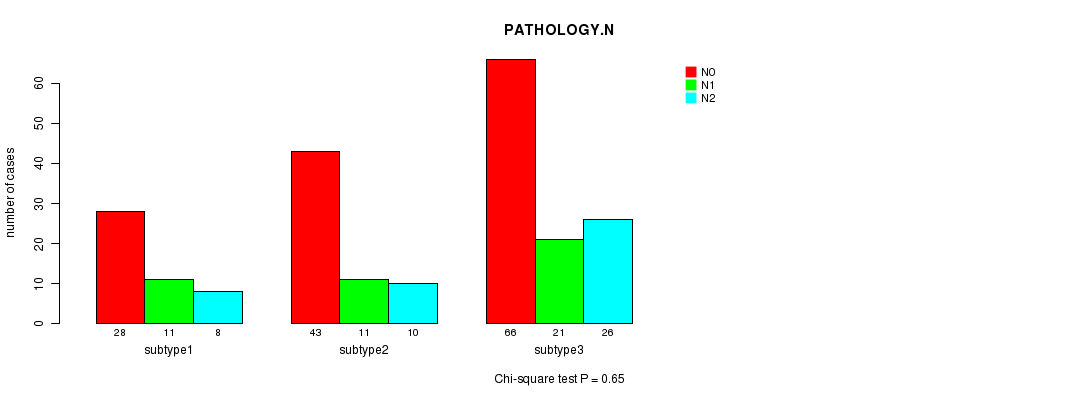
P value = 0.65 (Chi-square test)
Table S19. Clustering Approach #2: 'mRNA cHierClus subtypes' versus Clinical Feature #7: 'PATHOLOGY.N'
| nPatients | N0 | N1 | N2 |
|---|---|---|---|
| ALL | 137 | 43 | 44 |
| subtype1 | 28 | 11 | 8 |
| subtype2 | 43 | 11 | 10 |
| subtype3 | 66 | 21 | 26 |
Figure S17. Get High-res Image Clustering Approach #2: 'mRNA cHierClus subtypes' versus Clinical Feature #7: 'PATHOLOGY.N'
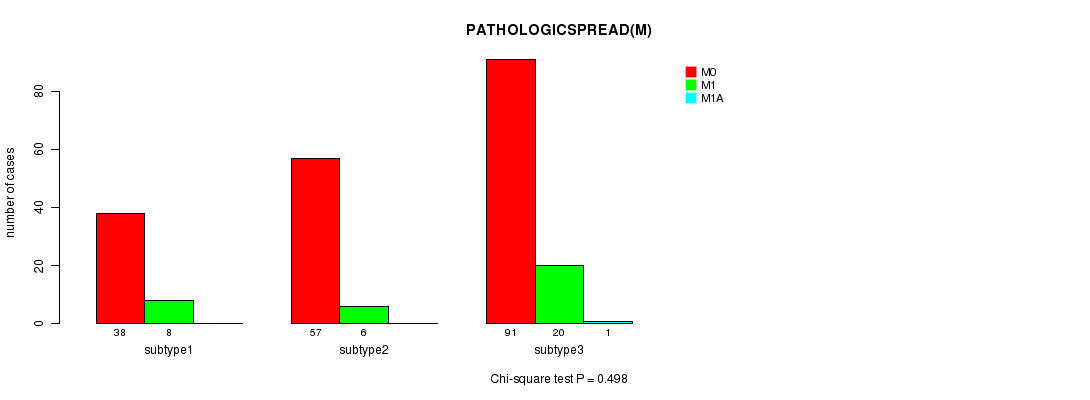
P value = 0.498 (Chi-square test)
Table S20. Clustering Approach #2: 'mRNA cHierClus subtypes' versus Clinical Feature #8: 'PATHOLOGICSPREAD(M)'
| nPatients | M0 | M1 | M1A |
|---|---|---|---|
| ALL | 186 | 34 | 1 |
| subtype1 | 38 | 8 | 0 |
| subtype2 | 57 | 6 | 0 |
| subtype3 | 91 | 20 | 1 |
Figure S18. Get High-res Image Clustering Approach #2: 'mRNA cHierClus subtypes' versus Clinical Feature #8: 'PATHOLOGICSPREAD(M)'
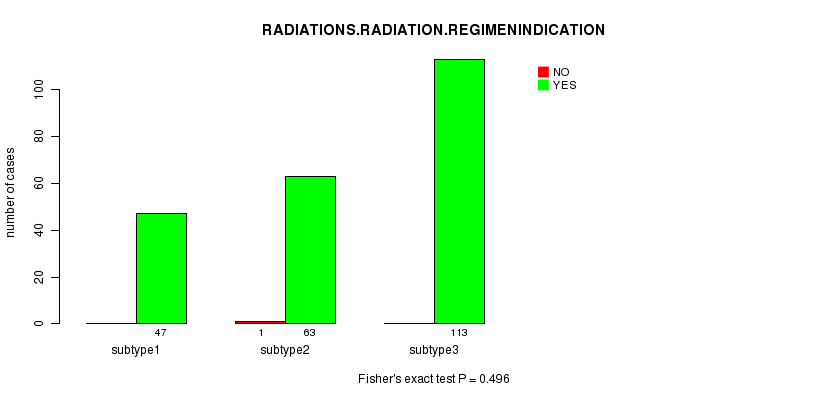
P value = 0.496 (Fisher's exact test)
Table S21. Clustering Approach #2: 'mRNA cHierClus subtypes' versus Clinical Feature #9: 'RADIATIONS.RADIATION.REGIMENINDICATION'
| nPatients | NO | YES |
|---|---|---|
| ALL | 223 | 1 |
| subtype1 | 47 | 0 |
| subtype2 | 63 | 1 |
| subtype3 | 113 | 0 |
Figure S19. Get High-res Image Clustering Approach #2: 'mRNA cHierClus subtypes' versus Clinical Feature #9: 'RADIATIONS.RADIATION.REGIMENINDICATION'
P value = 0.712 (Fisher's exact test)
Table S22. Clustering Approach #2: 'mRNA cHierClus subtypes' versus Clinical Feature #10: 'NEOADJUVANT.THERAPY'
| nPatients | NO | YES |
|---|---|---|
| ALL | 216 | 8 |
| subtype1 | 45 | 2 |
| subtype2 | 61 | 3 |
| subtype3 | 110 | 3 |
Figure S20. Get High-res Image Clustering Approach #2: 'mRNA cHierClus subtypes' versus Clinical Feature #10: 'NEOADJUVANT.THERAPY'
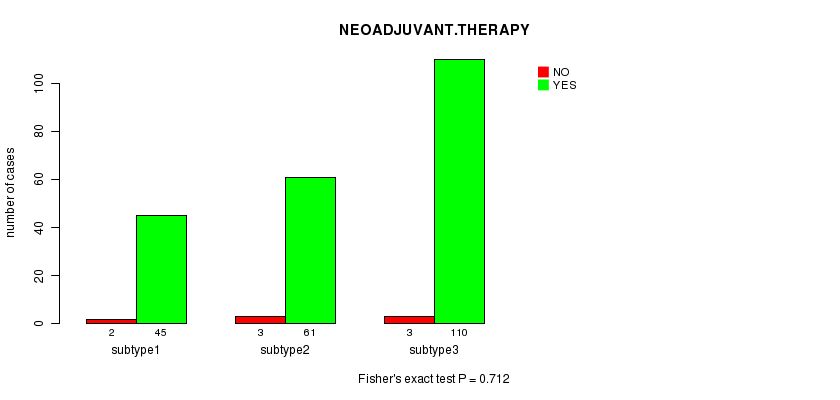
Table S23. Get Full Table Description of clustering approach #3: 'METHLYATION CNMF'
| Cluster Labels | 1 | 2 | 3 |
|---|---|---|---|
| Number of samples | 142 | 97 | 110 |
P value = 0.846 (logrank test)
Table S24. Clustering Approach #3: 'METHLYATION CNMF' versus Clinical Feature #1: 'Time to Death'
| nPatients | nDeath | Duration Range (Median), Month | |
|---|---|---|---|
| ALL | 324 | 44 | 0.1 - 135.5 (7.0) |
| subtype1 | 132 | 19 | 0.1 - 135.5 (7.2) |
| subtype2 | 90 | 10 | 0.1 - 102.4 (6.0) |
| subtype3 | 102 | 15 | 0.1 - 129.1 (7.2) |
Figure S21. Get High-res Image Clustering Approach #3: 'METHLYATION CNMF' versus Clinical Feature #1: 'Time to Death'
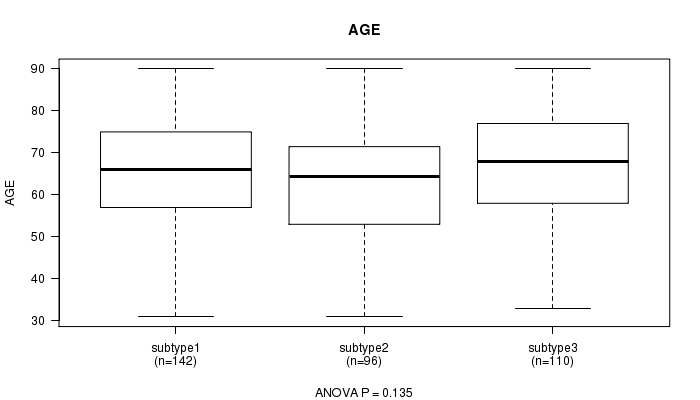
P value = 0.135 (ANOVA)
Table S25. Clustering Approach #3: 'METHLYATION CNMF' versus Clinical Feature #2: 'AGE'
| nPatients | Mean (Std.Dev) | |
|---|---|---|
| ALL | 348 | 64.8 (13.0) |
| subtype1 | 142 | 65.1 (12.7) |
| subtype2 | 96 | 62.7 (12.8) |
| subtype3 | 110 | 66.3 (13.5) |
Figure S22. Get High-res Image Clustering Approach #3: 'METHLYATION CNMF' versus Clinical Feature #2: 'AGE'
P value = 0.00011 (Fisher's exact test)
Table S26. Clustering Approach #3: 'METHLYATION CNMF' versus Clinical Feature #3: 'PRIMARY.SITE.OF.DISEASE'
| nPatients | COLON | RECTUM |
|---|---|---|
| ALL | 254 | 93 |
| subtype1 | 92 | 50 |
| subtype2 | 66 | 29 |
| subtype3 | 96 | 14 |
Figure S23. Get High-res Image Clustering Approach #3: 'METHLYATION CNMF' versus Clinical Feature #3: 'PRIMARY.SITE.OF.DISEASE'
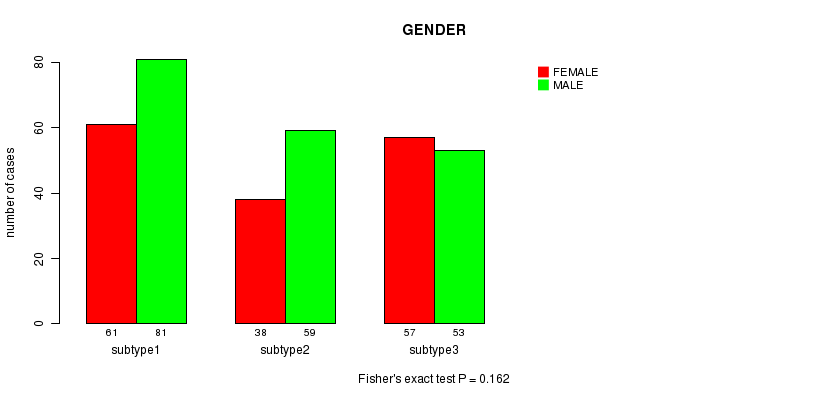
P value = 0.162 (Fisher's exact test)
Table S27. Clustering Approach #3: 'METHLYATION CNMF' versus Clinical Feature #4: 'GENDER'
| nPatients | FEMALE | MALE |
|---|---|---|
| ALL | 193 | 156 |
| subtype1 | 81 | 61 |
| subtype2 | 59 | 38 |
| subtype3 | 53 | 57 |
Figure S24. Get High-res Image Clustering Approach #3: 'METHLYATION CNMF' versus Clinical Feature #4: 'GENDER'
P value = 1.72e-05 (Chi-square test)
Table S28. Clustering Approach #3: 'METHLYATION CNMF' versus Clinical Feature #5: 'HISTOLOGICAL.TYPE'
| nPatients | COLON ADENOCARCINOMA | COLON MUCINOUS ADENOCARCINOMA | RECTAL ADENOCARCINOMA | RECTAL MUCINOUS ADENOCARCINOMA |
|---|---|---|---|---|
| ALL | 224 | 30 | 87 | 6 |
| subtype1 | 89 | 3 | 48 | 2 |
| subtype2 | 52 | 14 | 28 | 1 |
| subtype3 | 83 | 13 | 11 | 3 |
Figure S25. Get High-res Image Clustering Approach #3: 'METHLYATION CNMF' versus Clinical Feature #5: 'HISTOLOGICAL.TYPE'
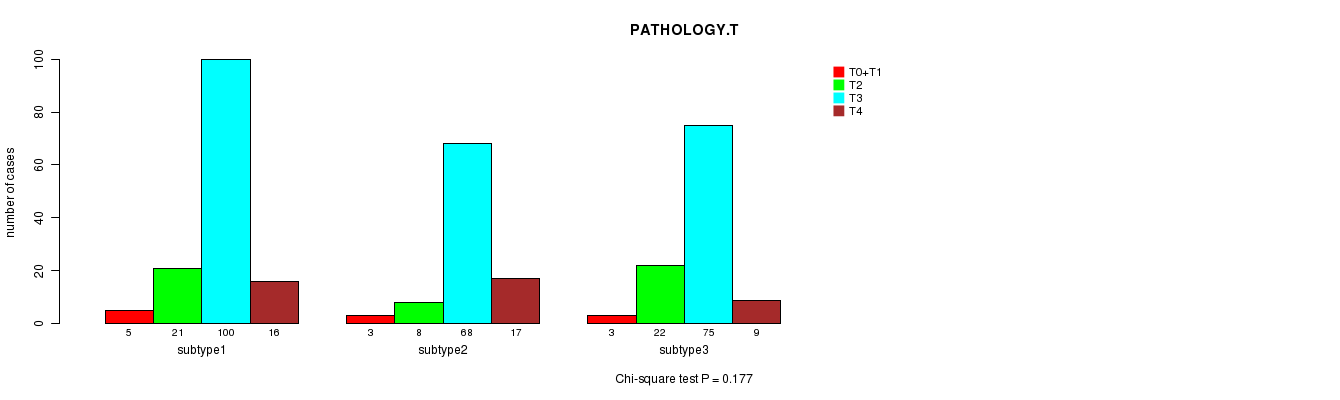
P value = 0.177 (Chi-square test)
Table S29. Clustering Approach #3: 'METHLYATION CNMF' versus Clinical Feature #6: 'PATHOLOGY.T'
| nPatients | T0+T1 | T2 | T3 | T4 |
|---|---|---|---|---|
| ALL | 11 | 51 | 243 | 42 |
| subtype1 | 5 | 21 | 100 | 16 |
| subtype2 | 3 | 8 | 68 | 17 |
| subtype3 | 3 | 22 | 75 | 9 |
Figure S26. Get High-res Image Clustering Approach #3: 'METHLYATION CNMF' versus Clinical Feature #6: 'PATHOLOGY.T'
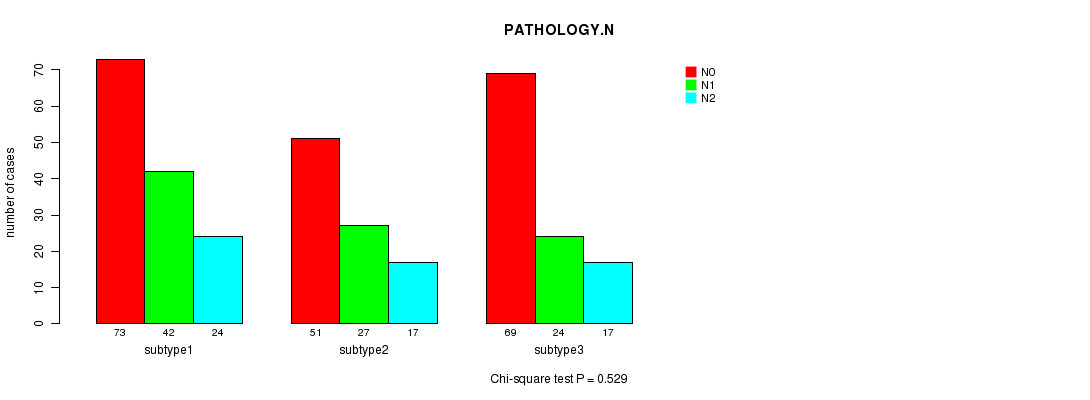
P value = 0.529 (Chi-square test)
Table S30. Clustering Approach #3: 'METHLYATION CNMF' versus Clinical Feature #7: 'PATHOLOGY.N'
| nPatients | N0 | N1 | N2 |
|---|---|---|---|
| ALL | 193 | 93 | 58 |
| subtype1 | 73 | 42 | 24 |
| subtype2 | 51 | 27 | 17 |
| subtype3 | 69 | 24 | 17 |
Figure S27. Get High-res Image Clustering Approach #3: 'METHLYATION CNMF' versus Clinical Feature #7: 'PATHOLOGY.N'
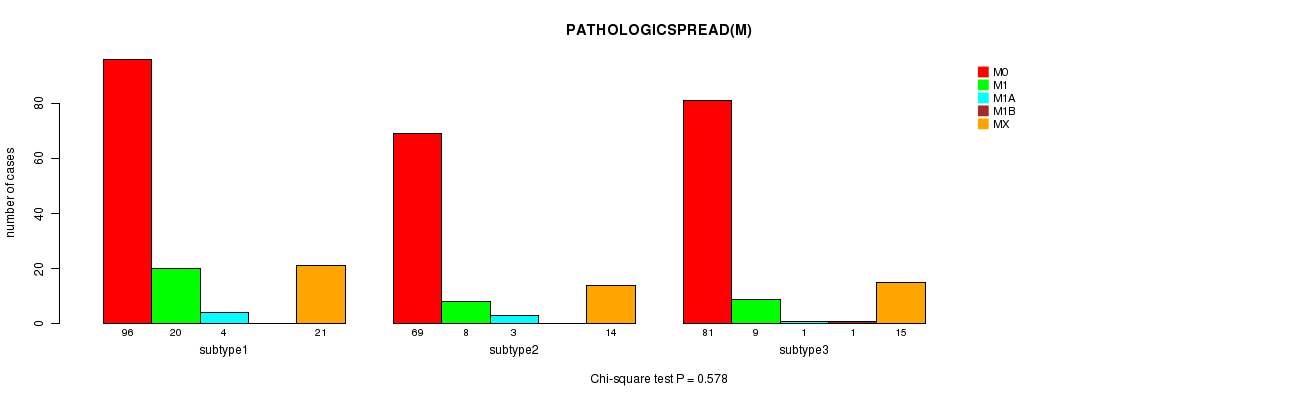
P value = 0.578 (Chi-square test)
Table S31. Clustering Approach #3: 'METHLYATION CNMF' versus Clinical Feature #8: 'PATHOLOGICSPREAD(M)'
| nPatients | M0 | M1 | M1A | M1B | MX |
|---|---|---|---|---|---|
| ALL | 246 | 37 | 8 | 1 | 50 |
| subtype1 | 96 | 20 | 4 | 0 | 21 |
| subtype2 | 69 | 8 | 3 | 0 | 14 |
| subtype3 | 81 | 9 | 1 | 1 | 15 |
Figure S28. Get High-res Image Clustering Approach #3: 'METHLYATION CNMF' versus Clinical Feature #8: 'PATHOLOGICSPREAD(M)'
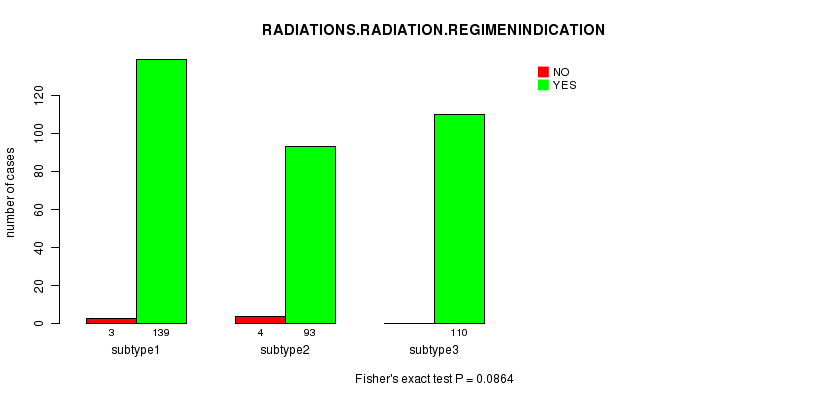
P value = 0.0864 (Fisher's exact test)
Table S32. Clustering Approach #3: 'METHLYATION CNMF' versus Clinical Feature #9: 'RADIATIONS.RADIATION.REGIMENINDICATION'
| nPatients | NO | YES |
|---|---|---|
| ALL | 342 | 7 |
| subtype1 | 139 | 3 |
| subtype2 | 93 | 4 |
| subtype3 | 110 | 0 |
Figure S29. Get High-res Image Clustering Approach #3: 'METHLYATION CNMF' versus Clinical Feature #9: 'RADIATIONS.RADIATION.REGIMENINDICATION'
P value = 0.626 (Fisher's exact test)
Table S33. Clustering Approach #3: 'METHLYATION CNMF' versus Clinical Feature #10: 'NEOADJUVANT.THERAPY'
| nPatients | NO | YES |
|---|---|---|
| ALL | 280 | 69 |
| subtype1 | 114 | 28 |
| subtype2 | 75 | 22 |
| subtype3 | 91 | 19 |
Figure S30. Get High-res Image Clustering Approach #3: 'METHLYATION CNMF' versus Clinical Feature #10: 'NEOADJUVANT.THERAPY'
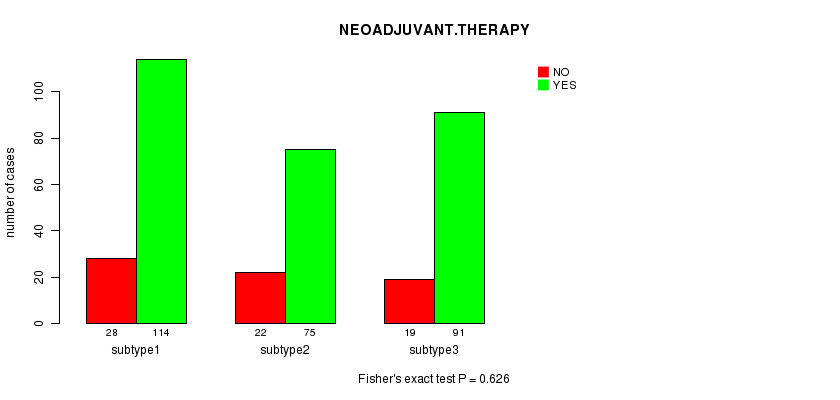
Table S34. Get Full Table Description of clustering approach #4: 'RNAseq CNMF subtypes'
| Cluster Labels | 1 | 2 | 3 | 4 |
|---|---|---|---|---|
| Number of samples | 17 | 17 | 27 | 22 |
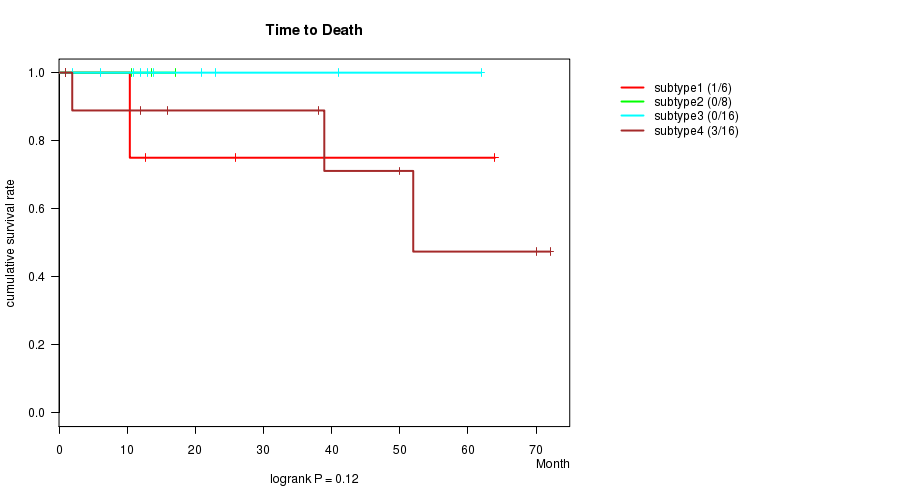
P value = 0.12 (logrank test)
Table S35. Clustering Approach #4: 'RNAseq CNMF subtypes' versus Clinical Feature #1: 'Time to Death'
| nPatients | nDeath | Duration Range (Median), Month | |
|---|---|---|---|
| ALL | 46 | 4 | 0.9 - 72.1 (8.2) |
| subtype1 | 6 | 1 | 1.0 - 64.0 (11.6) |
| subtype2 | 8 | 0 | 1.0 - 17.0 (1.0) |
| subtype3 | 16 | 0 | 0.9 - 61.9 (8.5) |
| subtype4 | 16 | 3 | 0.9 - 72.1 (7.0) |
Figure S31. Get High-res Image Clustering Approach #4: 'RNAseq CNMF subtypes' versus Clinical Feature #1: 'Time to Death'
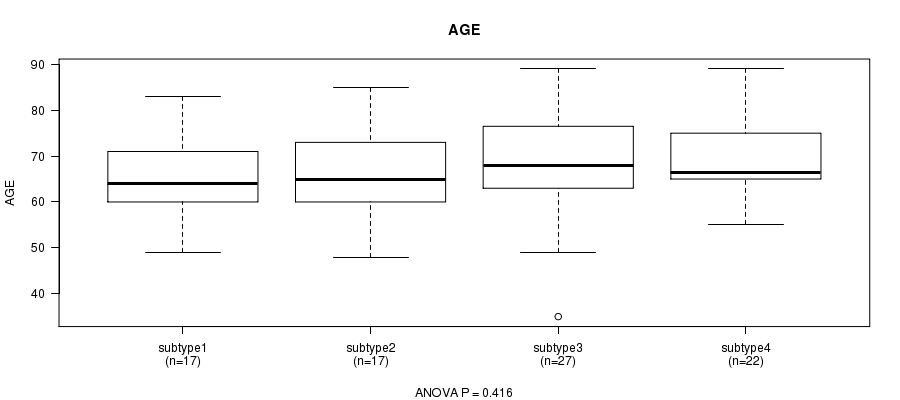
P value = 0.416 (ANOVA)
Table S36. Clustering Approach #4: 'RNAseq CNMF subtypes' versus Clinical Feature #2: 'AGE'
| nPatients | Mean (Std.Dev) | |
|---|---|---|
| ALL | 83 | 67.6 (10.5) |
| subtype1 | 17 | 64.8 (9.6) |
| subtype2 | 17 | 66.1 (9.8) |
| subtype3 | 27 | 68.2 (12.3) |
| subtype4 | 22 | 70.1 (9.3) |
Figure S32. Get High-res Image Clustering Approach #4: 'RNAseq CNMF subtypes' versus Clinical Feature #2: 'AGE'
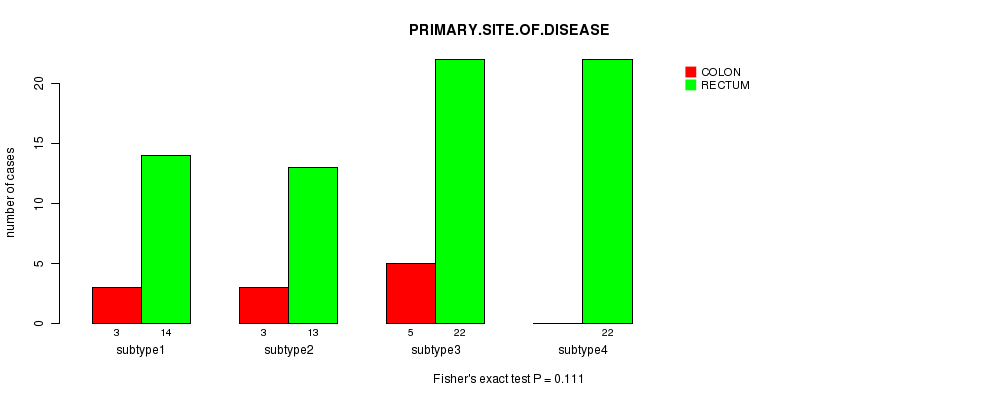
P value = 0.111 (Fisher's exact test)
Table S37. Clustering Approach #4: 'RNAseq CNMF subtypes' versus Clinical Feature #3: 'PRIMARY.SITE.OF.DISEASE'
| nPatients | COLON | RECTUM |
|---|---|---|
| ALL | 11 | 71 |
| subtype1 | 3 | 14 |
| subtype2 | 3 | 13 |
| subtype3 | 5 | 22 |
| subtype4 | 0 | 22 |
Figure S33. Get High-res Image Clustering Approach #4: 'RNAseq CNMF subtypes' versus Clinical Feature #3: 'PRIMARY.SITE.OF.DISEASE'
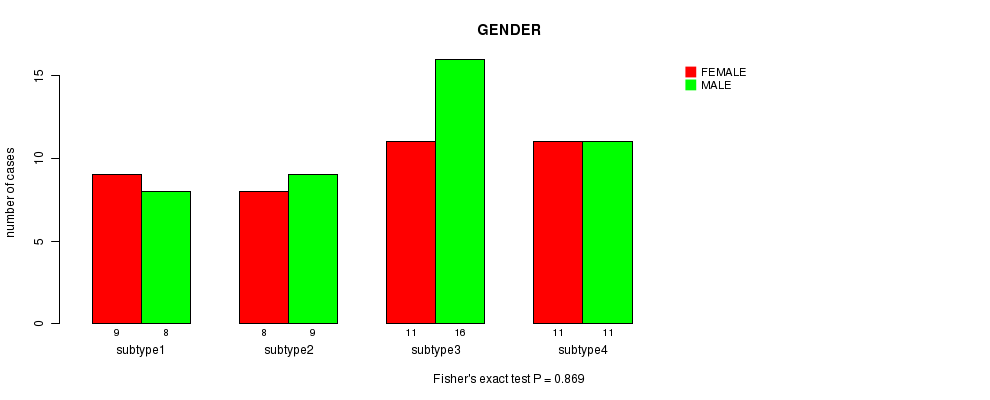
P value = 0.869 (Fisher's exact test)
Table S38. Clustering Approach #4: 'RNAseq CNMF subtypes' versus Clinical Feature #4: 'GENDER'
| nPatients | FEMALE | MALE |
|---|---|---|
| ALL | 39 | 44 |
| subtype1 | 9 | 8 |
| subtype2 | 8 | 9 |
| subtype3 | 11 | 16 |
| subtype4 | 11 | 11 |
Figure S34. Get High-res Image Clustering Approach #4: 'RNAseq CNMF subtypes' versus Clinical Feature #4: 'GENDER'
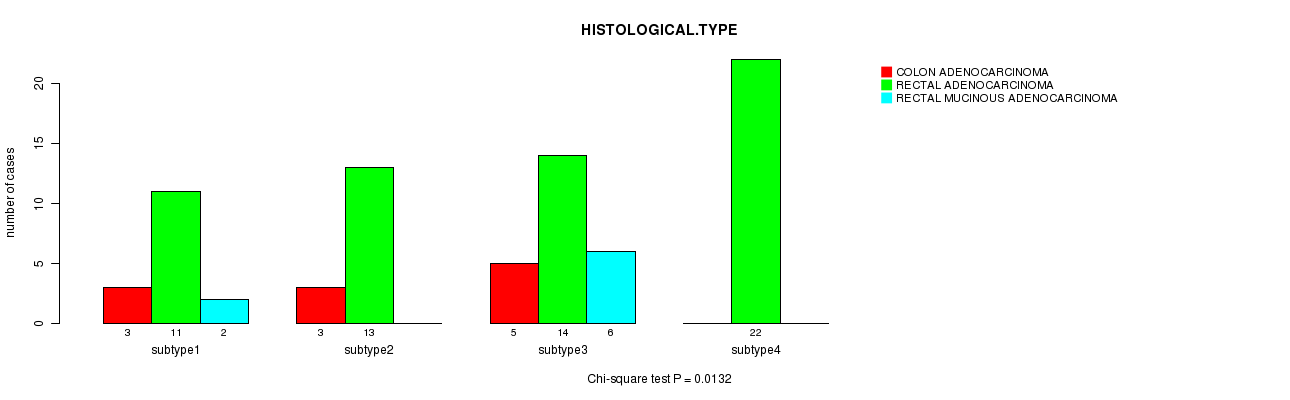
P value = 0.0132 (Chi-square test)
Table S39. Clustering Approach #4: 'RNAseq CNMF subtypes' versus Clinical Feature #5: 'HISTOLOGICAL.TYPE'
| nPatients | COLON ADENOCARCINOMA | RECTAL ADENOCARCINOMA | RECTAL MUCINOUS ADENOCARCINOMA |
|---|---|---|---|
| ALL | 11 | 60 | 8 |
| subtype1 | 3 | 11 | 2 |
| subtype2 | 3 | 13 | 0 |
| subtype3 | 5 | 14 | 6 |
| subtype4 | 0 | 22 | 0 |
Figure S35. Get High-res Image Clustering Approach #4: 'RNAseq CNMF subtypes' versus Clinical Feature #5: 'HISTOLOGICAL.TYPE'
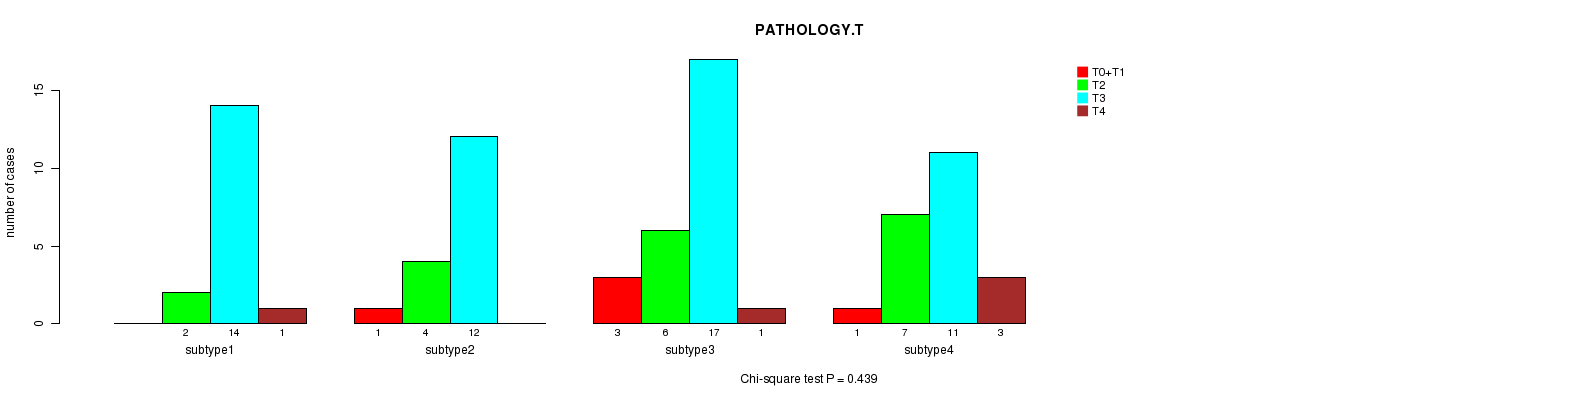
P value = 0.439 (Chi-square test)
Table S40. Clustering Approach #4: 'RNAseq CNMF subtypes' versus Clinical Feature #6: 'PATHOLOGY.T'
| nPatients | T0+T1 | T2 | T3 | T4 |
|---|---|---|---|---|
| ALL | 5 | 19 | 54 | 5 |
| subtype1 | 0 | 2 | 14 | 1 |
| subtype2 | 1 | 4 | 12 | 0 |
| subtype3 | 3 | 6 | 17 | 1 |
| subtype4 | 1 | 7 | 11 | 3 |
Figure S36. Get High-res Image Clustering Approach #4: 'RNAseq CNMF subtypes' versus Clinical Feature #6: 'PATHOLOGY.T'
P value = 0.872 (Chi-square test)
Table S41. Clustering Approach #4: 'RNAseq CNMF subtypes' versus Clinical Feature #7: 'PATHOLOGY.N'
| nPatients | N0 | N1 | N2 |
|---|---|---|---|
| ALL | 52 | 17 | 14 |
| subtype1 | 9 | 4 | 4 |
| subtype2 | 12 | 3 | 2 |
| subtype3 | 18 | 6 | 3 |
| subtype4 | 13 | 4 | 5 |
Figure S37. Get High-res Image Clustering Approach #4: 'RNAseq CNMF subtypes' versus Clinical Feature #7: 'PATHOLOGY.N'
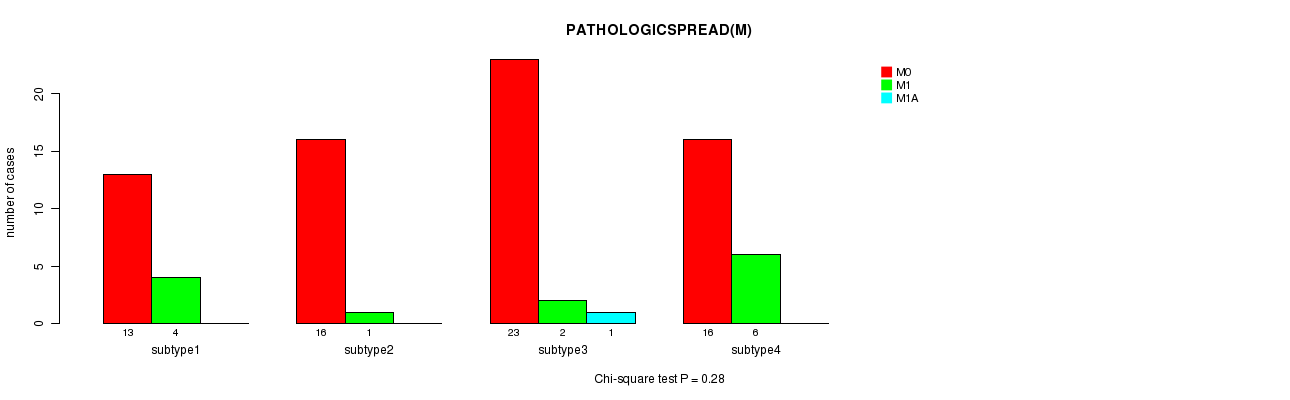
P value = 0.28 (Chi-square test)
Table S42. Clustering Approach #4: 'RNAseq CNMF subtypes' versus Clinical Feature #8: 'PATHOLOGICSPREAD(M)'
| nPatients | M0 | M1 | M1A |
|---|---|---|---|
| ALL | 68 | 13 | 1 |
| subtype1 | 13 | 4 | 0 |
| subtype2 | 16 | 1 | 0 |
| subtype3 | 23 | 2 | 1 |
| subtype4 | 16 | 6 | 0 |
Figure S38. Get High-res Image Clustering Approach #4: 'RNAseq CNMF subtypes' versus Clinical Feature #8: 'PATHOLOGICSPREAD(M)'
P value = 0.41 (Fisher's exact test)
Table S43. Clustering Approach #4: 'RNAseq CNMF subtypes' versus Clinical Feature #9: 'RADIATIONS.RADIATION.REGIMENINDICATION'
| nPatients | NO | YES |
|---|---|---|
| ALL | 82 | 1 |
| subtype1 | 16 | 1 |
| subtype2 | 17 | 0 |
| subtype3 | 27 | 0 |
| subtype4 | 22 | 0 |
Figure S39. Get High-res Image Clustering Approach #4: 'RNAseq CNMF subtypes' versus Clinical Feature #9: 'RADIATIONS.RADIATION.REGIMENINDICATION'
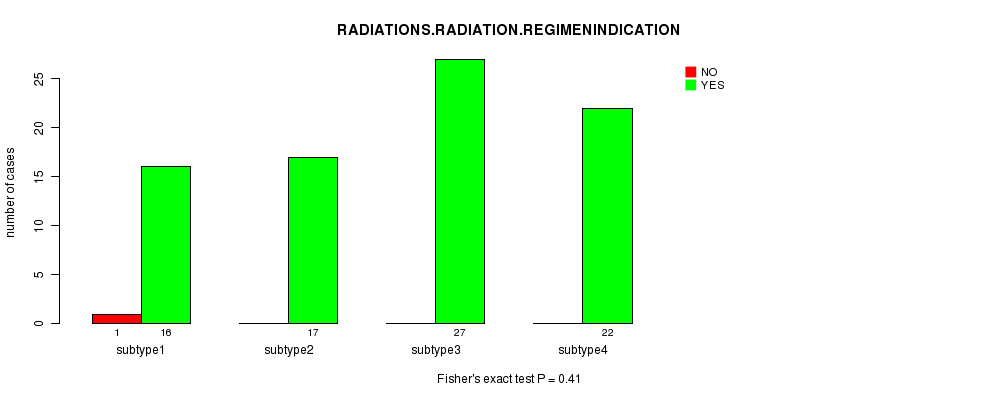
P value = 0.41 (Fisher's exact test)
Table S44. Clustering Approach #4: 'RNAseq CNMF subtypes' versus Clinical Feature #10: 'NEOADJUVANT.THERAPY'
| nPatients | NO | YES |
|---|---|---|
| ALL | 82 | 1 |
| subtype1 | 16 | 1 |
| subtype2 | 17 | 0 |
| subtype3 | 27 | 0 |
| subtype4 | 22 | 0 |
Figure S40. Get High-res Image Clustering Approach #4: 'RNAseq CNMF subtypes' versus Clinical Feature #10: 'NEOADJUVANT.THERAPY'
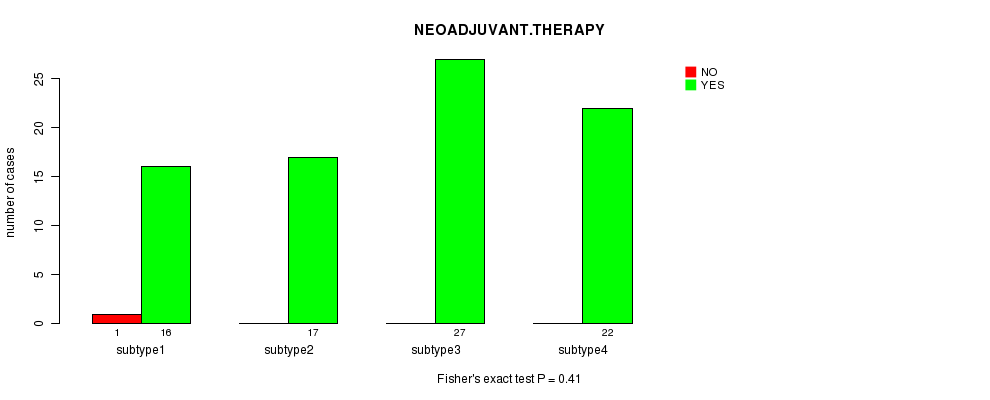
Table S45. Get Full Table Description of clustering approach #5: 'RNAseq cHierClus subtypes'
| Cluster Labels | 1 | 2 | 3 | 4 |
|---|---|---|---|---|
| Number of samples | 17 | 16 | 28 | 22 |
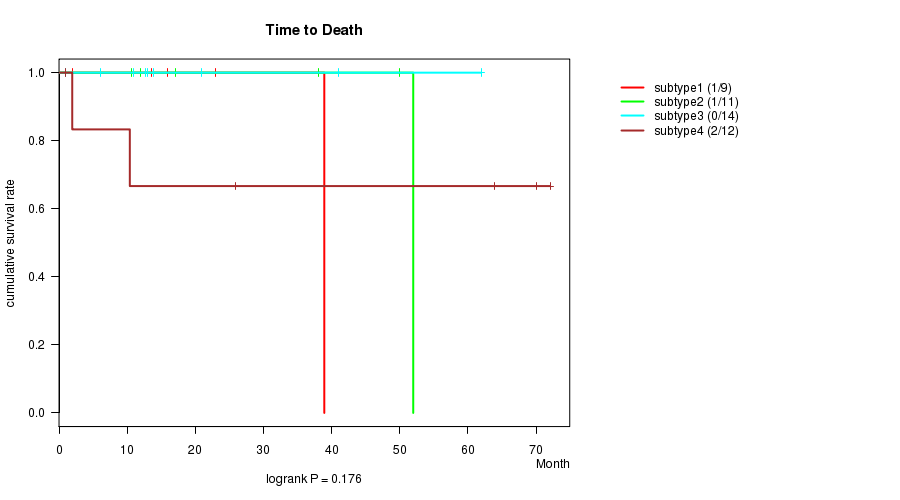
P value = 0.176 (logrank test)
Table S46. Clustering Approach #5: 'RNAseq cHierClus subtypes' versus Clinical Feature #1: 'Time to Death'
| nPatients | nDeath | Duration Range (Median), Month | |
|---|---|---|---|
| ALL | 46 | 4 | 0.9 - 72.1 (8.2) |
| subtype1 | 9 | 1 | 0.9 - 38.9 (2.0) |
| subtype2 | 11 | 1 | 1.0 - 52.0 (12.0) |
| subtype3 | 14 | 0 | 0.9 - 61.9 (8.5) |
| subtype4 | 12 | 2 | 1.0 - 72.1 (1.5) |
Figure S41. Get High-res Image Clustering Approach #5: 'RNAseq cHierClus subtypes' versus Clinical Feature #1: 'Time to Death'
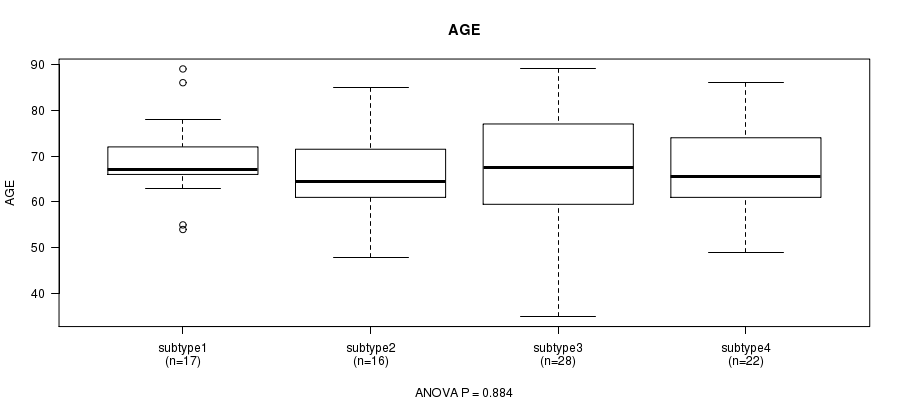
P value = 0.884 (ANOVA)
Table S47. Clustering Approach #5: 'RNAseq cHierClus subtypes' versus Clinical Feature #2: 'AGE'
| nPatients | Mean (Std.Dev) | |
|---|---|---|
| ALL | 83 | 67.6 (10.5) |
| subtype1 | 17 | 69.2 (9.1) |
| subtype2 | 16 | 66.5 (9.4) |
| subtype3 | 28 | 67.7 (13.0) |
| subtype4 | 22 | 67.0 (9.2) |
Figure S42. Get High-res Image Clustering Approach #5: 'RNAseq cHierClus subtypes' versus Clinical Feature #2: 'AGE'
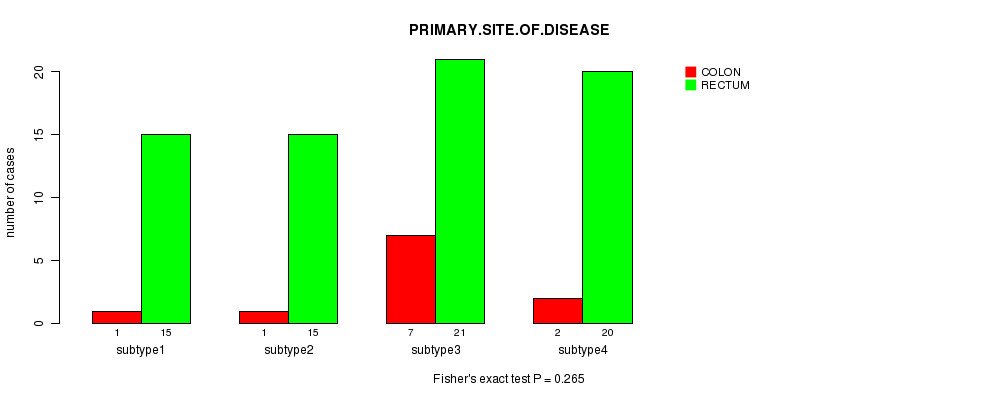
P value = 0.265 (Fisher's exact test)
Table S48. Clustering Approach #5: 'RNAseq cHierClus subtypes' versus Clinical Feature #3: 'PRIMARY.SITE.OF.DISEASE'
| nPatients | COLON | RECTUM |
|---|---|---|
| ALL | 11 | 71 |
| subtype1 | 1 | 15 |
| subtype2 | 1 | 15 |
| subtype3 | 7 | 21 |
| subtype4 | 2 | 20 |
Figure S43. Get High-res Image Clustering Approach #5: 'RNAseq cHierClus subtypes' versus Clinical Feature #3: 'PRIMARY.SITE.OF.DISEASE'
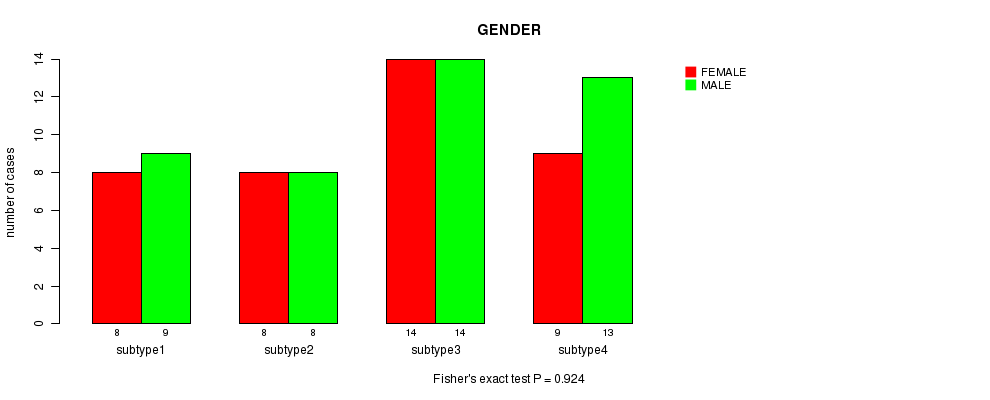
P value = 0.924 (Fisher's exact test)
Table S49. Clustering Approach #5: 'RNAseq cHierClus subtypes' versus Clinical Feature #4: 'GENDER'
| nPatients | FEMALE | MALE |
|---|---|---|
| ALL | 39 | 44 |
| subtype1 | 8 | 9 |
| subtype2 | 8 | 8 |
| subtype3 | 14 | 14 |
| subtype4 | 9 | 13 |
Figure S44. Get High-res Image Clustering Approach #5: 'RNAseq cHierClus subtypes' versus Clinical Feature #4: 'GENDER'
P value = 0.00215 (Chi-square test)
Table S50. Clustering Approach #5: 'RNAseq cHierClus subtypes' versus Clinical Feature #5: 'HISTOLOGICAL.TYPE'
| nPatients | COLON ADENOCARCINOMA | RECTAL ADENOCARCINOMA | RECTAL MUCINOUS ADENOCARCINOMA |
|---|---|---|---|
| ALL | 11 | 60 | 8 |
| subtype1 | 1 | 13 | 1 |
| subtype2 | 1 | 15 | 0 |
| subtype3 | 7 | 12 | 7 |
| subtype4 | 2 | 20 | 0 |
Figure S45. Get High-res Image Clustering Approach #5: 'RNAseq cHierClus subtypes' versus Clinical Feature #5: 'HISTOLOGICAL.TYPE'
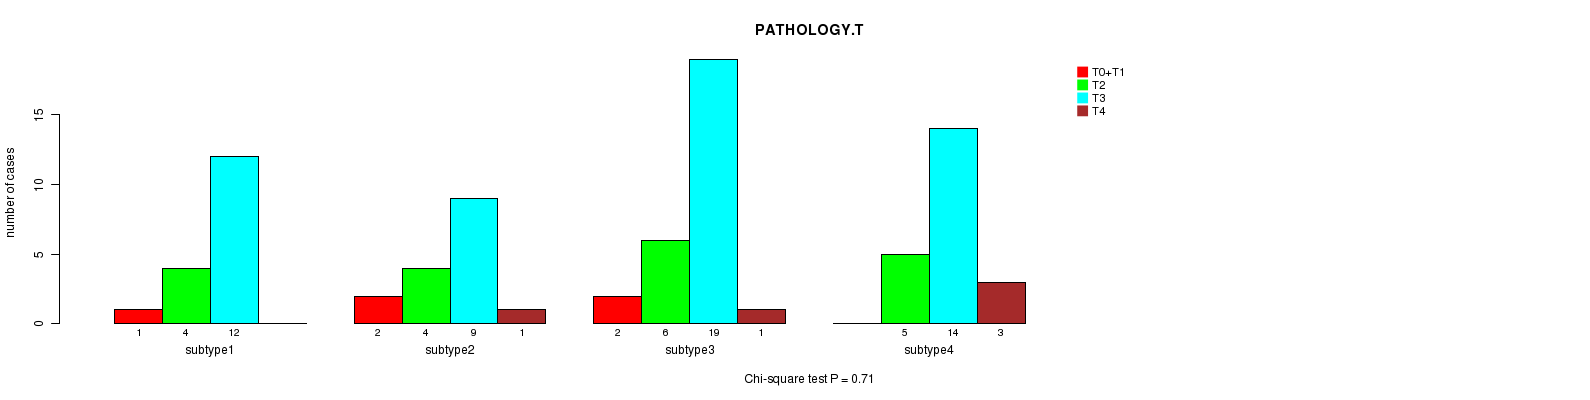
P value = 0.71 (Chi-square test)
Table S51. Clustering Approach #5: 'RNAseq cHierClus subtypes' versus Clinical Feature #6: 'PATHOLOGY.T'
| nPatients | T0+T1 | T2 | T3 | T4 |
|---|---|---|---|---|
| ALL | 5 | 19 | 54 | 5 |
| subtype1 | 1 | 4 | 12 | 0 |
| subtype2 | 2 | 4 | 9 | 1 |
| subtype3 | 2 | 6 | 19 | 1 |
| subtype4 | 0 | 5 | 14 | 3 |
Figure S46. Get High-res Image Clustering Approach #5: 'RNAseq cHierClus subtypes' versus Clinical Feature #6: 'PATHOLOGY.T'
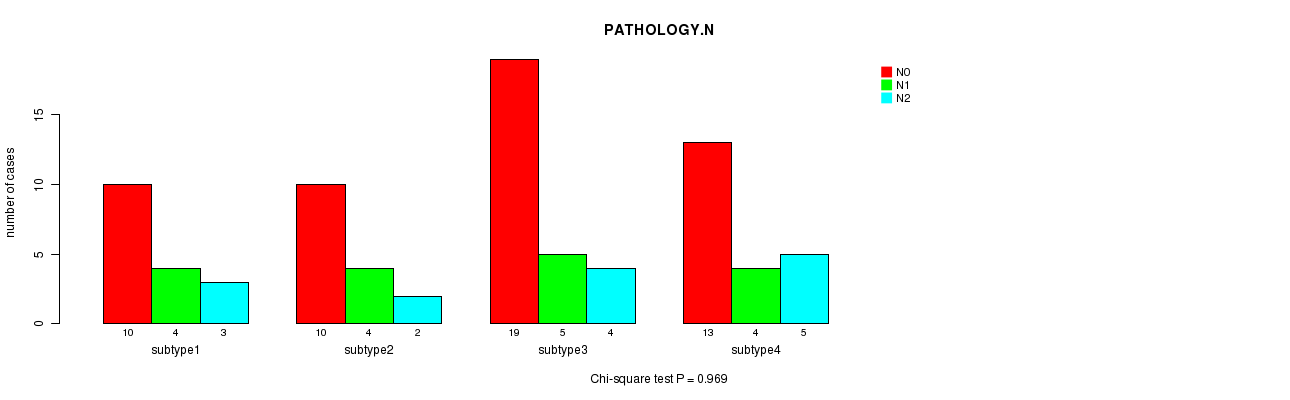
P value = 0.969 (Chi-square test)
Table S52. Clustering Approach #5: 'RNAseq cHierClus subtypes' versus Clinical Feature #7: 'PATHOLOGY.N'
| nPatients | N0 | N1 | N2 |
|---|---|---|---|
| ALL | 52 | 17 | 14 |
| subtype1 | 10 | 4 | 3 |
| subtype2 | 10 | 4 | 2 |
| subtype3 | 19 | 5 | 4 |
| subtype4 | 13 | 4 | 5 |
Figure S47. Get High-res Image Clustering Approach #5: 'RNAseq cHierClus subtypes' versus Clinical Feature #7: 'PATHOLOGY.N'
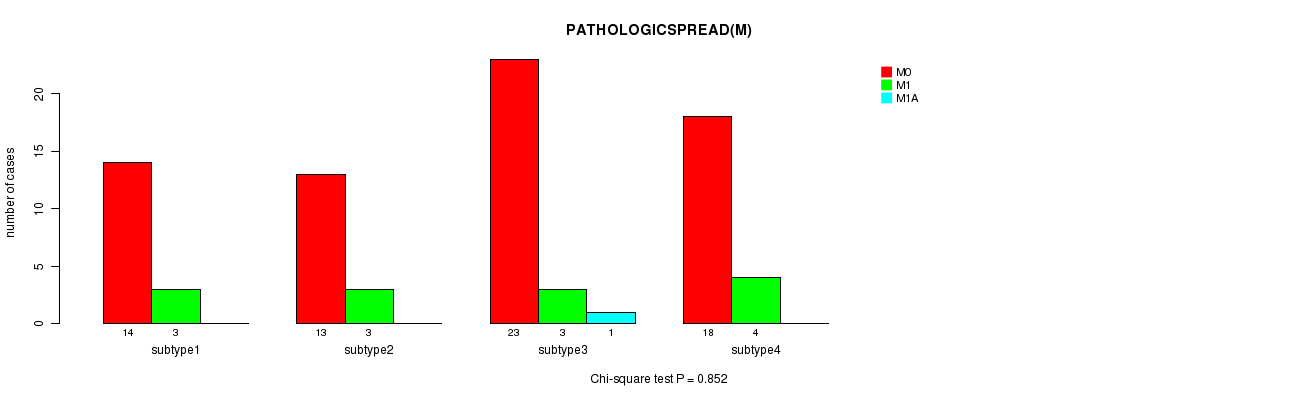
P value = 0.852 (Chi-square test)
Table S53. Clustering Approach #5: 'RNAseq cHierClus subtypes' versus Clinical Feature #8: 'PATHOLOGICSPREAD(M)'
| nPatients | M0 | M1 | M1A |
|---|---|---|---|
| ALL | 68 | 13 | 1 |
| subtype1 | 14 | 3 | 0 |
| subtype2 | 13 | 3 | 0 |
| subtype3 | 23 | 3 | 1 |
| subtype4 | 18 | 4 | 0 |
Figure S48. Get High-res Image Clustering Approach #5: 'RNAseq cHierClus subtypes' versus Clinical Feature #8: 'PATHOLOGICSPREAD(M)'
P value = 1 (Fisher's exact test)
Table S54. Clustering Approach #5: 'RNAseq cHierClus subtypes' versus Clinical Feature #9: 'RADIATIONS.RADIATION.REGIMENINDICATION'
| nPatients | NO | YES |
|---|---|---|
| ALL | 82 | 1 |
| subtype1 | 17 | 0 |
| subtype2 | 16 | 0 |
| subtype3 | 27 | 1 |
| subtype4 | 22 | 0 |
Figure S49. Get High-res Image Clustering Approach #5: 'RNAseq cHierClus subtypes' versus Clinical Feature #9: 'RADIATIONS.RADIATION.REGIMENINDICATION'
P value = 1 (Fisher's exact test)
Table S55. Clustering Approach #5: 'RNAseq cHierClus subtypes' versus Clinical Feature #10: 'NEOADJUVANT.THERAPY'
| nPatients | NO | YES |
|---|---|---|
| ALL | 82 | 1 |
| subtype1 | 17 | 0 |
| subtype2 | 16 | 0 |
| subtype3 | 27 | 1 |
| subtype4 | 22 | 0 |
Figure S50. Get High-res Image Clustering Approach #5: 'RNAseq cHierClus subtypes' versus Clinical Feature #10: 'NEOADJUVANT.THERAPY'
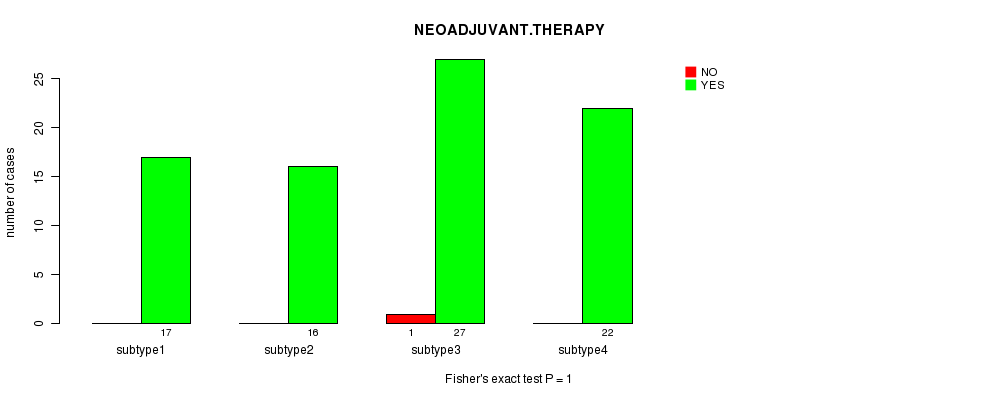
Table S56. Get Full Table Description of clustering approach #6: 'MIRseq CNMF subtypes'
| Cluster Labels | 1 | 2 | 3 |
|---|---|---|---|
| Number of samples | 54 | 114 | 87 |
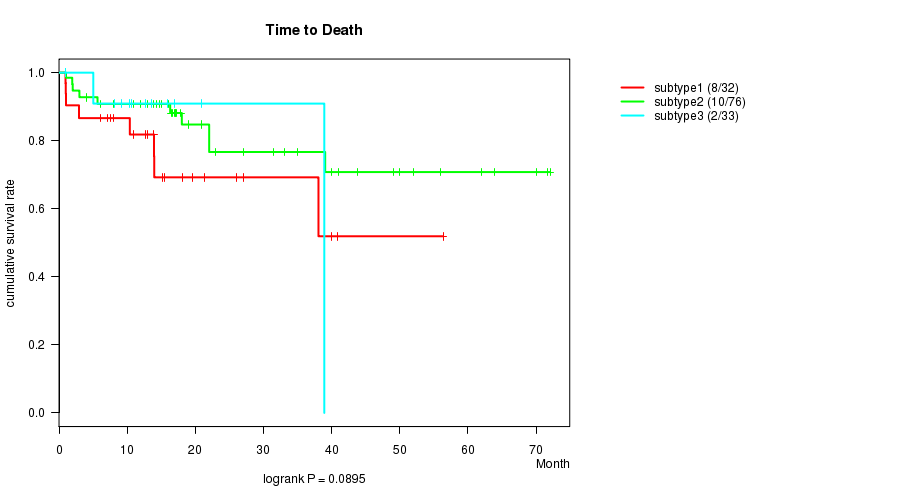
P value = 0.0895 (logrank test)
Table S57. Clustering Approach #6: 'MIRseq CNMF subtypes' versus Clinical Feature #1: 'Time to Death'
| nPatients | nDeath | Duration Range (Median), Month | |
|---|---|---|---|
| ALL | 141 | 20 | 0.9 - 72.1 (9.1) |
| subtype1 | 32 | 8 | 0.9 - 56.4 (11.8) |
| subtype2 | 76 | 10 | 0.9 - 72.1 (14.1) |
| subtype3 | 33 | 2 | 0.9 - 38.9 (1.0) |
Figure S51. Get High-res Image Clustering Approach #6: 'MIRseq CNMF subtypes' versus Clinical Feature #1: 'Time to Death'
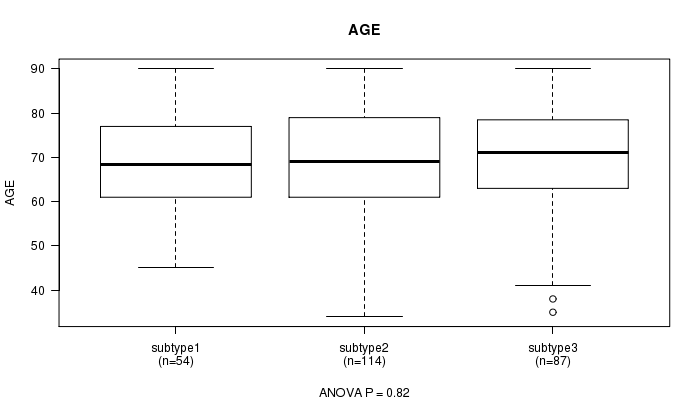
P value = 0.82 (ANOVA)
Table S58. Clustering Approach #6: 'MIRseq CNMF subtypes' versus Clinical Feature #2: 'AGE'
| nPatients | Mean (Std.Dev) | |
|---|---|---|
| ALL | 255 | 68.6 (12.2) |
| subtype1 | 54 | 68.1 (11.0) |
| subtype2 | 114 | 68.4 (12.6) |
| subtype3 | 87 | 69.3 (12.4) |
Figure S52. Get High-res Image Clustering Approach #6: 'MIRseq CNMF subtypes' versus Clinical Feature #2: 'AGE'
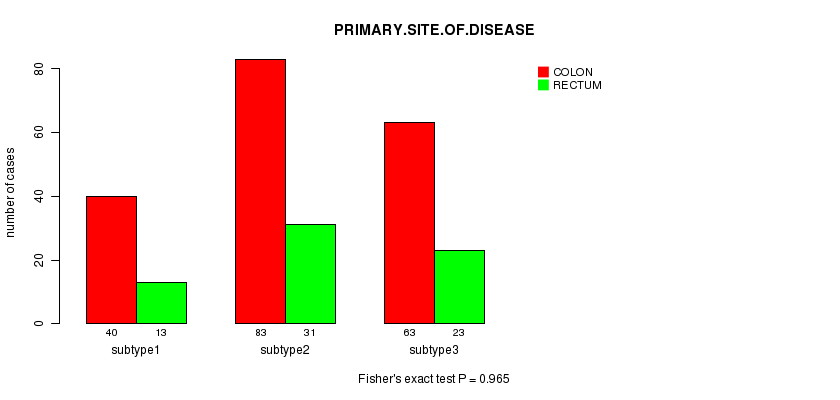
P value = 0.965 (Fisher's exact test)
Table S59. Clustering Approach #6: 'MIRseq CNMF subtypes' versus Clinical Feature #3: 'PRIMARY.SITE.OF.DISEASE'
| nPatients | COLON | RECTUM |
|---|---|---|
| ALL | 186 | 67 |
| subtype1 | 40 | 13 |
| subtype2 | 83 | 31 |
| subtype3 | 63 | 23 |
Figure S53. Get High-res Image Clustering Approach #6: 'MIRseq CNMF subtypes' versus Clinical Feature #3: 'PRIMARY.SITE.OF.DISEASE'
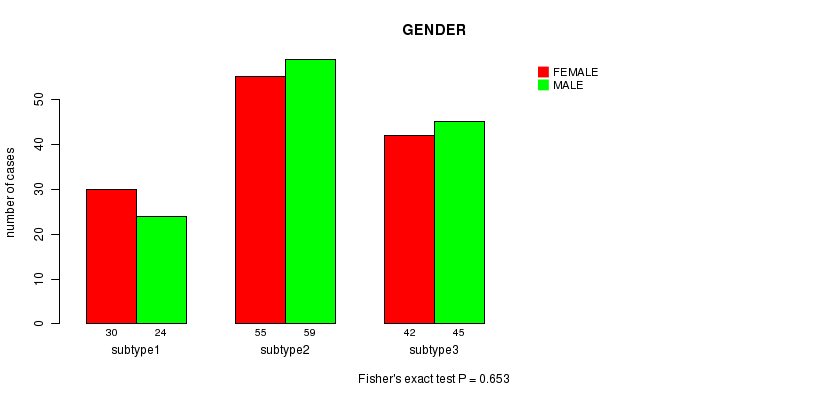
P value = 0.653 (Fisher's exact test)
Table S60. Clustering Approach #6: 'MIRseq CNMF subtypes' versus Clinical Feature #4: 'GENDER'
| nPatients | FEMALE | MALE |
|---|---|---|
| ALL | 128 | 127 |
| subtype1 | 24 | 30 |
| subtype2 | 59 | 55 |
| subtype3 | 45 | 42 |
Figure S54. Get High-res Image Clustering Approach #6: 'MIRseq CNMF subtypes' versus Clinical Feature #4: 'GENDER'
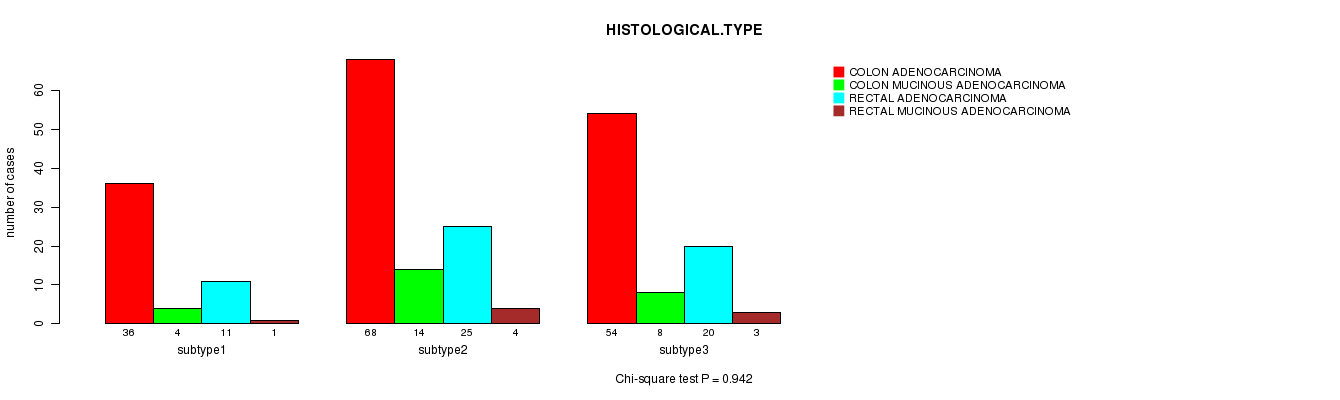
P value = 0.942 (Chi-square test)
Table S61. Clustering Approach #6: 'MIRseq CNMF subtypes' versus Clinical Feature #5: 'HISTOLOGICAL.TYPE'
| nPatients | COLON ADENOCARCINOMA | COLON MUCINOUS ADENOCARCINOMA | RECTAL ADENOCARCINOMA | RECTAL MUCINOUS ADENOCARCINOMA |
|---|---|---|---|---|
| ALL | 158 | 26 | 56 | 8 |
| subtype1 | 36 | 4 | 11 | 1 |
| subtype2 | 68 | 14 | 25 | 4 |
| subtype3 | 54 | 8 | 20 | 3 |
Figure S55. Get High-res Image Clustering Approach #6: 'MIRseq CNMF subtypes' versus Clinical Feature #5: 'HISTOLOGICAL.TYPE'
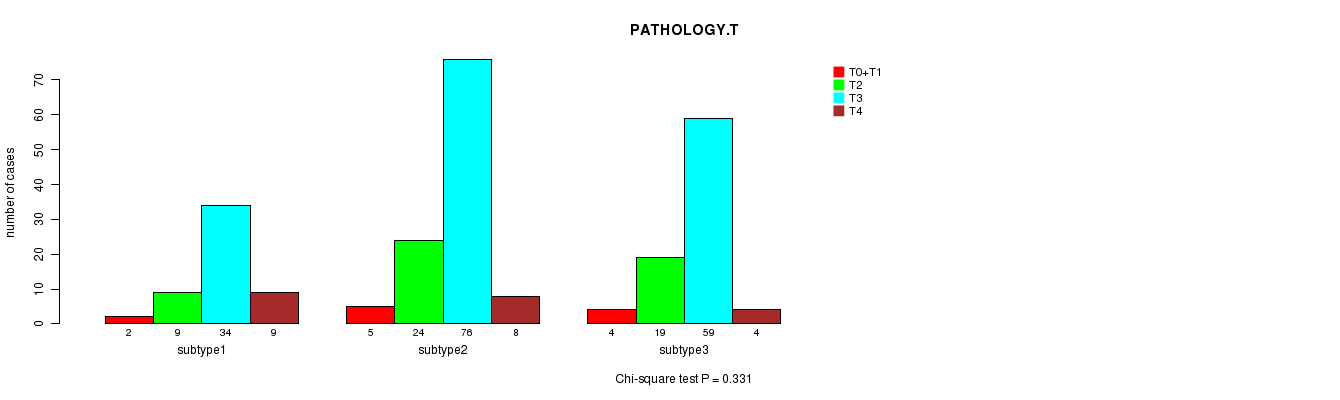
P value = 0.331 (Chi-square test)
Table S62. Clustering Approach #6: 'MIRseq CNMF subtypes' versus Clinical Feature #6: 'PATHOLOGY.T'
| nPatients | T0+T1 | T2 | T3 | T4 |
|---|---|---|---|---|
| ALL | 11 | 52 | 169 | 21 |
| subtype1 | 2 | 9 | 34 | 9 |
| subtype2 | 5 | 24 | 76 | 8 |
| subtype3 | 4 | 19 | 59 | 4 |
Figure S56. Get High-res Image Clustering Approach #6: 'MIRseq CNMF subtypes' versus Clinical Feature #6: 'PATHOLOGY.T'
P value = 0.0292 (Chi-square test)
Table S63. Clustering Approach #6: 'MIRseq CNMF subtypes' versus Clinical Feature #7: 'PATHOLOGY.N'
| nPatients | N0 | N1 | N2 |
|---|---|---|---|
| ALL | 152 | 55 | 47 |
| subtype1 | 24 | 20 | 9 |
| subtype2 | 71 | 20 | 23 |
| subtype3 | 57 | 15 | 15 |
Figure S57. Get High-res Image Clustering Approach #6: 'MIRseq CNMF subtypes' versus Clinical Feature #7: 'PATHOLOGY.N'

P value = 0.1 (Chi-square test)
Table S64. Clustering Approach #6: 'MIRseq CNMF subtypes' versus Clinical Feature #8: 'PATHOLOGICSPREAD(M)'
| nPatients | M0 | M1 | M1A |
|---|---|---|---|
| ALL | 208 | 41 | 2 |
| subtype1 | 37 | 14 | 1 |
| subtype2 | 99 | 14 | 0 |
| subtype3 | 72 | 13 | 1 |
Figure S58. Get High-res Image Clustering Approach #6: 'MIRseq CNMF subtypes' versus Clinical Feature #8: 'PATHOLOGICSPREAD(M)'
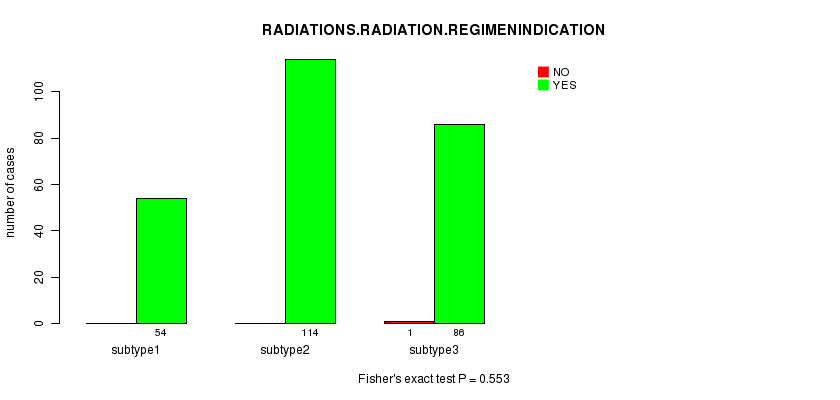
P value = 0.553 (Fisher's exact test)
Table S65. Clustering Approach #6: 'MIRseq CNMF subtypes' versus Clinical Feature #9: 'RADIATIONS.RADIATION.REGIMENINDICATION'
| nPatients | NO | YES |
|---|---|---|
| ALL | 254 | 1 |
| subtype1 | 54 | 0 |
| subtype2 | 114 | 0 |
| subtype3 | 86 | 1 |
Figure S59. Get High-res Image Clustering Approach #6: 'MIRseq CNMF subtypes' versus Clinical Feature #9: 'RADIATIONS.RADIATION.REGIMENINDICATION'
P value = 0.0117 (Fisher's exact test)
Table S66. Clustering Approach #6: 'MIRseq CNMF subtypes' versus Clinical Feature #10: 'NEOADJUVANT.THERAPY'
| nPatients | NO | YES |
|---|---|---|
| ALL | 241 | 14 |
| subtype1 | 47 | 7 |
| subtype2 | 108 | 6 |
| subtype3 | 86 | 1 |
Figure S60. Get High-res Image Clustering Approach #6: 'MIRseq CNMF subtypes' versus Clinical Feature #10: 'NEOADJUVANT.THERAPY'
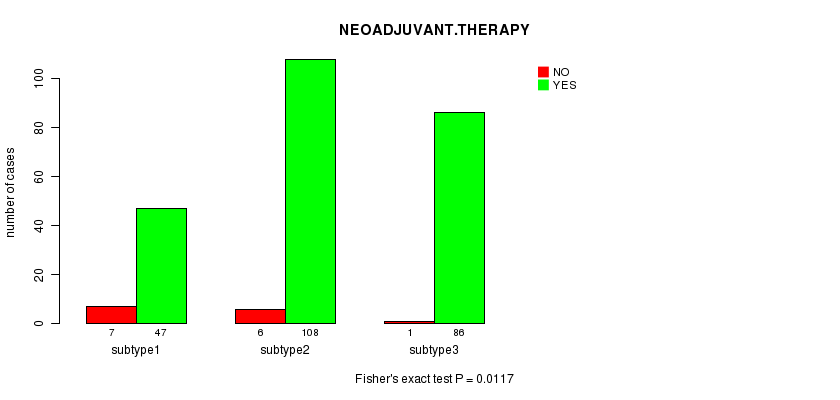
Table S67. Get Full Table Description of clustering approach #7: 'MIRseq cHierClus subtypes'
| Cluster Labels | 1 | 2 |
|---|---|---|
| Number of samples | 80 | 175 |
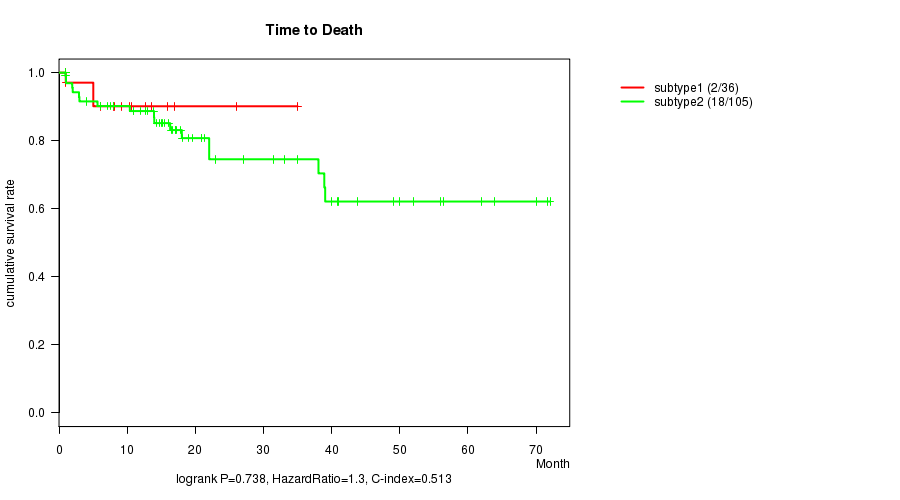
P value = 0.738 (logrank test)
Table S68. Clustering Approach #7: 'MIRseq cHierClus subtypes' versus Clinical Feature #1: 'Time to Death'
| nPatients | nDeath | Duration Range (Median), Month | |
|---|---|---|---|
| ALL | 141 | 20 | 0.9 - 72.1 (9.1) |
| subtype1 | 36 | 2 | 0.9 - 35.0 (1.0) |
| subtype2 | 105 | 18 | 0.9 - 72.1 (13.0) |
Figure S61. Get High-res Image Clustering Approach #7: 'MIRseq cHierClus subtypes' versus Clinical Feature #1: 'Time to Death'
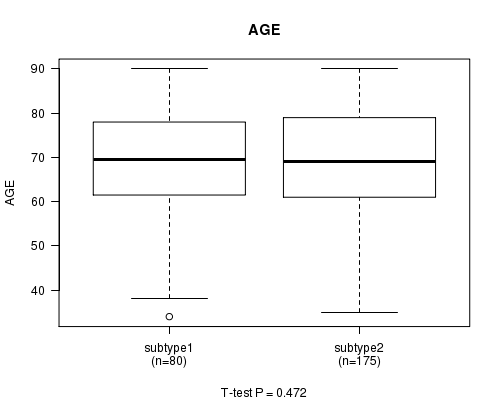
P value = 0.472 (t-test)
Table S69. Clustering Approach #7: 'MIRseq cHierClus subtypes' versus Clinical Feature #2: 'AGE'
| nPatients | Mean (Std.Dev) | |
|---|---|---|
| ALL | 255 | 68.6 (12.2) |
| subtype1 | 80 | 67.8 (12.7) |
| subtype2 | 175 | 69.0 (12.0) |
Figure S62. Get High-res Image Clustering Approach #7: 'MIRseq cHierClus subtypes' versus Clinical Feature #2: 'AGE'
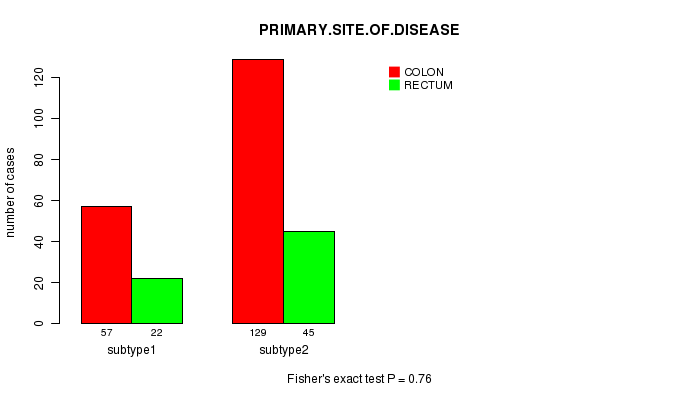
P value = 0.76 (Fisher's exact test)
Table S70. Clustering Approach #7: 'MIRseq cHierClus subtypes' versus Clinical Feature #3: 'PRIMARY.SITE.OF.DISEASE'
| nPatients | COLON | RECTUM |
|---|---|---|
| ALL | 186 | 67 |
| subtype1 | 57 | 22 |
| subtype2 | 129 | 45 |
Figure S63. Get High-res Image Clustering Approach #7: 'MIRseq cHierClus subtypes' versus Clinical Feature #3: 'PRIMARY.SITE.OF.DISEASE'
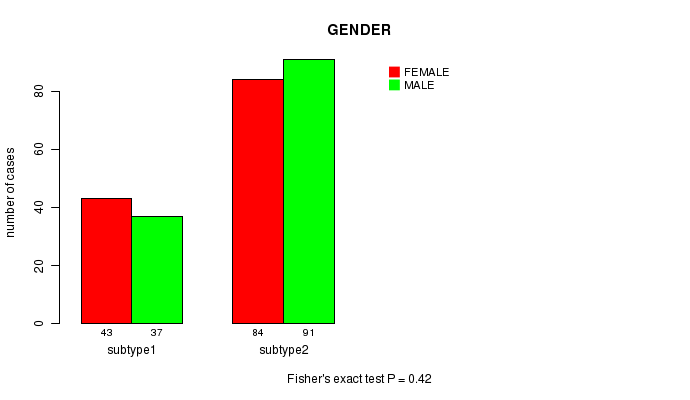
P value = 0.42 (Fisher's exact test)
Table S71. Clustering Approach #7: 'MIRseq cHierClus subtypes' versus Clinical Feature #4: 'GENDER'
| nPatients | FEMALE | MALE |
|---|---|---|
| ALL | 128 | 127 |
| subtype1 | 37 | 43 |
| subtype2 | 91 | 84 |
Figure S64. Get High-res Image Clustering Approach #7: 'MIRseq cHierClus subtypes' versus Clinical Feature #4: 'GENDER'
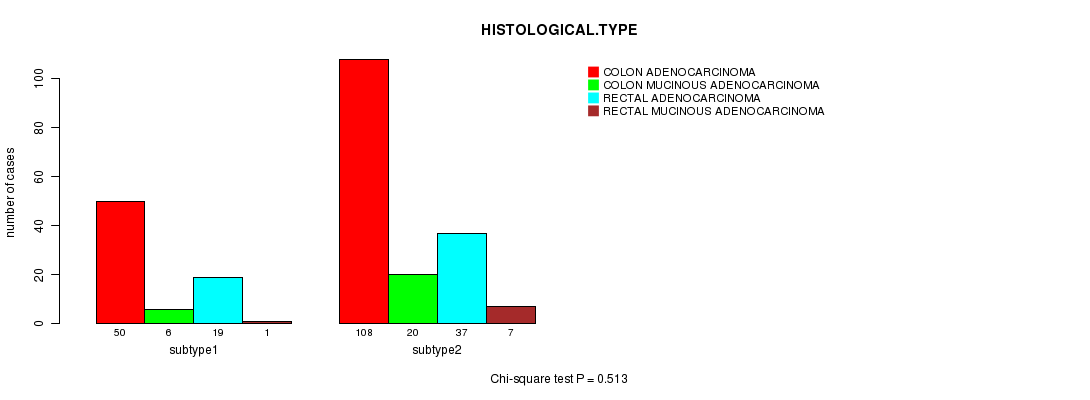
P value = 0.513 (Chi-square test)
Table S72. Clustering Approach #7: 'MIRseq cHierClus subtypes' versus Clinical Feature #5: 'HISTOLOGICAL.TYPE'
| nPatients | COLON ADENOCARCINOMA | COLON MUCINOUS ADENOCARCINOMA | RECTAL ADENOCARCINOMA | RECTAL MUCINOUS ADENOCARCINOMA |
|---|---|---|---|---|
| ALL | 158 | 26 | 56 | 8 |
| subtype1 | 50 | 6 | 19 | 1 |
| subtype2 | 108 | 20 | 37 | 7 |
Figure S65. Get High-res Image Clustering Approach #7: 'MIRseq cHierClus subtypes' versus Clinical Feature #5: 'HISTOLOGICAL.TYPE'
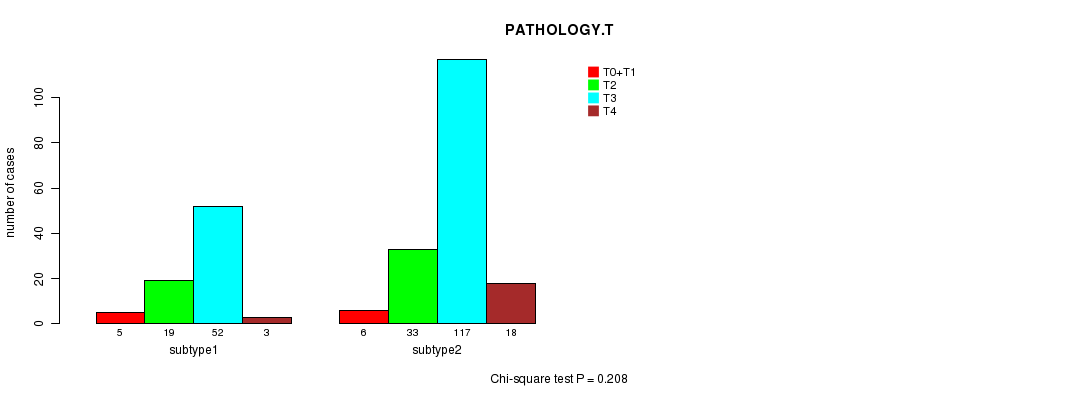
P value = 0.208 (Chi-square test)
Table S73. Clustering Approach #7: 'MIRseq cHierClus subtypes' versus Clinical Feature #6: 'PATHOLOGY.T'
| nPatients | T0+T1 | T2 | T3 | T4 |
|---|---|---|---|---|
| ALL | 11 | 52 | 169 | 21 |
| subtype1 | 5 | 19 | 52 | 3 |
| subtype2 | 6 | 33 | 117 | 18 |
Figure S66. Get High-res Image Clustering Approach #7: 'MIRseq cHierClus subtypes' versus Clinical Feature #6: 'PATHOLOGY.T'
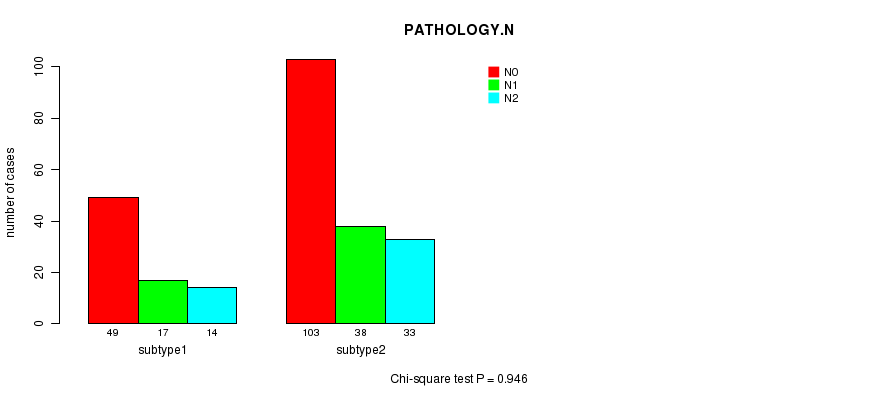
P value = 0.946 (Chi-square test)
Table S74. Clustering Approach #7: 'MIRseq cHierClus subtypes' versus Clinical Feature #7: 'PATHOLOGY.N'
| nPatients | N0 | N1 | N2 |
|---|---|---|---|
| ALL | 152 | 55 | 47 |
| subtype1 | 49 | 17 | 14 |
| subtype2 | 103 | 38 | 33 |
Figure S67. Get High-res Image Clustering Approach #7: 'MIRseq cHierClus subtypes' versus Clinical Feature #7: 'PATHOLOGY.N'
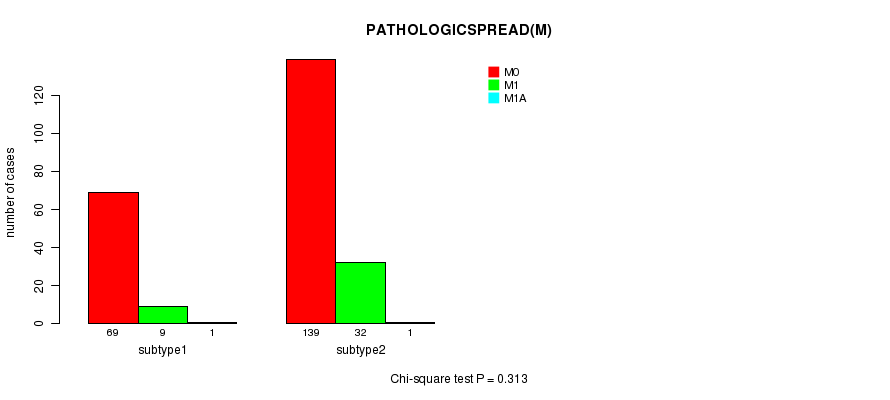
P value = 0.313 (Chi-square test)
Table S75. Clustering Approach #7: 'MIRseq cHierClus subtypes' versus Clinical Feature #8: 'PATHOLOGICSPREAD(M)'
| nPatients | M0 | M1 | M1A |
|---|---|---|---|
| ALL | 208 | 41 | 2 |
| subtype1 | 69 | 9 | 1 |
| subtype2 | 139 | 32 | 1 |
Figure S68. Get High-res Image Clustering Approach #7: 'MIRseq cHierClus subtypes' versus Clinical Feature #8: 'PATHOLOGICSPREAD(M)'
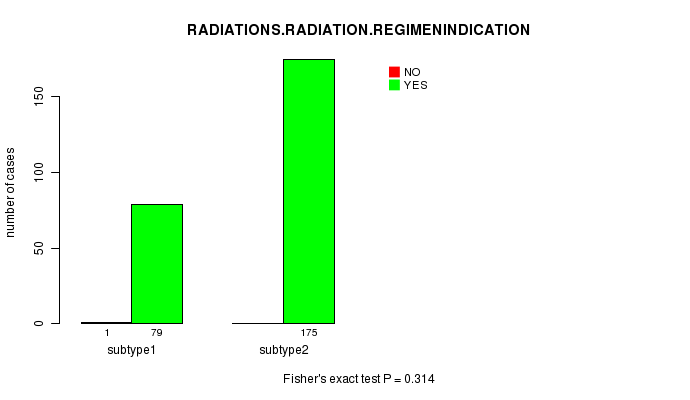
P value = 0.314 (Fisher's exact test)
Table S76. Clustering Approach #7: 'MIRseq cHierClus subtypes' versus Clinical Feature #9: 'RADIATIONS.RADIATION.REGIMENINDICATION'
| nPatients | NO | YES |
|---|---|---|
| ALL | 254 | 1 |
| subtype1 | 79 | 1 |
| subtype2 | 175 | 0 |
Figure S69. Get High-res Image Clustering Approach #7: 'MIRseq cHierClus subtypes' versus Clinical Feature #9: 'RADIATIONS.RADIATION.REGIMENINDICATION'
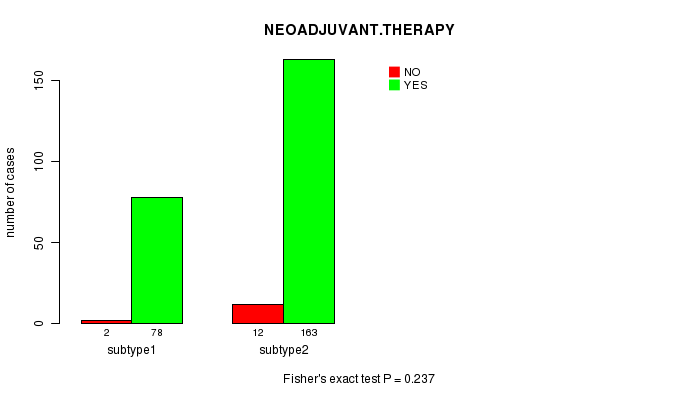
P value = 0.237 (Fisher's exact test)
Table S77. Clustering Approach #7: 'MIRseq cHierClus subtypes' versus Clinical Feature #10: 'NEOADJUVANT.THERAPY'
| nPatients | NO | YES |
|---|---|---|
| ALL | 241 | 14 |
| subtype1 | 78 | 2 |
| subtype2 | 163 | 12 |
Figure S70. Get High-res Image Clustering Approach #7: 'MIRseq cHierClus subtypes' versus Clinical Feature #10: 'NEOADJUVANT.THERAPY'
-
Cluster data file = COADREAD.mergedcluster.txt
-
Clinical data file = COADREAD.clin.merged.picked.txt
-
Number of patients = 585
-
Number of clustering approaches = 7
-
Number of selected clinical features = 10
-
Exclude small clusters that include fewer than K patients, K = 3
consensus non-negative matrix factorization clustering approach (Brunet et al. 2004)
Resampling-based clustering method (Monti et al. 2003)
For survival clinical features, the Kaplan-Meier survival curves of tumors with and without gene mutations were plotted and the statistical significance P values were estimated by logrank test (Bland and Altman 2004) using the 'survdiff' function in R
For continuous numerical clinical features, one-way analysis of variance (Howell 2002) was applied to compare the clinical values between tumor subtypes using 'anova' function in R
For binary clinical features, two-tailed Fisher's exact tests (Fisher 1922) were used to estimate the P values using the 'fisher.test' function in R
For multi-class clinical features (nominal or ordinal), Chi-square tests (Greenwood and Nikulin 1996) were used to estimate the P values using the 'chisq.test' function in R
For continuous numerical clinical features, two-tailed Student's t test with unequal variance (Lehmann and Romano 2005) was applied to compare the clinical values between two tumor subtypes using 't.test' function in R
This is an experimental feature. The full results of the analysis summarized in this report can be downloaded from the TCGA Data Coordination Center.