This pipeline uses various statistical tests to identify mRNAs whose expression levels correlated to selected clinical features.
Testing the association between 12042 genes and 7 clinical features across 519 samples, statistically thresholded by Q value < 0.05, 6 clinical features related to at least one genes.
-
21 genes correlated to 'Time to Death'.
-
CLEC5A , EFEMP2 , NCOA4 , ATP5C1 , DIRAS3 , ...
-
76 genes correlated to 'AGE'.
-
RANBP17 , FBXO17 , TUSC3 , KIAA0495 , NOL3 , ...
-
22 genes correlated to 'GENDER'.
-
DDX3Y , RPS4Y1 , EIF1AY , JARID1D , NLGN4Y , ...
-
11 genes correlated to 'HISTOLOGICAL.TYPE'.
-
DNAJA2 , SUPT4H1 , TMED2 , PDIA6 , PPARD , ...
-
2 genes correlated to 'RADIATIONS.RADIATION.REGIMENINDICATION'.
-
HOXD10 , HOXD11
-
1 gene correlated to 'NEOADJUVANT.THERAPY'.
-
HOXD10
-
No genes correlated to 'KARNOFSKY.PERFORMANCE.SCORE'
Complete statistical result table is provided in Supplement Table 1
Table 1. Get Full Table This table shows the clinical features, statistical methods used, and the number of genes that are significantly associated with each clinical feature at Q value < 0.05.
| Clinical feature | Statistical test | Significant genes | Associated with | Associated with | ||
|---|---|---|---|---|---|---|
| Time to Death | Cox regression test | N=21 | shorter survival | N=11 | longer survival | N=10 |
| AGE | Spearman correlation test | N=76 | older | N=42 | younger | N=34 |
| GENDER | t test | N=22 | male | N=11 | female | N=11 |
| KARNOFSKY PERFORMANCE SCORE | Spearman correlation test | N=0 | ||||
| HISTOLOGICAL TYPE | t test | N=11 | untreated primary (de novo) gbm | N=3 | treated primary gbm | N=8 |
| RADIATIONS RADIATION REGIMENINDICATION | t test | N=2 | yes | N=2 | no | N=0 |
| NEOADJUVANT THERAPY | t test | N=1 | yes | N=1 | no | N=0 |
Table S1. Basic characteristics of clinical feature: 'Time to Death'
| Time to Death | Duration (Months) | 0.1-127.6 (median=9.9) |
| censored | N = 116 | |
| death | N = 403 | |
| Significant markers | N = 21 | |
| associated with shorter survival | 11 | |
| associated with longer survival | 10 |
Table S2. Get Full Table List of top 10 genes significantly associated with 'Time to Death' by Cox regression test
| HazardRatio | Wald_P | Q | C_index | |
|---|---|---|---|---|
| CLEC5A | 1.23 | 7.107e-08 | 0.00086 | 0.584 |
| EFEMP2 | 1.3 | 7.708e-08 | 0.00093 | 0.542 |
| NCOA4 | 0.56 | 8.196e-08 | 0.00099 | 0.442 |
| ATP5C1 | 0.59 | 8.228e-08 | 0.00099 | 0.451 |
| DIRAS3 | 1.22 | 1.111e-07 | 0.0013 | 0.558 |
| RANBP17 | 0.46 | 1.833e-07 | 0.0022 | 0.427 |
| ANKRD26 | 0.39 | 2.458e-07 | 0.003 | 0.446 |
| HIST3H2A | 0.82 | 3.552e-07 | 0.0043 | 0.427 |
| ZIC3 | 0.48 | 6.625e-07 | 0.008 | 0.444 |
| FZD7 | 1.23 | 1.054e-06 | 0.013 | 0.556 |
Figure S1. Get High-res Image As an example, this figure shows the association of CLEC5A to 'Time to Death'. four curves present the cumulative survival rates of 4 quartile subsets of patients. P value = 7.11e-08 with univariate Cox regression analysis using continuous log-2 expression values.
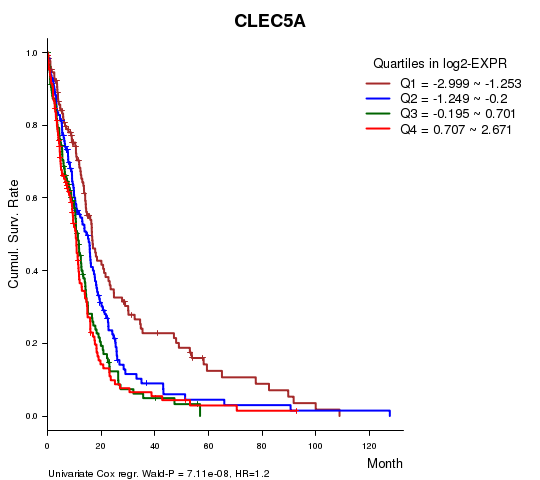
Table S3. Basic characteristics of clinical feature: 'AGE'
| AGE | Mean (SD) | 57.68 (14) |
| Significant markers | N = 76 | |
| pos. correlated | 42 | |
| neg. correlated | 34 |
Table S4. Get Full Table List of top 10 genes significantly correlated to 'AGE' by Spearman correlation test
| SpearmanCorr | corrP | Q | |
|---|---|---|---|
| RANBP17 | -0.316 | 1.677e-13 | 2.02e-09 |
| FBXO17 | 0.3024 | 1.966e-12 | 2.37e-08 |
| TUSC3 | -0.2972 | 4.787e-12 | 5.76e-08 |
| KIAA0495 | 0.279 | 9.796e-11 | 1.18e-06 |
| NOL3 | 0.2745 | 2.002e-10 | 2.41e-06 |
| PPA1 | -0.2725 | 2.734e-10 | 3.29e-06 |
| H2AFY2 | -0.2638 | 1.037e-09 | 1.25e-05 |
| DRG2 | 0.2628 | 1.203e-09 | 1.45e-05 |
| NCOA4 | -0.2621 | 1.343e-09 | 1.62e-05 |
| ENOSF1 | -0.2585 | 2.273e-09 | 2.73e-05 |
Figure S2. Get High-res Image As an example, this figure shows the association of RANBP17 to 'AGE'. P value = 1.68e-13 with Spearman correlation analysis. The straight line presents the best linear regression.
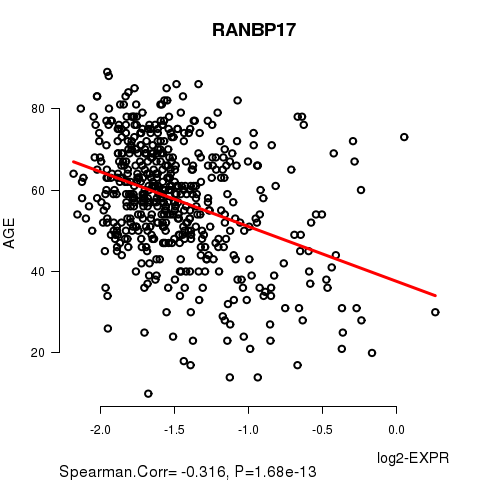
Table S5. Basic characteristics of clinical feature: 'GENDER'
| GENDER | Labels | N |
| FEMALE | 204 | |
| MALE | 315 | |
| Significant markers | N = 22 | |
| Higher in MALE | 11 | |
| Higher in FEMALE | 11 |
Table S6. Get Full Table List of top 10 genes differentially expressed by 'GENDER'
| T(pos if higher in 'MALE') | ttestP | Q | AUC | |
|---|---|---|---|---|
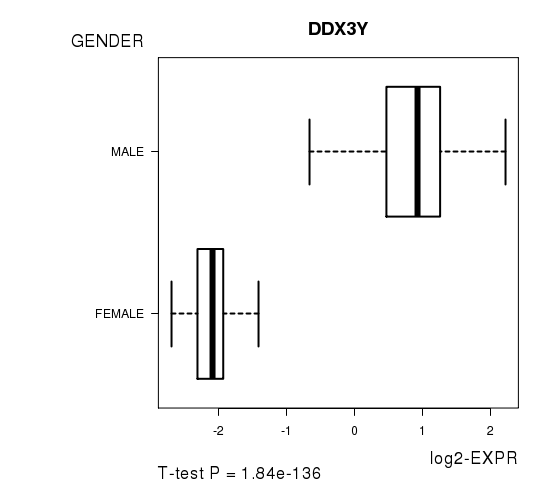
| DDX3Y | 36.26 | 1.84e-136 | 2.22e-132 | 0.9553 |
| RPS4Y1 | 38.53 | 3.922e-134 | 4.72e-130 | 0.9462 |
| EIF1AY | 33.94 | 9.44e-130 | 1.14e-125 | 0.95 |
| JARID1D | 33.27 | 3.066e-129 | 3.69e-125 | 0.9532 |
| NLGN4Y | 29.89 | 3.328e-113 | 4.01e-109 | 0.9427 |
| USP9Y | 20.76 | 6.502e-70 | 7.83e-66 | 0.9124 |
| CYORF15B | 18.9 | 6.583e-61 | 7.92e-57 | 0.8974 |
| UTY | 19.11 | 1.285e-57 | 1.55e-53 | 0.8926 |
| HDHD1A | -12.33 | 2.408e-29 | 2.9e-25 | 0.8028 |
| ZFX | -12.16 | 1.049e-28 | 1.26e-24 | 0.8149 |
Figure S3. Get High-res Image As an example, this figure shows the association of DDX3Y to 'GENDER'. P value = 1.84e-136 with T-test analysis.
No gene related to 'KARNOFSKY.PERFORMANCE.SCORE'.
Table S7. Basic characteristics of clinical feature: 'KARNOFSKY.PERFORMANCE.SCORE'
| KARNOFSKY.PERFORMANCE.SCORE | Mean (SD) | 77.12 (14) |
| Significant markers | N = 0 |
Table S8. Basic characteristics of clinical feature: 'HISTOLOGICAL.TYPE'
| HISTOLOGICAL.TYPE | Labels | N |
| TREATED PRIMARY GBM | 20 | |
| UNTREATED PRIMARY (DE NOVO) GBM | 361 | |
| Significant markers | N = 11 | |
| Higher in UNTREATED PRIMARY (DE NOVO) GBM | 3 | |
| Higher in TREATED PRIMARY GBM | 8 |
Table S9. Get Full Table List of top 10 genes differentially expressed by 'HISTOLOGICAL.TYPE'
| T(pos if higher in 'UNTREATED PRIMARY (DE NOVO) GBM') | ttestP | Q | AUC | |
|---|---|---|---|---|
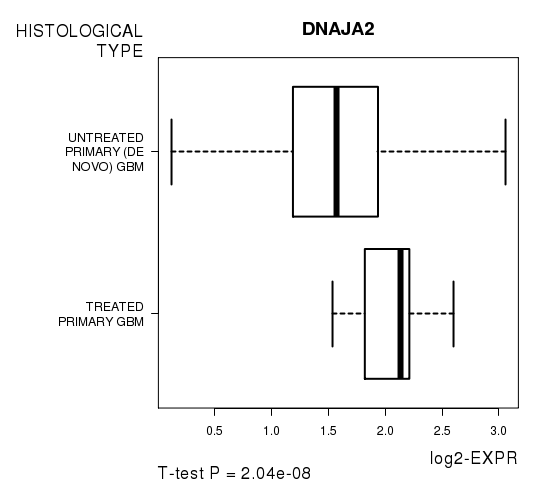
| DNAJA2 | -7.64 | 2.045e-08 | 0.000246 | 0.8003 |
| SUPT4H1 | -6.46 | 3.723e-07 | 0.00448 | 0.7659 |
| TMED2 | -6.74 | 3.959e-07 | 0.00477 | 0.7924 |
| PDIA6 | -6.49 | 1.151e-06 | 0.0139 | 0.8152 |
| PPARD | 6.41 | 1.641e-06 | 0.0198 | 0.8359 |
| RBM3 | -5.79 | 2.249e-06 | 0.0271 | 0.7061 |
| DISC1 | 6.28 | 2.262e-06 | 0.0272 | 0.8265 |
| PTHR1 | 5.82 | 2.485e-06 | 0.0299 | 0.7352 |
| MARCH5 | -6.33 | 2.885e-06 | 0.0347 | 0.8494 |
| NSUN3 | -6.03 | 3.515e-06 | 0.0423 | 0.8141 |
Figure S4. Get High-res Image As an example, this figure shows the association of DNAJA2 to 'HISTOLOGICAL.TYPE'. P value = 2.04e-08 with T-test analysis.
2 genes related to 'RADIATIONS.RADIATION.REGIMENINDICATION'.
Table S10. Basic characteristics of clinical feature: 'RADIATIONS.RADIATION.REGIMENINDICATION'
| RADIATIONS.RADIATION.REGIMENINDICATION | Labels | N |
| NO | 359 | |
| YES | 160 | |
| Significant markers | N = 2 | |
| Higher in YES | 2 | |
| Higher in NO | 0 |
Table S11. Get Full Table List of 2 genes differentially expressed by 'RADIATIONS.RADIATION.REGIMENINDICATION'
| T(pos if higher in 'YES') | ttestP | Q | AUC | |
|---|---|---|---|---|
| HOXD10 | 5.32 | 2.289e-07 | 0.00276 | 0.6442 |
| HOXD11 | 4.78 | 2.76e-06 | 0.0332 | 0.6317 |
Figure S5. Get High-res Image As an example, this figure shows the association of HOXD10 to 'RADIATIONS.RADIATION.REGIMENINDICATION'. P value = 2.29e-07 with T-test analysis.
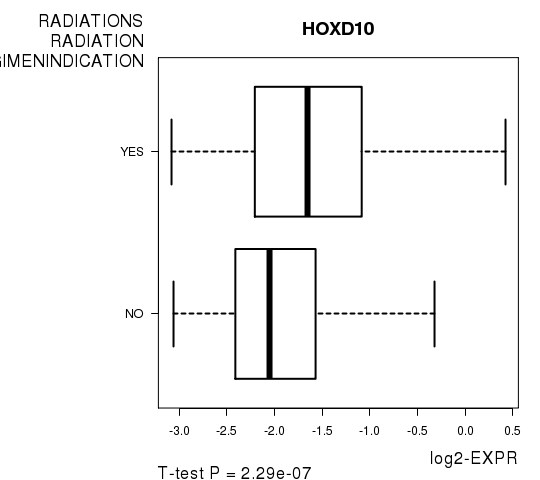
Table S12. Basic characteristics of clinical feature: 'NEOADJUVANT.THERAPY'
| NEOADJUVANT.THERAPY | Labels | N |
| NO | 312 | |
| YES | 207 | |
| Significant markers | N = 1 | |
| Higher in YES | 1 | |
| Higher in NO | 0 |
Table S13. Get Full Table List of one gene differentially expressed by 'NEOADJUVANT.THERAPY'
| T(pos if higher in 'YES') | ttestP | Q | AUC | |
|---|---|---|---|---|
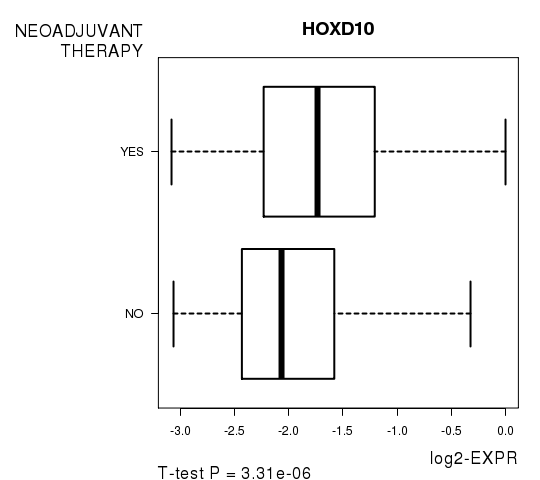
| HOXD10 | 4.72 | 3.306e-06 | 0.0398 | 0.6276 |
Figure S6. Get High-res Image As an example, this figure shows the association of HOXD10 to 'NEOADJUVANT.THERAPY'. P value = 3.31e-06 with T-test analysis.
-
Expresson data file = GBM.medianexp.txt
-
Clinical data file = GBM.clin.merged.picked.txt
-
Number of patients = 519
-
Number of genes = 12042
-
Number of clinical features = 7
For survival clinical features, Wald's test in univariate Cox regression analysis with proportional hazards model (Andersen and Gill 1982) was used to estimate the P values using the 'coxph' function in R. Kaplan-Meier survival curves were plot using the four quartile subgroups of patients based on expression levels
For continuous numerical clinical features, Spearman's rank correlation coefficients (Spearman 1904) and two-tailed P values were estimated using 'cor.test' function in R
For two-class clinical features, two-tailed Student's t test with unequal variance (Lehmann and Romano 2005) was applied to compare the log2-expression levels between the two clinical classes using 't.test' function in R
For multiple hypothesis correction, Q value is the False Discovery Rate (FDR) analogue of the P value (Benjamini and Hochberg 1995), defined as the minimum FDR at which the test may be called significant. We used the 'Benjamini and Hochberg' method of 'p.adjust' function in R to convert P values into Q values.
This is an experimental feature. The full results of the analysis summarized in this report can be downloaded from the TCGA Data Coordination Center.