This report serves to describe the mutational landscape and properties of a given individual set, as well as rank genes and genesets according to mutational significance. MutSig v2.0 was used to generate the results found in this report.
Working with individual set: GBM.
Number of patients in set: 276
The input for this pipeline is a set of individuals with the following files associated for each:
1. An annotated .maf file describing the mutations called for the respective individual, and their properties.
2. A .wig file that contains information about the coverage of the sample.
Significantly mutated genes (q ≤ 0.1): 223
Mutations seen in COSMIC: 445
Significantly mutated genes in COSMIC territory: 55
Genes with clustered mutations (&le 3 aa apart): 385
Significantly mutated genesets: 170
Significantly mutated genesets: (excluding sig. mutated genes): 0
Table 1. Get Full Table Table representing breakdown of mutations by type.
| type | count |
|---|---|
| De_novo_Start_InFrame | 6 |
| De_novo_Start_OutOfFrame | 10 |
| Frame_Shift_Del | 812 |
| Frame_Shift_Ins | 362 |
| In_Frame_Del | 328 |
| In_Frame_Ins | 36 |
| Indel | 1 |
| Missense_Mutation | 23424 |
| Nonsense_Mutation | 1745 |
| Nonstop_Mutation | 17 |
| Silent | 8876 |
| Splice_Site_DNP | 11 |
| Splice_Site_Del | 101 |
| Splice_Site_Ins | 28 |
| Splice_Site_ONP | 1 |
| Splice_Site_SNP | 469 |
| Start_Codon_Del | 2 |
| Start_Codon_Ins | 1 |
| Stop_Codon_Del | 2 |
| Total | 36232 |
Table 2. Get Full Table A breakdown of mutation rates per category discovered for this individual set.
| category | n | N | rate | rate_per_mb | relative_rate |
|---|---|---|---|---|---|
| *CpG->T | 8794 | 406970401 | 0.000022 | 22 | 6 |
| *Cp(A/C/T)->T | 3993 | 3448378213 | 1.2e-06 | 1.2 | 0.32 |
| C->(G/A) | 5881 | 3855348614 | 1.5e-06 | 1.5 | 0.43 |
| A->mut | 4753 | 3770634164 | 1.3e-06 | 1.3 | 0.35 |
| indel+null | 3856 | 7625982864 | 5.1e-07 | 0.51 | 0.14 |
| double_null | 79 | 7625982864 | 1e-08 | 0.01 | 0.0029 |
| Total | 27356 | 7625982864 | 3.6e-06 | 3.6 | 1 |
The x axis represents the samples. The y axis represents the exons, one row per exon, and they are sorted by average coverage across samples. For exons with exactly the same average coverage, they are sorted next by the %GC of the exon. (The secondary sort is especially useful for the zero-coverage exons at the bottom).
Figure 1.
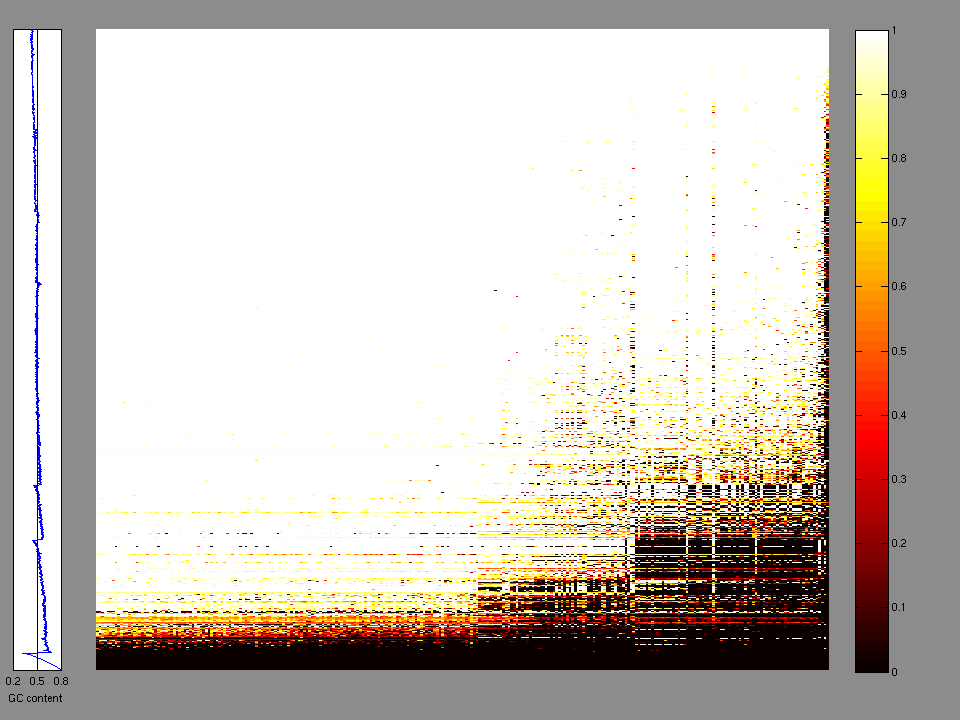
Figure 2.

Figure 3. Get High-res Image The matrix in the center of the figure represents individual mutations in patient samples, color-coded by type of mutation, for the significantly mutated genes. The rate of synonymous and non-synonymous mutations is displayed at the top of the matrix. The barplot on the left of the matrix shows the number of mutations in each gene. The percentages represent the fraction of tumors with at least one mutation in the specified gene. The barplot to the right of the matrix displays the q-values for the most significantly mutated genes. The purple boxplots below the matrix (only displayed if required columns are present in the provided MAF) represent the distributions of allelic fractions observed in each sample. The plot at the bottom represents the base substitution distribution of individual samples, using the same categories that were used to calculate significance.

Table 3. Get Full Table A Ranked List of Significantly Mutated Genes. Number of significant genes found: 223. Number of genes displayed: 35
| rank | gene | description | N | n | npat | nsite | nsil | n1 | n2 | n3 | n4 | n5 | n6 | p_classic | p_ks | p_cons | p_joint | p | q |
|---|---|---|---|---|---|---|---|---|---|---|---|---|---|---|---|---|---|---|---|
| 1 | PIK3R1 | phosphoinositide-3-kinase, regulatory subunit 1 (alpha) | 642722 | 17 | 17 | 14 | 0 | 0 | 3 | 2 | 4 | 8 | 0 | <1.00e-15 | 0.000013 | 0.0044 | 0.000018 | <0.00 | <0.00 |
| 2 | IDH1 | isocitrate dehydrogenase 1 (NADP+), soluble | 349470 | 15 | 15 | 2 | 0 | 14 | 0 | 1 | 0 | 0 | 0 | 1.11e-15 | 2e-07 | 0.97 | 0.000011 | 0.00 | 0.00 |
| 3 | KRTAP5-5 | keratin associated protein 5-5 | 181491 | 18 | 16 | 7 | 0 | 0 | 0 | 3 | 1 | 14 | 0 | 1.22e-15 | 0.00082 | 1 | 0.0023 | 1.11e-16 | 6.61e-13 |
| 4 | PIK3CA | phosphoinositide-3-kinase, catalytic, alpha polypeptide | 885302 | 19 | 19 | 17 | 1 | 3 | 5 | 2 | 7 | 2 | 0 | 1.24e-14 | 0.015 | 0.0048 | 0.00068 | 3.33e-16 | 1.12e-12 |
| 5 | TP53 | tumor protein p53 | 344937 | 89 | 80 | 63 | 1 | 23 | 15 | 12 | 13 | 24 | 2 | <1.00e-15 | 2e-07 | 2e-07 | 0 | <1.00e-15 | <1.12e-12 |
| 6 | EGFR | epidermal growth factor receptor (erythroblastic leukemia viral (v-erb-b) oncogene homolog, avian) | 1089173 | 58 | 54 | 26 | 5 | 9 | 21 | 23 | 5 | 0 | 0 | <1.00e-15 | 2e-07 | 2e-07 | 0 | <1.00e-15 | <1.12e-12 |
| 7 | MICALCL | MICAL C-terminal like | 537385 | 13 | 13 | 3 | 0 | 0 | 0 | 0 | 1 | 12 | 0 | 1.55e-13 | 2e-07 | 0.6 | 0 | <1.00e-15 | <1.12e-12 |
| 8 | C7orf52 | chromosome 7 open reading frame 52 | 247344 | 6 | 6 | 2 | 1 | 1 | 5 | 0 | 0 | 0 | 0 | 0.00043 | 0.0017 | 4e-07 | 0 | <1.00e-15 | <1.12e-12 |
| 9 | KDSR | 3-ketodihydrosphingosine reductase | 270146 | 5 | 5 | 1 | 0 | 0 | 0 | 5 | 0 | 0 | 0 | 0.000095 | 2e-07 | 0.63 | 0 | <1.00e-15 | <1.12e-12 |
| 10 | PLA2G2A | phospholipase A2, group IIA (platelets, synovial fluid) | 123007 | 5 | 5 | 1 | 0 | 0 | 0 | 5 | 0 | 0 | 0 | 2.64e-06 | 2e-07 | 0.25 | 0 | <1.00e-15 | <1.12e-12 |
| 11 | MRM1 | mitochondrial rRNA methyltransferase 1 homolog (S. cerevisiae) | 284558 | 4 | 4 | 1 | 0 | 0 | 0 | 0 | 4 | 0 | 0 | 0.0016 | 4e-07 | 0.39 | 0 | <1.00e-15 | <1.12e-12 |
| 12 | CD4 | CD4 molecule | 379108 | 3 | 3 | 1 | 1 | 0 | 0 | 0 | 3 | 0 | 0 | 0.015 | 3.8e-06 | 0.00045 | 0 | <1.00e-15 | <1.12e-12 |
| 13 | ACSM2B | acyl-CoA synthetase medium-chain family member 2B | 454814 | 2 | 2 | 2 | 2 | 0 | 0 | 0 | 1 | 1 | 0 | 0.11 | 0.00024 | 0.68 | 0 | <1.00e-15 | <1.12e-12 |
| 14 | C1orf100 | chromosome 1 open reading frame 100 | 126907 | 2 | 2 | 2 | 0 | 0 | 0 | 0 | 0 | 2 | 0 | 0.036 | 0.013 | 0.75 | 0 | <1.00e-15 | <1.12e-12 |
| 15 | TAPBPL | TAP binding protein-like | 353808 | 2 | 2 | 2 | 1 | 0 | 1 | 0 | 0 | 1 | 0 | 0.22 | 0.00055 | 0.68 | 0 | <1.00e-15 | <1.12e-12 |
| 16 | ABCA3 | ATP-binding cassette, sub-family A (ABC1), member 3 | 1218196 | 3 | 1 | 3 | 1 | 0 | 0 | 2 | 1 | 0 | 0 | 0.94 | 6e-07 | 0.012 | 0 | <1.00e-15 | <1.12e-12 |
| 17 | PTEN | phosphatase and tensin homolog (mutated in multiple advanced cancers 1) | 314597 | 80 | 79 | 65 | 0 | 7 | 19 | 8 | 11 | 35 | 0 | <1.00e-15 | 0.039 | 0.38 | 0.064 | <2.44e-15 | <2.56e-12 |
| 18 | RB1 | retinoblastoma 1 (including osteosarcoma) | 722445 | 21 | 21 | 19 | 1 | 1 | 1 | 1 | 0 | 18 | 0 | <1.00e-15 | 0.064 | 0.38 | 0.12 | <4.55e-15 | <4.51e-12 |
| 19 | FOXRED1 | FAD-dependent oxidoreductase domain containing 1 | 345284 | 9 | 9 | 1 | 0 | 0 | 0 | 0 | 9 | 0 | 0 | 1.92e-09 | 2e-07 | 0.93 | 0.000019 | 1.18e-12 | 1.11e-09 |
| 20 | NF1 | neurofibromin 1 (neurofibromatosis, von Recklinghausen disease, Watson disease) | 2380799 | 31 | 25 | 30 | 1 | 2 | 5 | 3 | 4 | 14 | 3 | 8.04e-14 | 0.47 | 0.71 | 0.64 | 1.63e-12 | 1.45e-09 |
| 21 | SPTA1 | spectrin, alpha, erythrocytic 1 (elliptocytosis 2) | 2040988 | 30 | 26 | 28 | 5 | 12 | 4 | 6 | 1 | 7 | 0 | 5.42e-13 | 0.27 | 0.29 | 0.37 | 6.05e-12 | 5.14e-09 |
| 22 | COMMD4 | COMM domain containing 4 | 147026 | 6 | 6 | 1 | 0 | 0 | 0 | 6 | 0 | 0 | 0 | 2.28e-07 | 2e-07 | 1 | 0.000015 | 9.26e-11 | 7.32e-08 |
| 23 | CRYBA2 | crystallin, beta A2 | 136089 | 6 | 6 | 3 | 1 | 0 | 0 | 5 | 1 | 0 | 0 | 1.83e-07 | 2e-07 | 0.86 | 0.000019 | 9.43e-11 | 7.32e-08 |
| 24 | RYR2 | ryanodine receptor 2 (cardiac) | 3381004 | 36 | 28 | 35 | 7 | 21 | 3 | 6 | 6 | 0 | 0 | 3.66e-11 | 0.11 | 0.37 | 0.14 | 1.42e-10 | 1.06e-07 |
| 25 | NRBP2 | nuclear receptor binding protein 2 | 119779 | 4 | 4 | 1 | 0 | 0 | 4 | 0 | 0 | 0 | 0 | 0.000072 | 4e-07 | 0.99 | 6e-07 | 1.08e-09 | 7.70e-07 |
| 26 | FUT7 | fucosyltransferase 7 (alpha (1,3) fucosyltransferase) | 113313 | 5 | 5 | 1 | 0 | 0 | 0 | 5 | 0 | 0 | 0 | 4.02e-06 | 2e-07 | 0.97 | 0.000015 | 1.50e-09 | 1.03e-06 |
| 27 | HMP19 | 143577 | 5 | 5 | 1 | 0 | 0 | 0 | 5 | 0 | 0 | 0 | 8.41e-06 | 2e-07 | 0.93 | 0.000011 | 2.23e-09 | 1.47e-06 | |
| 28 | MST1 | macrophage stimulating 1 (hepatocyte growth factor-like) | 467340 | 10 | 9 | 6 | 0 | 2 | 0 | 0 | 1 | 7 | 0 | 6.93e-09 | 0.0053 | 0.89 | 0.014 | 2.35e-09 | 1.50e-06 |
| 29 | ZNF704 | zinc finger protein 704 | 335326 | 5 | 5 | 1 | 0 | 0 | 0 | 0 | 0 | 5 | 0 | 0.00014 | 4e-07 | 0.91 | 8e-07 | 2.70e-09 | 1.66e-06 |
| 30 | FLG | filaggrin | 3183335 | 30 | 28 | 30 | 13 | 12 | 6 | 6 | 3 | 3 | 0 | 1.25e-09 | 0.6 | 0.044 | 0.13 | 3.94e-09 | 2.29e-06 |
| 31 | EML2 | echinoderm microtubule associated protein like 2 | 517871 | 8 | 8 | 3 | 1 | 0 | 0 | 0 | 0 | 8 | 0 | 4.45e-06 | 0.000014 | 0.82 | 0.000038 | 3.97e-09 | 2.29e-06 |
| 32 | DNASE1L1 | deoxyribonuclease I-like 1 | 189681 | 6 | 6 | 2 | 1 | 1 | 0 | 5 | 0 | 0 | 0 | 1.24e-06 | 0.0001 | 0.081 | 0.00014 | 4.15e-09 | 2.31e-06 |
| 33 | FOXC1 | forkhead box C1 | 130178 | 4 | 4 | 3 | 1 | 0 | 0 | 3 | 1 | 0 | 0 | 0.00026 | 2e-07 | 0.94 | 8e-07 | 4.92e-09 | 2.66e-06 |
| 34 | TMEM45A | transmembrane protein 45A | 233464 | 5 | 5 | 1 | 0 | 0 | 0 | 0 | 5 | 0 | 0 | 0.000033 | 2e-07 | 0.08 | 7.2e-06 | 5.47e-09 | 2.87e-06 |
| 35 | ZNF784 | zinc finger protein 784 | 87173 | 3 | 3 | 1 | 0 | 0 | 0 | 0 | 0 | 3 | 0 | 0.00029 | 3.4e-06 | 0.42 | 3.6e-06 | 2.23e-08 | 0.000011 |
Note:
N - number of sequenced bases in this gene across the individual set.
n - number of (nonsilent) mutations in this gene across the individual set.
npat - number of patients (individuals) with at least one nonsilent mutation.
nsite - number of unique sites having a non-silent mutation.
nsil - number of silent mutations in this gene across the individual set.
n1 - number of nonsilent mutations of type: *CpG->T .
n2 - number of nonsilent mutations of type: *Cp(A/C/T)->T .
n3 - number of nonsilent mutations of type: C->(G/A) .
n4 - number of nonsilent mutations of type: A->mut .
n5 - number of nonsilent mutations of type: indel+null .
null - mutation category that includes nonsense, frameshift, splice-site mutations
p_classic = p-value for the observed amount of nonsilent mutations being elevated in this gene
p_ns_s = p-value for the observed nonsilent/silent ratio being elevated in this gene
p = p-value (overall)
q = q-value, False Discovery Rate (Benjamini-Hochberg procedure)
In this analysis, COSMIC is used as a filter to increase power by restricting the territory of each gene. Cosmic version: v48.
Table 4. Get Full Table Significantly mutated genes (COSMIC territory only). To access the database please go to: COSMIC. Number of significant genes found: 55. Number of genes displayed: 10
| rank | gene | description | n | cos | n_cos | N_cos | cos_ev | p | q |
|---|---|---|---|---|---|---|---|---|---|
| 1 | PTEN | phosphatase and tensin homolog (mutated in multiple advanced cancers 1) | 80 | 728 | 79 | 200928 | 2714 | 0 | 0 |
| 2 | TP53 | tumor protein p53 | 89 | 823 | 89 | 227148 | 26312 | 0 | 0 |
| 3 | IDH1 | isocitrate dehydrogenase 1 (NADP+), soluble | 15 | 3 | 15 | 828 | 22380 | 2.9e-14 | 4.4e-11 |
| 4 | PIK3R1 | phosphoinositide-3-kinase, regulatory subunit 1 (alpha) | 17 | 33 | 9 | 9108 | 20 | 3.1e-13 | 3.5e-10 |
| 5 | PIK3CA | phosphoinositide-3-kinase, catalytic, alpha polypeptide | 19 | 184 | 15 | 50784 | 3911 | 1.5e-12 | 1.3e-09 |
| 6 | EGFR | epidermal growth factor receptor (erythroblastic leukemia viral (v-erb-b) oncogene homolog, avian) | 58 | 218 | 46 | 60168 | 640 | 1.7e-12 | 1.3e-09 |
| 7 | RB1 | retinoblastoma 1 (including osteosarcoma) | 21 | 267 | 11 | 73692 | 30 | 2e-12 | 1.3e-09 |
| 8 | NF1 | neurofibromin 1 (neurofibromatosis, von Recklinghausen disease, Watson disease) | 31 | 285 | 10 | 78660 | 18 | 2.8e-12 | 1.6e-09 |
| 9 | PTPN11 | protein tyrosine phosphatase, non-receptor type 11 (Noonan syndrome 1) | 6 | 31 | 4 | 8556 | 16 | 3.6e-08 | 0.000018 |
| 10 | BRAF | v-raf murine sarcoma viral oncogene homolog B1 | 6 | 88 | 5 | 24288 | 42058 | 3.9e-08 | 0.000018 |
Note:
n - number of (nonsilent) mutations in this gene across the individual set.
cos = number of unique mutated sites in this gene in COSMIC
n_cos = overlap between n and cos.
N_cos = number of individuals times cos.
cos_ev = total evidence: number of reports in COSMIC for mutations seen in this gene.
p = p-value for seeing the observed amount of overlap in this gene)
q = q-value, False Discovery Rate (Benjamini-Hochberg procedure)
Table 5. Get Full Table Genes with Clustered Mutations
| num | gene | desc | n | mindist | nmuts0 | nmuts3 | nmuts12 | npairs0 | npairs3 | npairs12 |
|---|---|---|---|---|---|---|---|---|---|---|
| 2963 | EGFR | epidermal growth factor receptor (erythroblastic leukemia viral (v-erb-b) oncogene homolog, avian) | 58 | 0 | 158 | 172 | 199 | 158 | 172 | 199 |
| 4499 | IDH1 | isocitrate dehydrogenase 1 (NADP+), soluble | 15 | 0 | 105 | 105 | 105 | 105 | 105 | 105 |
| 10104 | TP53 | tumor protein p53 | 89 | 0 | 69 | 161 | 418 | 69 | 161 | 418 |
| 3606 | FOXRED1 | FAD-dependent oxidoreductase domain containing 1 | 9 | 0 | 36 | 36 | 36 | 36 | 36 | 36 |
| 7900 | PTEN | phosphatase and tensin homolog (mutated in multiple advanced cancers 1) | 80 | 0 | 25 | 74 | 157 | 25 | 74 | 157 |
| 5436 | LPHN1 | latrophilin 1 | 10 | 0 | 16 | 16 | 18 | 16 | 16 | 18 |
| 878 | BBS1 | Bardet-Biedl syndrome 1 | 8 | 0 | 15 | 15 | 15 | 15 | 15 | 15 |
| 2202 | COL5A3 | collagen, type V, alpha 3 | 11 | 0 | 15 | 15 | 15 | 15 | 15 | 15 |
| 2215 | COMMD4 | COMM domain containing 4 | 6 | 0 | 15 | 15 | 15 | 15 | 15 | 15 |
| 2845 | DSCAM | Down syndrome cell adhesion molecule | 10 | 0 | 15 | 15 | 15 | 15 | 15 | 15 |
Note:
n - number of mutations in this gene in the individual set.
mindist - distance (in aa) between closest pair of mutations in this gene
npairs3 - how many pairs of mutations are within 3 aa of each other.
npairs12 - how many pairs of mutations are within 12 aa of each other.
Table 6. Get Full Table A Ranked List of Significantly Mutated Genesets. (Source: MSigDB GSEA Cannonical Pathway Set).Number of significant genesets found: 170. Number of genesets displayed: 10
| rank | geneset | description | genes | N_genes | mut_tally | N | n | npat | nsite | nsil | n1 | n2 | n3 | n4 | n5 | n6 | p | q |
|---|---|---|---|---|---|---|---|---|---|---|---|---|---|---|---|---|---|---|
| 1 | HSA04010_MAPK_SIGNALING_PATHWAY | Genes involved in MAPK signaling pathway | ACVR1B, ACVR1C, AKT1, AKT2, AKT3, ARRB1, ARRB2, ATF2, ATF4, BDNF, BRAF, CACNA1A, CACNA1B, CACNA1C, CACNA1D, CACNA1E, CACNA1F, CACNA1G, CACNA1H, CACNA1I, CACNA1S, CACNA2D1, CACNA2D2, CACNA2D3, CACNA2D4, CACNB1, CACNB2, CACNB3, CACNB4, CACNG1, CACNG2, CACNG3, CACNG4, CACNG5, CACNG6, CACNG7, CACNG8, CASP3, CD14, CDC25B, CDC42, CHP, CHUK, CRK, CRKL, DAXX, DDIT3, DUSP1, DUSP10, DUSP14, DUSP16, DUSP2, DUSP3, DUSP4, DUSP5, DUSP6, DUSP7, DUSP8, DUSP9, ECSIT, EGF, EGFR, ELK1, ELK4, EVI1, FAS, FASLG, FGF1, FGF10, FGF11, FGF12, FGF13, FGF14, FGF16, FGF17, FGF18, FGF19, FGF2, FGF20, FGF21, FGF22, FGF23, FGF3, FGF4, FGF5, FGF6, FGF7, FGF8, FGF9, FGFR1, FGFR2, FGFR3, FGFR4, FLNA, FLNB, FLNC, FOS, GADD45A, GADD45B, GADD45G, GNA12, GNG12, GRB2, HRAS, IKBKB, IKBKG, IL1A, IL1B, IL1R1, IL1R2, JUN, JUND, KRAS, LOC653852, MAP2K1, MAP2K1IP1, MAP2K2, MAP2K3, MAP2K4, MAP2K5, MAP2K6, MAP2K7, MAP3K1, MAP3K10, MAP3K12, MAP3K13, MAP3K14, MAP3K2, MAP3K3, MAP3K4, MAP3K5, MAP3K6, MAP3K7, MAP3K7IP1, MAP3K7IP2, MAP3K8, MAP4K1, MAP4K2, MAP4K3, MAP4K4, MAPK1, MAPK10, MAPK11, MAPK12, MAPK13, MAPK14, MAPK3, MAPK7, MAPK8, MAPK8IP1, MAPK8IP2, MAPK8IP3, MAPK9, MAPKAPK2, MAPKAPK3, MAPKAPK5, MAPT, MAX, MEF2C, MKNK1, MKNK2, MOS, MRAS, MYC, NF1, NFATC2, NFATC4, NFKB1, NFKB2, NGFB, NLK, NR4A1, NRAS, NTF3, NTF5, NTRK1, NTRK2, PAK1, PAK2, PDGFA, PDGFB, PDGFRA, PDGFRB, PLA2G10, PLA2G12A, PLA2G12B, PLA2G1B, PLA2G2A, PLA2G2D, PLA2G2E, PLA2G2F, PLA2G3, PLA2G4A, PLA2G5, PLA2G6, PPM1A, PPM1B, PPP3CA, PPP3CB, PPP3CC, PPP3R1, PPP3R2, PPP5C, PRKACA, PRKACB, PRKACG, PRKCA, PRKCB1, PRKCG, PRKX, PRKY, PTPN5, PTPN7, PTPRR, RAC1, RAC2, RAC3, RAF1, RAP1A, RAP1B, RAPGEF2, RASA1, RASA2, RASGRF1, RASGRF2, RASGRP1, RASGRP2, RASGRP3, RASGRP4, RPS6KA1, RPS6KA2, RPS6KA3, RPS6KA4, RPS6KA5, RPS6KA6, RRAS, RRAS2, SOS1, SOS2, SRF, STK3, STK4, STMN1, TAOK1, TAOK2, TAOK3, TGFB1, TGFB2, TGFB3, TGFBR1, TGFBR2, TNF, TNFRSF1A, TP53, TRAF2, TRAF6, ZAK | 246 | ACVR1C(2), AKT1(1), AKT2(1), AKT3(1), ATF2(1), ATF4(1), BDNF(1), BRAF(6), CACNA1A(4), CACNA1B(7), CACNA1C(5), CACNA1D(9), CACNA1E(9), CACNA1F(10), CACNA1G(6), CACNA1H(9), CACNA1I(5), CACNA1S(12), CACNA2D1(8), CACNA2D2(1), CACNA2D3(3), CACNA2D4(1), CACNB2(1), CACNB3(1), CACNG1(1), CACNG2(1), CACNG3(4), CACNG6(1), CACNG7(1), CACNG8(1), CD14(2), CDC25B(1), CHUK(4), DAXX(4), DDIT3(1), DUSP10(1), DUSP14(1), DUSP16(1), DUSP2(2), DUSP4(3), DUSP8(1), DUSP9(1), EGF(3), EGFR(58), ELK1(1), ELK4(1), FGF10(1), FGF13(1), FGF14(2), FGF18(1), FGF2(1), FGF20(2), FGF21(1), FGF23(3), FGF3(1), FGF6(3), FGF9(1), FGFR1(3), FGFR2(3), FGFR3(2), FGFR4(3), FLNA(14), FLNB(4), FLNC(6), FOS(1), GADD45B(1), GNA12(2), IKBKB(2), IL1R1(2), KRAS(1), MAP2K1(1), MAP2K2(1), MAP2K3(1), MAP2K5(1), MAP2K7(1), MAP3K1(5), MAP3K10(3), MAP3K12(5), MAP3K13(2), MAP3K14(2), MAP3K2(1), MAP3K3(4), MAP3K4(2), MAP3K5(1), MAP3K6(5), MAP3K7(2), MAP4K1(1), MAP4K2(1), MAP4K3(1), MAP4K4(5), MAPK1(3), MAPK13(1), MAPK14(1), MAPK3(2), MAPK7(3), MAPK8IP1(3), MAPK8IP2(3), MAPK8IP3(5), MAPK9(2), MAPKAPK2(1), MAPKAPK3(1), MAPT(1), MAX(2), MEF2C(1), MKNK1(1), NF1(31), NFATC2(1), NFATC4(2), NFKB1(1), NFKB2(1), NR4A1(3), NRAS(1), NTF3(1), NTRK1(4), NTRK2(1), PAK1(2), PDGFRA(10), PDGFRB(5), PLA2G12A(3), PLA2G2A(5), PLA2G2F(2), PLA2G3(2), PLA2G4A(4), PLA2G5(1), PLA2G6(3), PPM1B(1), PPP3CB(1), PPP3R1(1), PPP3R2(1), PPP5C(1), PRKACG(1), PRKCA(3), PRKCG(1), PRKX(2), PTPRR(2), RAP1B(2), RAPGEF2(4), RASA2(1), RASGRF1(5), RASGRF2(6), RASGRP1(1), RASGRP2(2), RASGRP3(2), RASGRP4(3), RPS6KA2(2), RPS6KA3(5), RRAS2(3), SOS1(1), SOS2(4), SRF(2), STK3(2), STK4(1), STMN1(1), TAOK1(1), TAOK2(2), TAOK3(2), TGFB1(1), TGFB2(1), TGFBR1(1), TGFBR2(5), TNFRSF1A(2), TP53(89), TRAF2(2), ZAK(1) | 111569559 | 586 | 212 | 515 | 148 | 184 | 87 | 111 | 98 | 100 | 6 | <1.00e-15 | <1.28e-14 |
| 2 | HSA04115_P53_SIGNALING_PATHWAY | Genes involved in p53 signaling pathway | APAF1, ATM, ATR, BAI1, BAX, BBC3, BID, CASP3, CASP8, CASP9, CCNB1, CCNB2, CCNB3, CCND1, CCND2, CCND3, CCNE1, CCNE2, CCNG1, CCNG2, CD82, CDC2, CDK2, CDK4, CDK6, CDKN1A, CDKN2A, CHEK1, CHEK2, CYCS, DDB2, EI24, FAS, GADD45A, GADD45B, GADD45G, GTSE1, IGF1, IGFBP3, LRDD, MDM2, MDM4, P53AIP1, PERP, PMAIP1, PPM1D, PTEN, RCHY1, RFWD2, RPRM, RRM2, RRM2B, SCOTIN, SERPINB5, SERPINE1, SESN1, SESN2, SESN3, SFN, SIAH1, STEAP3, THBS1, TNFRSF10B, TP53, TP53I3, TP73, TSC2, ZMAT3 | 64 | APAF1(1), ATM(7), ATR(9), BAI1(1), BID(4), CCNB3(1), CCND2(1), CCNE1(1), CCNE2(1), CCNG1(2), CDKN1A(1), CDKN2A(3), CHEK1(5), DDB2(1), GADD45B(1), GTSE1(2), IGFBP3(1), MDM2(1), MDM4(2), PERP(3), PPM1D(1), PTEN(80), RFWD2(2), RPRM(1), SERPINB5(2), SERPINE1(1), SESN1(2), SESN2(1), SESN3(3), STEAP3(2), THBS1(3), TP53(89), TP53I3(2), TP73(1), TSC2(2) | 25535861 | 240 | 158 | 196 | 28 | 44 | 51 | 32 | 39 | 71 | 3 | <1.00e-15 | <1.28e-14 |
| 3 | ST_INTEGRIN_SIGNALING_PATHWAY | Integrins are transmembrane receptors that mediate cell growth, survival, and migration by binding to ligands in the extracellular matrix. | ABL1, ACK1, ACTN1, ACTR2, ACTR3, AKT1, AKT2, AKT3, ANGPTL2, ARHGEF6, ARHGEF7, BCAR1, BRAF, CAV1, CDC42, CDKN2A, CRK, CSE1L, DDEF1, DOCK1, EPHB2, FYN, GRAF, GRB2, GRB7, GRF2, GRLF1, ILK, ITGA1, ITGA10, ITGA11, ITGA2, ITGA3, ITGA4, ITGA5, ITGA6, ITGA7, ITGA8, ITGA9, ITGB3BP, MAP2K4, MAP2K7, MAP3K11, MAPK1, MAPK10, MAPK8, MAPK8IP1, MAPK8IP2, MAPK8IP3, MAPK9, MRAS, MYLK, MYLK2, P4HB, PAK1, PAK2, PAK3, PAK4, PAK6, PAK7, PIK3CA, PIK3CB, PKLR, PLCG1, PLCG2, PTEN, PTK2, RAF1, RALA, RHO, ROCK1, ROCK2, SHC1, SOS1, SOS2, SRC, TERF2IP, TLN1, TLN2, VASP, WAS, ZYX | 78 | ABL1(1), ACTN1(1), ACTR3(2), AKT1(1), AKT2(1), AKT3(1), ANGPTL2(2), ARHGEF7(1), BRAF(6), CAV1(1), CDKN2A(3), CSE1L(2), DOCK1(9), EPHB2(6), GRB7(1), GRLF1(4), ILK(2), ITGA1(1), ITGA10(3), ITGA11(2), ITGA2(4), ITGA3(2), ITGA4(7), ITGA5(1), ITGA6(2), ITGA7(3), ITGA8(7), ITGA9(1), MAP2K7(1), MAPK1(3), MAPK8IP1(3), MAPK8IP2(3), MAPK8IP3(5), MAPK9(2), MYLK(7), MYLK2(1), PAK1(2), PAK3(2), PAK6(1), PAK7(3), PIK3CA(19), PIK3CB(2), PKLR(4), PLCG1(3), PLCG2(11), PTEN(80), PTK2(2), RALA(1), RHO(1), ROCK1(3), ROCK2(4), SOS1(1), SOS2(4), SRC(2), TERF2IP(3), TLN1(6), TLN2(5), VASP(2), ZYX(2) | 48062722 | 265 | 143 | 245 | 58 | 68 | 49 | 41 | 50 | 57 | 0 | <1.00e-15 | <1.28e-14 |
| 4 | ST_FAS_SIGNALING_PATHWAY | The Fas receptor induces apoptosis and NF-kB activation when bound to Fas ligand. | ADPRT, ALG2, BAK1, BAX, BFAR, BIRC4, BTK, CAD, CASP10, CASP3, CASP8, CASP8AP2, CD7, CDK2AP1, CSNK1A1, DAXX, DEDD, DEDD2, DFFA, DIABLO, EGFR, EPHB2, FADD, FAF1, FAIM2, FREQ, HRB, HSPB1, IL1A, IL8, MAP2K4, MAP2K7, MAP3K1, MAP3K5, MAPK1, MAPK10, MAPK8, MAPK8IP1, MAPK8IP2, MAPK8IP3, MAPK9, MCP, MET, NFAT5, NFKB1, NFKB2, NFKBIA, NFKBIB, NFKBIE, NFKBIL1, NFKBIL2, NR0B2, PFN1, PFN2, PTPN13, RALBP1, RIPK1, ROCK1, SMPD1, TNFRSF6, TNFRSF6B, TP53, TPX2, TRAF2, TUFM, VIL2 | 59 | BTK(1), CAD(6), CASP8AP2(3), CD7(2), DAXX(4), DEDD2(2), DFFA(1), DIABLO(1), EGFR(58), EPHB2(6), FAF1(3), FAIM2(1), MAP2K7(1), MAP3K1(5), MAP3K5(1), MAPK1(3), MAPK8IP1(3), MAPK8IP2(3), MAPK8IP3(5), MAPK9(2), MET(5), NFAT5(3), NFKB1(1), NFKB2(1), NFKBIA(2), NFKBIB(1), NFKBIE(1), NFKBIL1(1), NFKBIL2(6), NR0B2(3), PTPN13(4), RALBP1(3), RIPK1(1), ROCK1(3), TNFRSF6B(2), TP53(89), TPX2(1), TRAF2(2), TUFM(1) | 28393004 | 241 | 142 | 182 | 36 | 57 | 53 | 55 | 36 | 38 | 2 | <1.00e-15 | <1.28e-14 |
| 5 | SIG_CHEMOTAXIS | Genes related to chemotaxis | ACTR2, ACTR3, AKT1, AKT2, AKT3, ANGPTL2, ARHGAP1, ARHGAP4, ARHGEF11, BTK, CDC42, CFL1, CFL2, GDI1, GDI2, INPPL1, ITPR1, ITPR2, ITPR3, LIMK1, MYLK, MYLK2, P101-PI3K, PAK1, PAK2, PAK3, PAK4, PAK6, PAK7, PDK1, PIK3CA, PIK3CD, PIK3CG, PIK3R1, PITX2, PPP1R13B, PTEN, RACGAP1, RHO, ROCK1, ROCK2, RPS4X, SAG, WASF1, WASL | 44 | ACTR3(2), AKT1(1), AKT2(1), AKT3(1), ANGPTL2(2), ARHGAP1(1), ARHGAP4(1), ARHGEF11(3), BTK(1), CFL2(1), INPPL1(4), ITPR1(7), ITPR2(11), ITPR3(11), LIMK1(1), MYLK(7), MYLK2(1), PAK1(2), PAK3(2), PAK6(1), PAK7(3), PIK3CA(19), PIK3CD(2), PIK3CG(12), PIK3R1(17), PTEN(80), RACGAP1(1), RHO(1), ROCK1(3), ROCK2(4), RPS4X(1), WASF1(1) | 27707675 | 205 | 139 | 185 | 32 | 44 | 40 | 31 | 32 | 58 | 0 | <1.00e-15 | <1.28e-14 |
| 6 | TELPATHWAY | Telomerase is a ribonucleotide protein that adds telomeric repeats to the 3' ends of chromosomes. | AKT1, BCL2, EGFR, G22P1, HSPCA, IGF1R, KRAS2, MYC, POLR2A, PPP2CA, PRKCA, RB1, TEP1, TERF1, TERT, TNKS, TP53, XRCC5 | 15 | AKT1(1), BCL2(3), EGFR(58), IGF1R(2), POLR2A(2), PPP2CA(1), PRKCA(3), RB1(21), TEP1(4), TERT(8), TNKS(4), TP53(89), XRCC5(1) | 11328048 | 197 | 139 | 135 | 11 | 45 | 40 | 42 | 22 | 46 | 2 | <1.00e-15 | <1.28e-14 |
| 7 | HSA04210_APOPTOSIS | Genes involved in apoptosis | AIFM1, AKT1, AKT2, AKT3, APAF1, ATM, BAD, BAX, BCL2, BCL2L1, BID, BIRC2, BIRC3, BIRC4, CAPN1, CAPN2, CASP10, CASP3, CASP6, CASP7, CASP8, CASP9, CFLAR, CHP, CHUK, CSF2RB, CYCS, DFFA, DFFB, ENDOG, FADD, FAS, FASLG, IKBKB, IKBKG, IL1A, IL1B, IL1R1, IL1RAP, IL3, IL3RA, IRAK1, IRAK2, IRAK3, IRAK4, MAP3K14, MYD88, NFKB1, NFKB2, NFKBIA, NGFB, NTRK1, PIK3CA, PIK3CB, PIK3CD, PIK3CG, PIK3R1, PIK3R2, PIK3R3, PIK3R5, PPP3CA, PPP3CB, PPP3CC, PPP3R1, PPP3R2, PRKACA, PRKACB, PRKACG, PRKAR1A, PRKAR1B, PRKAR2A, PRKAR2B, RELA, RIPK1, TNF, TNFRSF10A, TNFRSF10B, TNFRSF10C, TNFRSF10D, TNFRSF1A, TNFSF10, TP53, TRADD, TRAF2 | 79 | AIFM1(4), AKT1(1), AKT2(1), AKT3(1), APAF1(1), ATM(7), BCL2(3), BID(4), BIRC2(1), BIRC3(1), CAPN1(5), CAPN2(1), CASP6(1), CHUK(4), CSF2RB(4), DFFA(1), DFFB(3), IKBKB(2), IL1R1(2), IL1RAP(2), IRAK1(2), IRAK2(3), IRAK3(2), IRAK4(2), MAP3K14(2), NFKB1(1), NFKB2(1), NFKBIA(2), NTRK1(4), PIK3CA(19), PIK3CB(2), PIK3CD(2), PIK3CG(12), PIK3R1(17), PIK3R2(5), PIK3R5(2), PPP3CB(1), PPP3R1(1), PPP3R2(1), PRKACG(1), PRKAR2A(1), PRKAR2B(1), RIPK1(1), TNFRSF10A(2), TNFRSF1A(2), TNFSF10(5), TP53(89), TRAF2(2) | 32877178 | 234 | 133 | 199 | 39 | 59 | 40 | 36 | 53 | 44 | 2 | <1.00e-15 | <1.28e-14 |
| 8 | HSA00562_INOSITOL_PHOSPHATE_METABOLISM | Genes involved in inositol phosphate metabolism | CARKL, FN3K, IMPA1, IMPA2, INPP1, INPP4A, INPP4B, INPP5A, INPP5B, INPP5E, INPPL1, IPMK, ISYNA1, ITGB1BP3, ITPK1, ITPKA, ITPKB, MINPP1, MIOX, OCRL, PI4KA, PI4KB, PIB5PA, PIK3C3, PIK3CA, PIK3CB, PIK3CD, PIK3CG, PIP4K2A, PIP4K2B, PIP4K2C, PIP5K1A, PIP5K1B, PIP5K1C, PIP5K3, PLCB1, PLCB2, PLCB3, PLCB4, PLCD1, PLCD3, PLCD4, PLCE1, PLCG1, PLCG2, PLCZ1, PTEN, PTPMT1, SKIP, SYNJ1, SYNJ2 | 47 | FN3K(1), IMPA1(1), INPP1(2), INPP4A(1), INPP4B(1), INPP5A(1), INPP5B(2), INPP5E(1), INPPL1(4), ITGB1BP3(2), ITPKB(2), MINPP1(1), MIOX(1), OCRL(1), PI4KA(1), PI4KB(3), PIK3C3(1), PIK3CA(19), PIK3CB(2), PIK3CD(2), PIK3CG(12), PIP4K2A(3), PIP4K2B(1), PIP4K2C(3), PIP5K1B(2), PIP5K1C(4), PLCB1(3), PLCB2(5), PLCB3(5), PLCB4(3), PLCD1(1), PLCD3(2), PLCD4(2), PLCE1(7), PLCG1(3), PLCG2(11), PLCZ1(1), PTEN(80), SYNJ1(1), SYNJ2(7) | 29194980 | 205 | 131 | 187 | 33 | 50 | 41 | 29 | 31 | 53 | 1 | <1.00e-15 | <1.28e-14 |
| 9 | HSA04012_ERBB_SIGNALING_PATHWAY | Genes involved in ErbB signaling pathway | ABL1, ABL2, AKT1, AKT2, AKT3, ARAF, AREG, BAD, BRAF, BTC, CAMK2A, CAMK2B, CAMK2D, CAMK2G, CBL, CBLB, CBLC, CDKN1A, CDKN1B, CRK, CRKL, EGF, EGFR, EIF4EBP1, ELK1, ERBB2, ERBB3, ERBB4, EREG, FRAP1, GAB1, GRB2, GSK3B, HBEGF, HRAS, JUN, KRAS, MAP2K1, MAP2K2, MAP2K4, MAP2K7, MAPK1, MAPK10, MAPK3, MAPK8, MAPK9, MYC, NCK1, NCK2, NRAS, NRG1, NRG2, NRG3, NRG4, PAK1, PAK2, PAK3, PAK4, PAK6, PAK7, PIK3CA, PIK3CB, PIK3CD, PIK3CG, PIK3R1, PIK3R2, PIK3R3, PIK3R5, PLCG1, PLCG2, PRKCA, PRKCB1, PRKCG, PTK2, RAF1, RPS6KB1, RPS6KB2, SHC1, SHC2, SHC3, SHC4, SOS1, SOS2, SRC, STAT5A, STAT5B, TGFA | 85 | ABL1(1), ABL2(1), AKT1(1), AKT2(1), AKT3(1), ARAF(1), AREG(1), BRAF(6), CAMK2B(1), CAMK2D(1), CAMK2G(4), CBL(1), CBLB(1), CBLC(1), CDKN1A(1), CDKN1B(3), EGF(3), EGFR(58), ELK1(1), ERBB2(7), ERBB3(4), ERBB4(1), GAB1(1), GSK3B(1), KRAS(1), MAP2K1(1), MAP2K2(1), MAP2K7(1), MAPK1(3), MAPK3(2), MAPK9(2), NRAS(1), NRG1(4), NRG2(1), NRG3(1), PAK1(2), PAK3(2), PAK6(1), PAK7(3), PIK3CA(19), PIK3CB(2), PIK3CD(2), PIK3CG(12), PIK3R1(17), PIK3R2(5), PIK3R5(2), PLCG1(3), PLCG2(11), PRKCA(3), PRKCG(1), PTK2(2), RPS6KB1(1), SHC3(1), SHC4(1), SOS1(1), SOS2(4), SRC(2), STAT5A(2), STAT5B(2), TGFA(2) | 40950577 | 223 | 129 | 181 | 52 | 58 | 44 | 49 | 46 | 26 | 0 | <1.00e-15 | <1.28e-14 |
| 10 | HSA04110_CELL_CYCLE | Genes involved in cell cycle | ABL1, ANAPC1, ANAPC10, ANAPC11, ANAPC2, ANAPC4, ANAPC5, ANAPC7, ATM, ATR, BUB1, BUB1B, BUB3, CCNA1, CCNA2, CCNB1, CCNB2, CCNB3, CCND1, CCND2, CCND3, CCNE1, CCNE2, CCNH, CDC14A, CDC14B, CDC16, CDC2, CDC20, CDC23, CDC25A, CDC25B, CDC25C, CDC26, CDC27, CDC45L, CDC6, CDC7, CDK2, CDK4, CDK6, CDK7, CDKN1A, CDKN1B, CDKN1C, CDKN2A, CDKN2B, CDKN2C, CDKN2D, CHEK1, CHEK2, CREBBP, CUL1, DBF4, E2F1, E2F2, E2F3, EP300, ESPL1, FZR1, GADD45A, GADD45B, GADD45G, GSK3B, hCG_1982709, HDAC1, HDAC2, LOC440917, LOC728919, MAD1L1, MAD2L1, MAD2L2, MCM2, MCM3, MCM4, MCM5, MCM6, MCM7, MDM2, ORC1L, ORC2L, ORC3L, ORC4L, ORC5L, ORC6L, PCNA, PKMYT1, PLK1, PRKDC, PTTG1, PTTG2, RB1, RBL1, RBL2, RBX1, SFN, SKP1, SKP2, SMAD2, SMAD3, SMAD4, SMC1A, SMC1B, TFDP1, TGFB1, TGFB2, TGFB3, TP53, WEE1, YWHAB, YWHAE, YWHAG, YWHAH, YWHAQ, YWHAZ | 109 | ABL1(1), ANAPC1(4), ANAPC10(2), ANAPC11(1), ANAPC2(1), ANAPC4(2), ANAPC5(2), ATM(7), ATR(9), BUB1(4), BUB1B(1), CCNA1(1), CCNB3(1), CCND2(1), CCNE1(1), CCNE2(1), CCNH(2), CDC20(2), CDC23(1), CDC25B(1), CDC27(3), CDC7(2), CDKN1A(1), CDKN1B(3), CDKN2A(3), CDKN2B(1), CDKN2C(4), CDKN2D(1), CHEK1(5), CREBBP(8), CUL1(5), E2F2(3), E2F3(2), EP300(5), ESPL1(8), GADD45B(1), GSK3B(1), HDAC1(1), HDAC2(3), MAD1L1(1), MCM2(3), MCM3(3), MCM4(3), MCM5(1), MCM6(1), MCM7(2), MDM2(1), PCNA(1), PKMYT1(1), PLK1(1), PRKDC(5), PTTG2(2), RB1(21), RBL1(3), RBL2(1), SMAD3(1), SMAD4(1), SMC1A(7), SMC1B(3), TGFB1(1), TGFB2(1), TP53(89), YWHAB(1), YWHAE(2) | 54445600 | 261 | 129 | 232 | 42 | 53 | 45 | 52 | 32 | 76 | 3 | <1.00e-15 | <1.28e-14 |
Table 7. Get Full Table A Ranked List of Significantly Mutated Genesets (Excluding Significantly Mutated Genes). Number of significant genesets found: 0. Number of genesets displayed: 10
| rank | geneset | description | genes | N_genes | mut_tally | N | n | npat | nsite | nsil | n1 | n2 | n3 | n4 | n5 | n6 | p | q |
|---|---|---|---|---|---|---|---|---|---|---|---|---|---|---|---|---|---|---|
| 1 | HSA04640_HEMATOPOIETIC_CELL_LINEAGE | Genes involved in hematopoietic cell lineage | ANPEP, CD14, CD19, CD1A, CD1B, CD1C, CD1D, CD1E, CD2, CD22, CD24, CD33, CD34, CD36, CD37, CD38, CD3D, CD3E, CD3G, CD4, CD44, CD5, CD55, CD59, CD7, CD8A, CD8B, CD9, CR1, CR2, CSF1, CSF1R, CSF2, CSF2RA, CSF3, CSF3R, DNTT, EPO, EPOR, FCER2, FCGR1A, FLT3, FLT3LG, GP1BA, GP1BB, GP5, GP9, GYPA, HLA-DRA, HLA-DRB1, HLA-DRB3, HLA-DRB4, HLA-DRB5, IL11, IL11RA, IL1A, IL1B, IL1R1, IL1R2, IL2RA, IL3, IL3RA, IL4, IL4R, IL5, IL5RA, IL6, IL6R, IL7, IL7R, IL9R, ITGA1, ITGA2, ITGA2B, ITGA3, ITGA4, ITGA5, ITGA6, ITGAM, ITGB3, KIT, KITLG, MME, MS4A1, TFRC, THPO, TNF, TPO | 79 | ANPEP(3), CD14(2), CD19(2), CD1B(1), CD1D(2), CD1E(1), CD22(5), CD33(3), CD34(2), CD36(2), CD38(2), CD3E(1), CD3G(1), CD44(4), CD5(2), CD55(2), CD7(2), CD8A(1), CD8B(1), CD9(2), CR1(5), CR2(6), CSF1R(3), CSF3R(2), DNTT(2), EPO(1), EPOR(1), FLT3(7), FLT3LG(1), GP9(1), GYPA(1), HLA-DRA(1), HLA-DRB1(2), HLA-DRB5(2), IL1R1(2), IL2RA(3), IL4(1), IL4R(6), IL5RA(1), IL6(2), IL6R(2), IL7(1), IL7R(1), ITGA1(1), ITGA2(4), ITGA2B(2), ITGA3(2), ITGA4(7), ITGA5(1), ITGA6(2), ITGAM(8), ITGB3(1), KIT(3), KITLG(2), MS4A1(2), TFRC(2), THPO(1), TPO(4) | 31351365 | 137 | 76 | 135 | 51 | 54 | 23 | 28 | 20 | 12 | 0 | 0.00028 | 0.11 |
| 2 | HSA04070_PHOSPHATIDYLINOSITOL_SIGNALING_SYSTEM | Genes involved in phosphatidylinositol signaling system | CALM1, CALM2, CALM3, CALML3, CALML6, CARKL, CDIPT, CDS1, CDS2, DGKA, DGKB, DGKD, DGKE, DGKG, DGKH, DGKI, DGKQ, DGKZ, FN3K, IMPA1, IMPA2, INPP1, INPP4A, INPP4B, INPP5A, INPP5B, INPP5D, INPP5E, INPPL1, ITGB1BP3, ITPK1, ITPKA, ITPKB, ITPR1, ITPR2, ITPR3, OCRL, PI4KA, PI4KB, PIB5PA, PIK3C2A, PIK3C2B, PIK3C2G, PIK3C3, PIK3CA, PIK3CB, PIK3CD, PIK3CG, PIK3R1, PIK3R2, PIK3R3, PIK3R5, PIP4K2A, PIP4K2B, PIP4K2C, PIP5K1A, PIP5K1B, PIP5K1C, PIP5K3, PLCB1, PLCB2, PLCB3, PLCB4, PLCD1, PLCD3, PLCD4, PLCE1, PLCG1, PLCG2, PLCZ1, PRKCA, PRKCB1, PRKCG, PTEN, PTPMT1, SKIP, SYNJ1, SYNJ2 | 69 | CALM1(1), CDS1(1), DGKB(1), DGKD(6), DGKE(2), DGKG(5), DGKH(3), DGKI(3), DGKQ(1), DGKZ(5), FN3K(1), IMPA1(1), INPP1(2), INPP4A(1), INPP4B(1), INPP5A(1), INPP5B(2), INPP5D(6), INPP5E(1), INPPL1(4), ITGB1BP3(2), ITPKB(2), ITPR1(7), ITPR2(11), ITPR3(11), OCRL(1), PI4KA(1), PI4KB(3), PIK3C2A(3), PIK3C2B(2), PIK3C3(1), PIK3CB(2), PIK3CD(2), PIK3CG(12), PIK3R2(5), PIK3R5(2), PIP4K2A(3), PIP4K2B(1), PIP4K2C(3), PIP5K1B(2), PIP5K1C(4), PLCB1(3), PLCB2(5), PLCB3(5), PLCB4(3), PLCD1(1), PLCD3(2), PLCD4(2), PLCE1(7), PLCG1(3), PLCG2(11), PLCZ1(1), PRKCA(3), PRKCG(1), SYNJ1(1), SYNJ2(7) | 46351323 | 183 | 92 | 181 | 48 | 68 | 29 | 33 | 25 | 27 | 1 | 0.00057 | 0.11 |
| 3 | GPCRDB_CLASS_A_RHODOPSIN_LIKE | ADORA1, ADORA2A, ADORA2B, ADORA3, ADRA1A, ADRA1B, ADRA1D, ADRA2A, ADRA2C, ADRB1, ADRB2, ADRB3, AGTR1, AGTR2, AGTRL1, AVPR1A, AVPR1B, AVPR2, BDKRB1, BDKRB2, BLR1, BRS3, C3AR1, C5R1, CCBP2, CCKAR, CCKBR, CCR1, CCR10, CCR2, CCR3, CCR4, CCR5, CCR6, CCR7, CCR8, CCR9, CCRL1, CCRL2, CHML, CHRM1, CHRM2, CHRM3, CHRM4, CHRM5, CMKLR1, CMKOR1, CNR1, CNR2, CX3CR1, CXCR3, CXCR4, DRD1, DRD2, DRD3, DRD4, DRD5, EDNRA, EDNRB, ELA3A, F2R, F2RL1, F2RL2, F2RL3, FPR1, FPRL1, FPRL2, FSHR, GALR1, GALR2, GALR3, GALT, GHSR, GNB2L1, GPR10, GPR147, GPR17, GPR173, GPR174, GPR23, GPR24, GPR27, GPR3, GPR30, GPR35, GPR37, GPR37L1, GPR4, GPR44, GPR50, GPR6, GPR63, GPR74, GPR77, GPR83, GPR85, GPR87, GPR92, GRPR, HCRTR1, HCRTR2, HRH1, HRH2, HRH3, HTR1A, HTR1B, HTR1D, HTR1E, HTR1F, HTR2A, HTR2B, HTR2C, HTR4, HTR5A, HTR6, HTR7, HTR7, LOC93164, IL8RA, IL8RB, LHCGR, LTB4R, MAS1, MC1R, MC3R, MC4R, MC5R, MLNR, MTNR1A, MTNR1B, NMBR, NMUR1, NMUR2, NPY1R, NPY2R, NPY5R, NPY6R, NTSR1, NTSR2, OPN1SW, OPN3, OPRD1, OPRK1, OPRL1, OPRM1, OR10A5, OR11A1, OR12D3, OR1C1, OR1F1, OR1Q1, OR2H1, OR5V1, OR5V1, OR12D3, OR7A5, OR7C1, OR8B8, OXTR, P2RY1, P2RY10, P2RY11, P2RY12, P2RY13, P2RY14, P2RY2, P2RY5, P2RY6, PPYR1, PTAFR, PTGDR, PTGER1, PTGER2, PTGER4, PTGFR, PTGIR, Rgr, RGR, RHO, RRH, SSTR1, SSTR2, SSTR3, SSTR4, SUCNR1, TBXA2R, TRHR | 158 | ADORA1(2), ADORA2B(1), ADORA3(1), ADRA1D(1), ADRA2C(4), ADRB1(1), ADRB2(1), AGTR1(2), AGTR2(1), AVPR1A(3), AVPR1B(1), BDKRB1(1), BDKRB2(3), BRS3(2), C3AR1(1), CCBP2(1), CCKAR(3), CCKBR(2), CCR1(2), CCR10(1), CCR3(2), CCR4(1), CCR6(2), CCR7(2), CCR8(1), CCR9(2), CHML(2), CHRM2(4), CHRM3(3), CMKLR1(1), CNR1(2), CNR2(3), CX3CR1(2), CXCR3(2), DRD1(2), DRD2(1), DRD3(1), DRD5(4), EDNRA(1), EDNRB(1), F2RL3(1), FPR1(1), FSHR(1), GALR1(3), GALR2(1), GALT(1), GHSR(4), GNB2L1(1), GPR17(1), GPR174(1), GPR27(3), GPR3(1), GPR37(3), GPR4(1), GPR50(3), GPR6(5), GPR83(4), GPR87(1), GRPR(1), HCRTR1(2), HCRTR2(1), HRH1(1), HRH2(5), HRH3(1), HTR1A(2), HTR1B(3), HTR1D(1), HTR1E(2), HTR1F(2), HTR2A(1), HTR2C(2), HTR4(1), HTR5A(4), HTR6(1), HTR7(1), LHCGR(1), MC3R(6), MC4R(3), MC5R(2), MLNR(1), NMUR1(2), NMUR2(5), NPY5R(4), NTSR1(2), OPN1SW(2), OPRK1(1), OPRL1(2), OPRM1(4), OR1F1(2), OR1Q1(1), OR2H1(4), OR7A5(1), OR7C1(1), OXTR(2), P2RY1(1), P2RY10(1), P2RY13(3), P2RY14(1), P2RY2(2), P2RY6(2), PPYR1(2), PTAFR(2), PTGDR(1), PTGER2(2), PTGER4(2), PTGFR(2), PTGIR(1), RHO(1), RRH(1), SSTR2(1), SSTR3(2), SSTR4(4), TRHR(2) | 46757547 | 219 | 105 | 217 | 84 | 99 | 27 | 38 | 40 | 15 | 0 | 0.0007 | 0.11 | |
| 4 | HSA04060_CYTOKINE_CYTOKINE_RECEPTOR_INTERACTION | Genes involved in cytokine-cytokine receptor interaction | ACVR1, ACVR1B, ACVR2A, ACVR2B, AMH, AMHR2, BMP2, BMP7, BMPR1A, BMPR1B, BMPR2, CCL1, CCL11, CCL13, CCL14, CCL15, CCL16, CCL17, CCL18, CCL19, CCL2, CCL20, CCL21, CCL22, CCL23, CCL24, CCL25, CCL26, CCL27, CCL28, CCL3, CCL4, CCL5, CCL7, CCL8, CCR1, CCR2, CCR3, CCR4, CCR5, CCR6, CCR7, CCR8, CCR9, CD27, CD40, CD40LG, CD70, CLCF1, CNTF, CNTFR, CRLF2, CSF1, CSF1R, CSF2, CSF2RA, CSF2RB, CSF3, CSF3R, CTF1, CX3CL1, CX3CR1, CXCL1, CXCL10, CXCL11, CXCL12, CXCL13, CXCL14, CXCL16, CXCL2, CXCL3, CXCL5, CXCL6, CXCL9, CXCR3, CXCR4, CXCR6, EDA, EDA2R, EDAR, EGF, EGFR, EPO, EPOR, FAS, FASLG, FLJ78302, FLT1, FLT3, FLT3LG, FLT4, GDF5, GH1, GH2, GHR, HGF, IFNA1, IFNA10, IFNA13, IFNA14, IFNA16, IFNA17, IFNA2, IFNA21, IFNA4, IFNA5, IFNA6, IFNA7, IFNA8, IFNAR1, IFNAR2, IFNB1, IFNE1, IFNG, IFNGR1, IFNGR2, IFNK, IFNW1, IL10, IL10RA, IL10RB, IL11, IL11RA, IL12A, IL12B, IL12RB1, IL12RB2, IL13, IL13RA1, IL15, IL15RA, IL17A, IL17B, IL17RA, IL17RB, IL18, IL18R1, IL18RAP, IL19, IL1A, IL1B, IL1R1, IL1R2, IL1RAP, IL2, IL20, IL20RA, IL21, IL21R, IL22, IL22RA1, IL22RA2, IL23A, IL23R, IL24, IL25, IL26, IL28A, IL28B, IL28RA, IL29, IL2RA, IL2RB, IL2RG, IL3, IL3RA, IL4, IL4R, IL5, IL5RA, IL6, IL6R, IL6ST, IL7, IL7R, IL8, IL8RA, IL8RB, IL9, IL9R, INHBA, INHBB, INHBC, INHBE, KDR, KIT, KITLG, LEP, LEPR, LIF, LIFR, LOC728045, LTA, LTB, LTBR, MET, MPL, NGFR, OSM, OSMR, PDGFB, PDGFC, PDGFRA, PDGFRB, PF4, PF4V1, PLEKHO2, PPBP, PRL, PRLR, RELT, TGFB1, TGFB2, TGFB3, TGFBR1, TGFBR2, TNF, TNFRSF10A, TNFRSF10B, TNFRSF10C, TNFRSF10D, TNFRSF11A, TNFRSF11B, TNFRSF12A, TNFRSF13B, TNFRSF13C, TNFRSF14, TNFRSF17, TNFRSF18, TNFRSF19, TNFRSF1A, TNFRSF1B, TNFRSF21, TNFRSF25, TNFRSF4, TNFRSF6B, TNFRSF8, TNFRSF9, TNFSF10, TNFSF11, TNFSF12, TNFSF13, TNFSF13B, TNFSF14, TNFSF15, TNFSF18, TNFSF4, TNFSF8, TNFSF9, TPO, TSLP, VEGFA, VEGFB, VEGFC, XCL1, XCL2, XCR1 | 238 | ACVR1(3), ACVR2B(1), AMHR2(3), BMPR1A(2), BMPR1B(1), BMPR2(2), CCL13(1), CCL15(1), CCL19(1), CCL2(2), CCL20(1), CCL22(1), CCL24(1), CCL26(1), CCL3(1), CCL5(1), CCL7(1), CCR1(2), CCR3(2), CCR4(1), CCR6(2), CCR7(2), CCR8(1), CCR9(2), CD70(1), CLCF1(1), CNTF(1), CSF1R(3), CSF2RB(4), CSF3R(2), CX3CL1(1), CX3CR1(2), CXCL1(1), CXCL13(1), CXCL6(3), CXCR3(2), CXCR6(1), EDA(3), EGF(3), EPO(1), EPOR(1), FLT1(2), FLT3(7), FLT3LG(1), FLT4(3), GDF5(2), GH1(1), GH2(2), GHR(3), HGF(4), IFNA13(1), IFNA14(1), IFNA17(1), IFNA21(1), IFNA5(1), IFNA7(2), IFNAR2(1), IFNB1(1), IFNG(1), IFNGR1(1), IFNGR2(1), IFNW1(1), IL10RA(1), IL12B(1), IL12RB1(4), IL12RB2(4), IL13RA1(1), IL15RA(1), IL17RB(1), IL18R1(1), IL18RAP(4), IL1R1(2), IL1RAP(2), IL2(1), IL21(1), IL21R(4), IL22(3), IL22RA1(1), IL23R(2), IL24(1), IL26(1), IL28A(1), IL28B(1), IL28RA(1), IL2RA(3), IL2RB(1), IL4(1), IL4R(6), IL5RA(1), IL6(2), IL6R(2), IL7(1), IL7R(1), INHBA(3), INHBB(2), INHBE(1), KDR(10), KIT(3), KITLG(2), LEPR(1), LIFR(1), LTBR(1), MET(5), MPL(2), NGFR(1), OSM(1), OSMR(2), PDGFC(3), PDGFRB(5), PPBP(2), PRL(3), RELT(1), TGFB1(1), TGFB2(1), TGFBR1(1), TGFBR2(5), TNFRSF10A(2), TNFRSF11A(3), TNFRSF13B(2), TNFRSF14(1), TNFRSF18(1), TNFRSF1A(2), TNFRSF1B(2), TNFRSF25(1), TNFRSF6B(2), TNFRSF8(3), TNFSF10(5), TNFSF11(4), TNFSF13B(2), TNFSF14(3), TNFSF18(1), TNFSF4(1), TNFSF8(1), TNFSF9(3), TPO(4), VEGFA(2), VEGFC(2), XCL1(2), XCL2(2), XCR1(1) | 66065757 | 271 | 115 | 270 | 80 | 94 | 38 | 60 | 45 | 34 | 0 | 0.00075 | 0.11 |
| 5 | HSA00040_PENTOSE_AND_GLUCURONATE_INTERCONVERSIONS | Genes involved in pentose and glucuronate interconversions | AKR1B1, DCXR, GUSB, RPE, UGDH, UGP2, UGT1A1, UGT1A10, UGT1A3, UGT1A4, UGT1A5, UGT1A6, UGT1A7, UGT1A8, UGT1A9, UGT2A1, UGT2A3, UGT2B10, UGT2B11, UGT2B15, UGT2B17, UGT2B28, UGT2B4, UGT2B7, XYLB | 24 | GUSB(3), RPE(1), UGP2(1), UGT1A1(1), UGT1A10(1), UGT1A3(1), UGT1A5(2), UGT1A6(2), UGT1A9(1), UGT2A1(5), UGT2A3(3), UGT2B10(1), UGT2B11(3), UGT2B17(1), UGT2B28(5), UGT2B4(5), UGT2B7(3), XYLB(4) | 9832004 | 43 | 32 | 42 | 16 | 12 | 6 | 11 | 10 | 4 | 0 | 0.001 | 0.12 |
| 6 | FXRPATHWAY | The nuclear receptor transcription factors FXR and LXR are activated by cholesterol metabolites and regulate cholesterol homeostasis. | FABP6, LDLR, NR0B2, NR1H3, NR1H4, RXRA | 6 | LDLR(4), NR0B2(3), NR1H3(1), NR1H4(3), RXRA(3) | 2161711 | 14 | 14 | 14 | 3 | 3 | 2 | 4 | 3 | 2 | 0 | 0.0011 | 0.12 |
| 7 | HSA04610_COMPLEMENT_AND_COAGULATION_CASCADES | Genes involved in complement and coagulation cascades | A2M, BDKRB1, BDKRB2, C1QA, C1QB, C1QC, C1R, C1S, C2, C3, C3AR1, C4A, C4B, C4BPA, C4BPB, C5, C5AR1, C6, C7, C8A, C8B, C8G, C9, CD46, CD55, CD59, CFB, CFD, CFH, CFI, CPB2, CR1, CR2, F10, F11, F12, F13A1, F13B, F2, F2R, F3, F5, F7, F8, F9, FGA, FGB, FGG, KLKB1, KNG1, MASP1, MASP2, MBL2, PLAT, PLAU, PLAUR, PLG, PROC, PROS1, SERPINA1, SERPINA5, SERPINC1, SERPIND1, SERPINE1, SERPINF2, SERPING1, TFPI, THBD, VWF | 67 | A2M(5), BDKRB1(1), BDKRB2(3), C1QB(1), C1QC(1), C1R(1), C1S(1), C2(2), C3(8), C3AR1(1), C5(1), C5AR1(1), C6(3), C7(6), C8A(3), C8B(5), C9(1), CD55(2), CFB(1), CFH(3), CFI(1), CPB2(1), CR1(5), CR2(6), F10(1), F13A1(5), F13B(2), F2(1), F5(9), F7(1), F8(8), F9(4), FGA(3), FGB(1), FGG(4), KLKB1(1), KNG1(4), MASP1(2), MBL2(1), PLAU(2), PLAUR(1), PLG(2), PROC(2), SERPINA1(3), SERPINA5(1), SERPINC1(2), SERPIND1(1), SERPINE1(1), SERPINF2(1), SERPING1(5), THBD(3), VWF(10) | 35749445 | 144 | 75 | 141 | 68 | 48 | 23 | 33 | 19 | 20 | 1 | 0.0021 | 0.18 |
| 8 | CTLPATHWAY | Cytotoxic T lymphocytes induce apoptosis in infected cells presenting antigen-MHC-I complexes via the perforin and Fas/Fas ligand pathways. | B2M, CD3D, CD3E, CD3G, CD3Z, GZMB, HLA-A, ICAM1, ITGAL, ITGB2, PRF1, TNFRSF6, TNFSF6, TRA@, TRB@ | 10 | B2M(2), CD3E(1), CD3G(1), GZMB(3), HLA-A(1), ITGAL(4), ITGB2(5), PRF1(3) | 3417489 | 20 | 15 | 20 | 14 | 6 | 1 | 4 | 1 | 8 | 0 | 0.0047 | 0.35 |
| 9 | BLOOD_CLOTTING_CASCADE | F10, F11, F12, F13B, F2, F5, F7, F8, F8A1, F9, FGA, FGB, FGG, LPA, PLG, PLAT, PLAU, PLG, SERPINB2, SERPINE1, SERPINF2, VWF | 20 | F10(1), F13B(2), F2(1), F5(9), F7(1), F8(8), F9(4), FGA(3), FGB(1), FGG(4), LPA(6), PLAU(2), PLG(2), SERPINB2(2), SERPINE1(1), SERPINF2(1), VWF(10) | 14027949 | 58 | 43 | 58 | 22 | 21 | 10 | 11 | 5 | 11 | 0 | 0.0052 | 0.35 | |
| 10 | HSA00980_METABOLISM_OF_XENOBIOTICS_BY_CYTOCHROME_P450 | Genes involved in metabolism of xenobiotics by cytochrome P450 | ADH1A, ADH1B, ADH1C, ADH4, ADH5, ADH6, ADH7, ADHFE1, AKR1C1, AKR1C2, AKR1C3, AKR1C4, ALDH1A3, ALDH3A1, ALDH3B1, ALDH3B2, CYP1A1, CYP1A2, CYP1B1, CYP2B6, CYP2C18, CYP2C19, CYP2C8, CYP2C9, CYP2E1, CYP2F1, CYP2S1, CYP3A4, CYP3A43, CYP3A5, CYP3A7, DHDH, EPHX1, GSTA1, GSTA2, GSTA3, GSTA4, GSTA5, GSTK1, GSTM1, GSTM2, GSTM3, GSTM4, GSTM5, GSTO2, GSTP1, GSTT1, GSTT2, GSTZ1, MGST1, MGST2, MGST3, UGT1A1, UGT1A10, UGT1A3, UGT1A4, UGT1A5, UGT1A6, UGT1A7, UGT1A8, UGT1A9, UGT2A1, UGT2A3, UGT2B10, UGT2B11, UGT2B15, UGT2B17, UGT2B28, UGT2B4, UGT2B7 | 68 | ADH1A(4), ADH1B(3), ADH1C(3), ADH6(2), ADH7(1), AKR1C1(3), AKR1C4(2), ALDH1A3(1), ALDH3A1(3), ALDH3B1(2), ALDH3B2(1), CYP1A1(1), CYP1B1(4), CYP2B6(2), CYP2C18(1), CYP2C8(2), CYP2C9(2), CYP2E1(4), CYP2S1(1), CYP3A4(3), CYP3A43(2), CYP3A7(3), DHDH(1), GSTA1(2), GSTA4(2), GSTA5(1), GSTK1(2), GSTM1(1), GSTM3(1), GSTP1(1), GSTT1(1), MGST1(1), MGST3(1), UGT1A1(1), UGT1A10(1), UGT1A3(1), UGT1A5(2), UGT1A6(2), UGT1A9(1), UGT2A1(5), UGT2A3(3), UGT2B10(1), UGT2B11(3), UGT2B17(1), UGT2B28(5), UGT2B4(5), UGT2B7(3) | 21984496 | 98 | 57 | 97 | 32 | 38 | 8 | 24 | 25 | 3 | 0 | 0.0063 | 0.37 |
In brief, we tabulate the number of mutations and the number of covered bases for each gene. The counts are broken down by mutation context category: four context categories that are discovered by MutSig, and one for indel and 'null' mutations, which include indels, nonsense mutations, splice-site mutations, and non-stop (read-through) mutations. For each gene, we calculate the probability of seeing the observed constellation of mutations, i.e. the product P1 x P2 x ... x Pm, or a more extreme one, given the background mutation rates calculated across the dataset. [1]
This is an experimental feature. The full results of the analysis summarized in this report can be downloaded from the TCGA Data Coordination Center.