This pipeline computes the correlation between cancer subtypes identified by different molecular patterns and selected clinical features.
Testing the association between subtypes identified by 5 different clustering approaches and 8 clinical features across 290 patients, 5 significant findings detected with P value < 0.05.
-
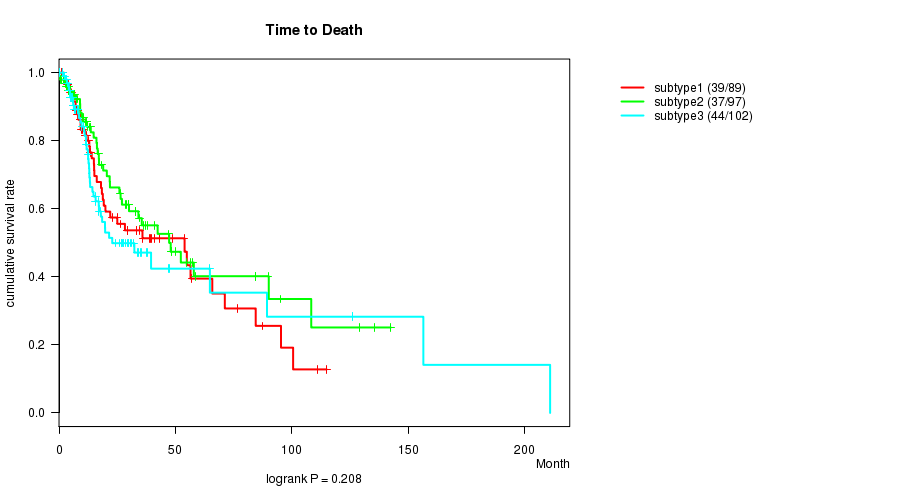
3 subtypes identified in current cancer cohort by 'METHLYATION CNMF'. These subtypes correlate to 'AGE', 'GENDER', and 'PATHOLOGY.T'.
-
CNMF clustering analysis on sequencing-based mRNA expression data identified 3 subtypes that do not correlate to any clinical features.
-
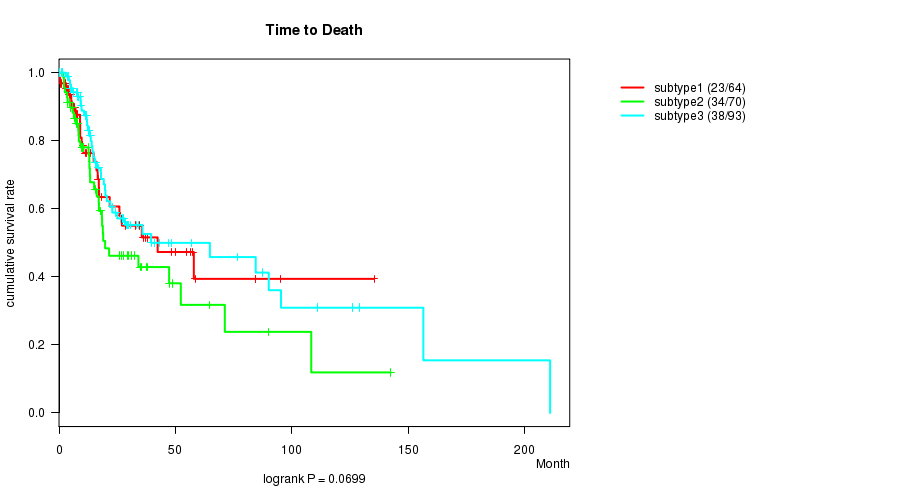
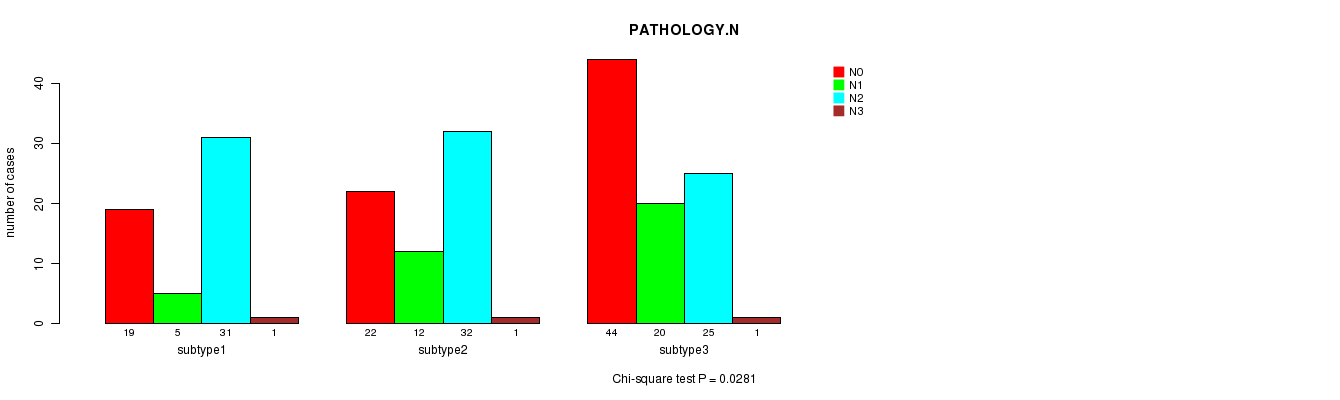
Consensus hierarchical clustering analysis on sequencing-based mRNA expression data identified 3 subtypes that correlate to 'PATHOLOGY.N'.
-
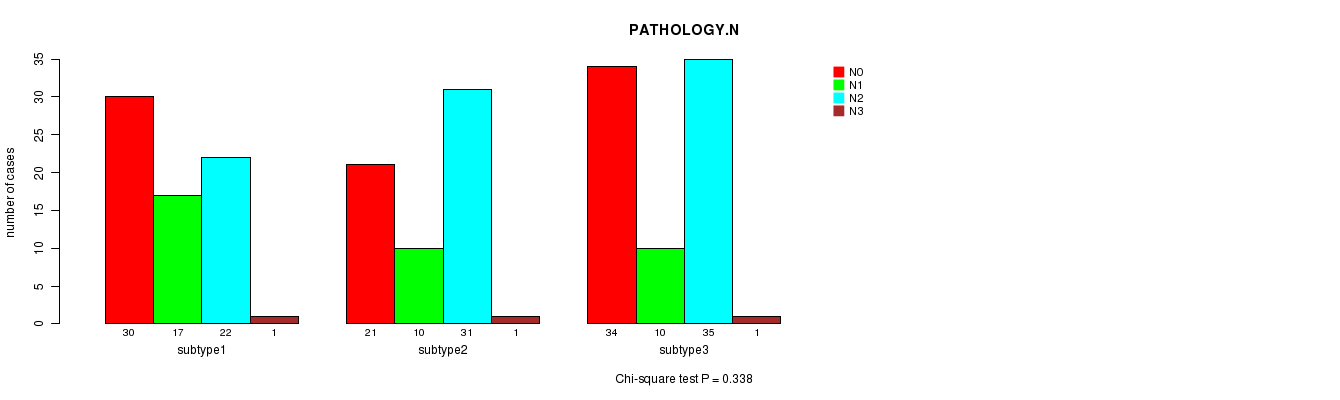
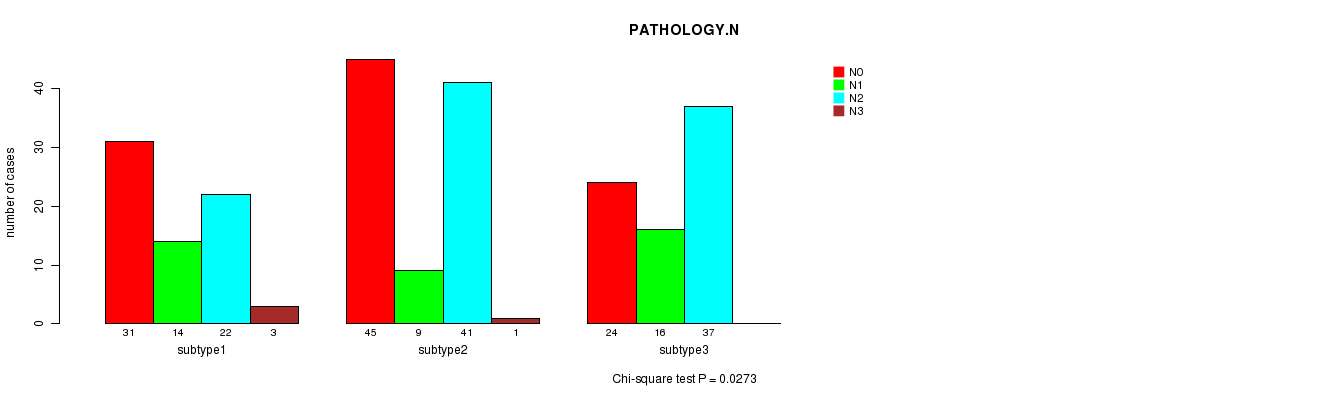
CNMF clustering analysis on sequencing-based miR expression data identified 3 subtypes that correlate to 'PATHOLOGY.N'.
-
Consensus hierarchical clustering analysis on sequencing-based miR expression data identified 3 subtypes that do not correlate to any clinical features.
Table 1. Get Full Table Overview of the association between subtypes identified by 5 different clustering approaches and 8 clinical features. Shown in the table are P values from statistical tests. Thresholded by P value < 0.05, 5 significant findings detected.
|
Clinical Features |
Statistical Tests |
METHLYATION CNMF |
RNAseq CNMF subtypes |
RNAseq cHierClus subtypes |
MIRseq CNMF subtypes |
MIRseq cHierClus subtypes |
| Time to Death | logrank test | 0.208 | 0.201 | 0.0699 | 0.344 | 0.222 |
| AGE | ANOVA | 0.0437 | 0.579 | 0.355 | 0.613 | 0.695 |
| GENDER | Fisher's exact test | 0.0065 | 0.711 | 0.133 | 0.325 | 0.746 |
| PATHOLOGY T | Chi-square test | 0.0162 | 0.64 | 0.141 | 0.168 | 0.142 |
| PATHOLOGY N | Chi-square test | 0.331 | 0.338 | 0.0281 | 0.0273 | 0.541 |
| PATHOLOGICSPREAD(M) | Fisher's exact test | 0.777 | 1 | 0.747 | 0.634 | 0.379 |
| RADIATIONS RADIATION REGIMENINDICATION | Fisher's exact test | 0.944 | 0.719 | 0.895 | 0.698 | 0.798 |
| NEOADJUVANT THERAPY | Fisher's exact test | 0.721 | 0.624 | 0.408 | 0.583 | 0.494 |
Table S1. Get Full Table Description of clustering approach #1: 'METHLYATION CNMF'
| Cluster Labels | 1 | 2 | 3 |
|---|---|---|---|
| Number of samples | 90 | 97 | 103 |
P value = 0.208 (logrank test)
Table S2. Clustering Approach #1: 'METHLYATION CNMF' versus Clinical Feature #1: 'Time to Death'
| nPatients | nDeath | Duration Range (Median), Month | |
|---|---|---|---|
| ALL | 288 | 120 | 0.1 - 210.9 (13.8) |
| subtype1 | 89 | 39 | 1.0 - 114.9 (13.6) |
| subtype2 | 97 | 37 | 0.1 - 142.5 (16.6) |
| subtype3 | 102 | 44 | 0.1 - 210.9 (13.0) |
Figure S1. Get High-res Image Clustering Approach #1: 'METHLYATION CNMF' versus Clinical Feature #1: 'Time to Death'
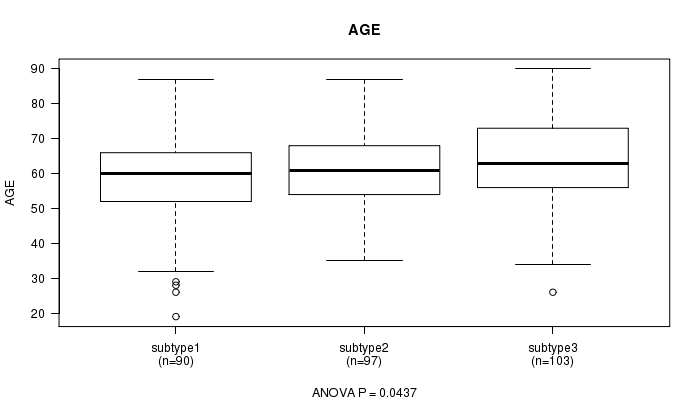
P value = 0.0437 (ANOVA)
Table S3. Clustering Approach #1: 'METHLYATION CNMF' versus Clinical Feature #2: 'AGE'
| nPatients | Mean (Std.Dev) | |
|---|---|---|
| ALL | 290 | 61.4 (12.2) |
| subtype1 | 90 | 58.8 (12.7) |
| subtype2 | 97 | 61.9 (10.9) |
| subtype3 | 103 | 63.1 (12.6) |
Figure S2. Get High-res Image Clustering Approach #1: 'METHLYATION CNMF' versus Clinical Feature #2: 'AGE'
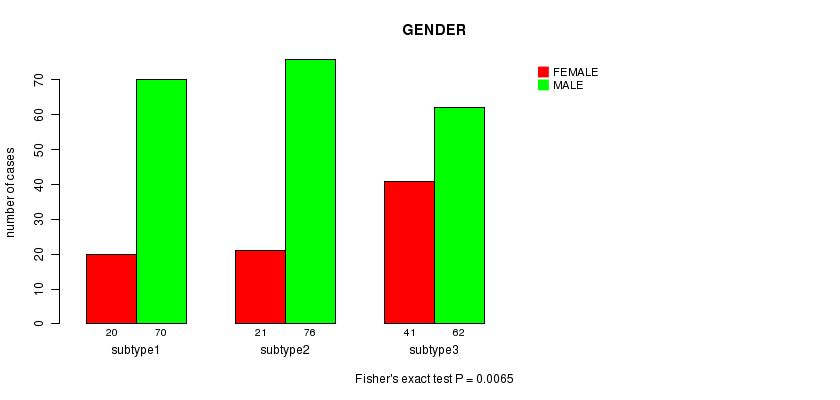
P value = 0.0065 (Fisher's exact test)
Table S4. Clustering Approach #1: 'METHLYATION CNMF' versus Clinical Feature #3: 'GENDER'
| nPatients | FEMALE | MALE |
|---|---|---|
| ALL | 208 | 82 |
| subtype1 | 70 | 20 |
| subtype2 | 76 | 21 |
| subtype3 | 62 | 41 |
Figure S3. Get High-res Image Clustering Approach #1: 'METHLYATION CNMF' versus Clinical Feature #3: 'GENDER'
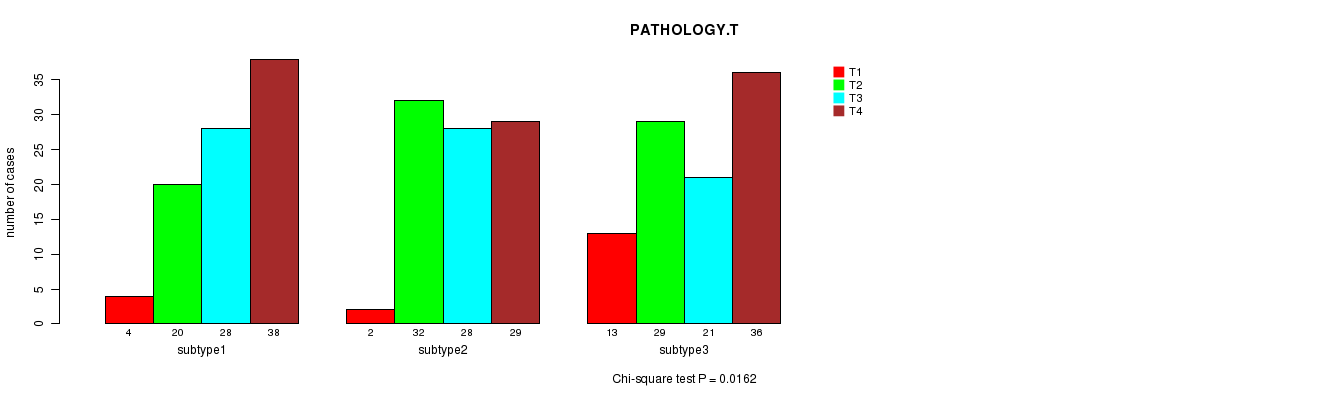
P value = 0.0162 (Chi-square test)
Table S5. Clustering Approach #1: 'METHLYATION CNMF' versus Clinical Feature #4: 'PATHOLOGY.T'
| nPatients | T1 | T2 | T3 | T4 |
|---|---|---|---|---|
| ALL | 19 | 81 | 77 | 103 |
| subtype1 | 4 | 20 | 28 | 38 |
| subtype2 | 2 | 32 | 28 | 29 |
| subtype3 | 13 | 29 | 21 | 36 |
Figure S4. Get High-res Image Clustering Approach #1: 'METHLYATION CNMF' versus Clinical Feature #4: 'PATHOLOGY.T'
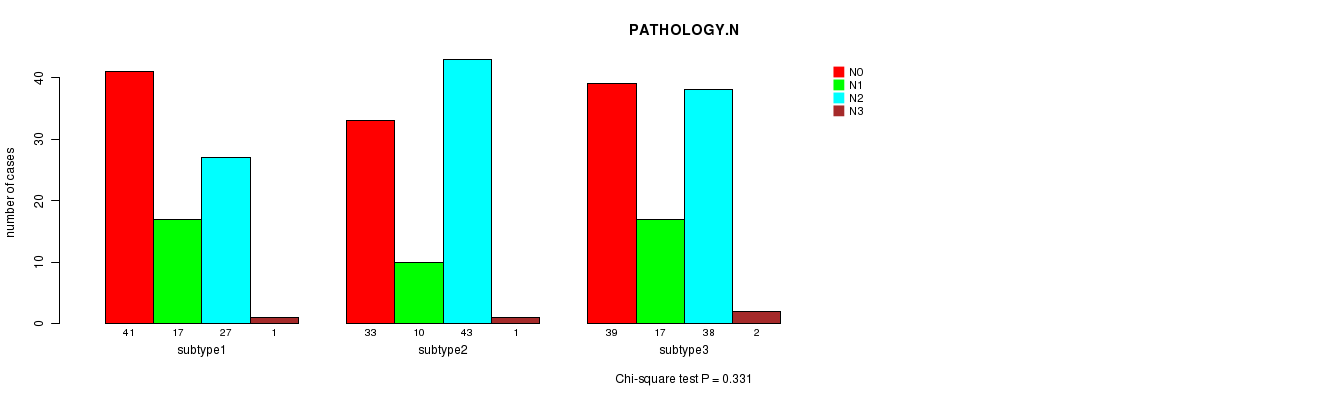
P value = 0.331 (Chi-square test)
Table S6. Clustering Approach #1: 'METHLYATION CNMF' versus Clinical Feature #5: 'PATHOLOGY.N'
| nPatients | N0 | N1 | N2 | N3 |
|---|---|---|---|---|
| ALL | 113 | 44 | 108 | 4 |
| subtype1 | 41 | 17 | 27 | 1 |
| subtype2 | 33 | 10 | 43 | 1 |
| subtype3 | 39 | 17 | 38 | 2 |
Figure S5. Get High-res Image Clustering Approach #1: 'METHLYATION CNMF' versus Clinical Feature #5: 'PATHOLOGY.N'
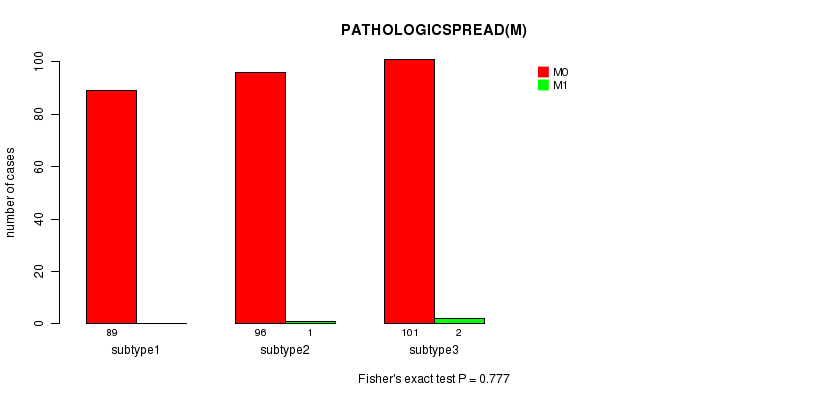
P value = 0.777 (Fisher's exact test)
Table S7. Clustering Approach #1: 'METHLYATION CNMF' versus Clinical Feature #6: 'PATHOLOGICSPREAD(M)'
| nPatients | M0 | M1 |
|---|---|---|
| ALL | 286 | 3 |
| subtype1 | 89 | 0 |
| subtype2 | 96 | 1 |
| subtype3 | 101 | 2 |
Figure S6. Get High-res Image Clustering Approach #1: 'METHLYATION CNMF' versus Clinical Feature #6: 'PATHOLOGICSPREAD(M)'
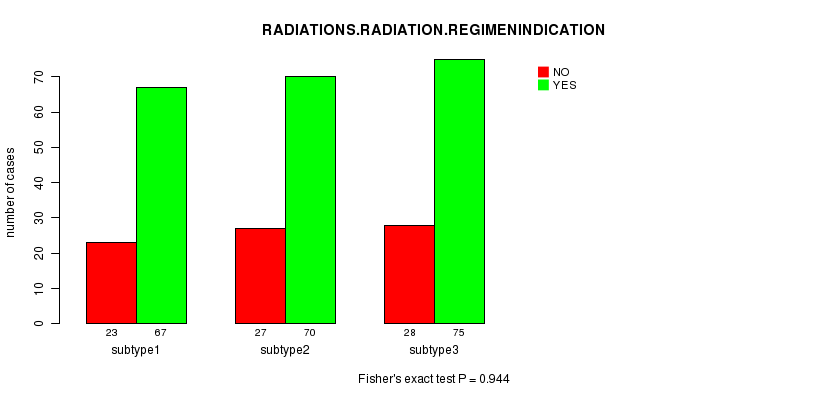
P value = 0.944 (Fisher's exact test)
Table S8. Clustering Approach #1: 'METHLYATION CNMF' versus Clinical Feature #7: 'RADIATIONS.RADIATION.REGIMENINDICATION'
| nPatients | NO | YES |
|---|---|---|
| ALL | 212 | 78 |
| subtype1 | 67 | 23 |
| subtype2 | 70 | 27 |
| subtype3 | 75 | 28 |
Figure S7. Get High-res Image Clustering Approach #1: 'METHLYATION CNMF' versus Clinical Feature #7: 'RADIATIONS.RADIATION.REGIMENINDICATION'
P value = 0.721 (Fisher's exact test)
Table S9. Clustering Approach #1: 'METHLYATION CNMF' versus Clinical Feature #8: 'NEOADJUVANT.THERAPY'
| nPatients | NO | YES |
|---|---|---|
| ALL | 48 | 242 |
| subtype1 | 15 | 75 |
| subtype2 | 18 | 79 |
| subtype3 | 15 | 88 |
Figure S8. Get High-res Image Clustering Approach #1: 'METHLYATION CNMF' versus Clinical Feature #8: 'NEOADJUVANT.THERAPY'
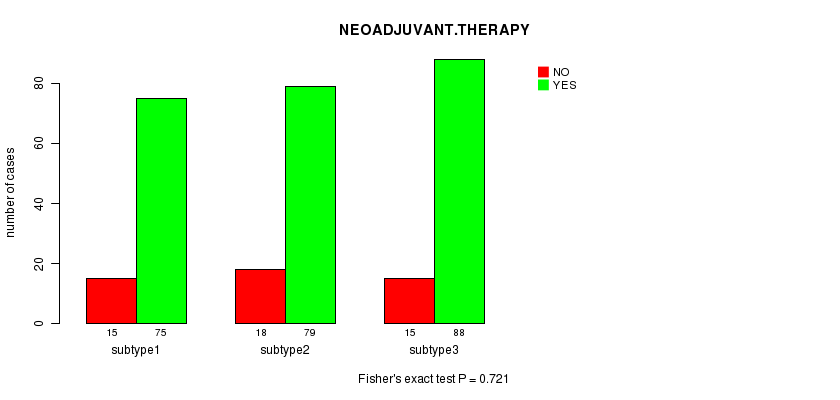
Table S10. Get Full Table Description of clustering approach #2: 'RNAseq CNMF subtypes'
| Cluster Labels | 1 | 2 | 3 |
|---|---|---|---|
| Number of samples | 73 | 65 | 90 |
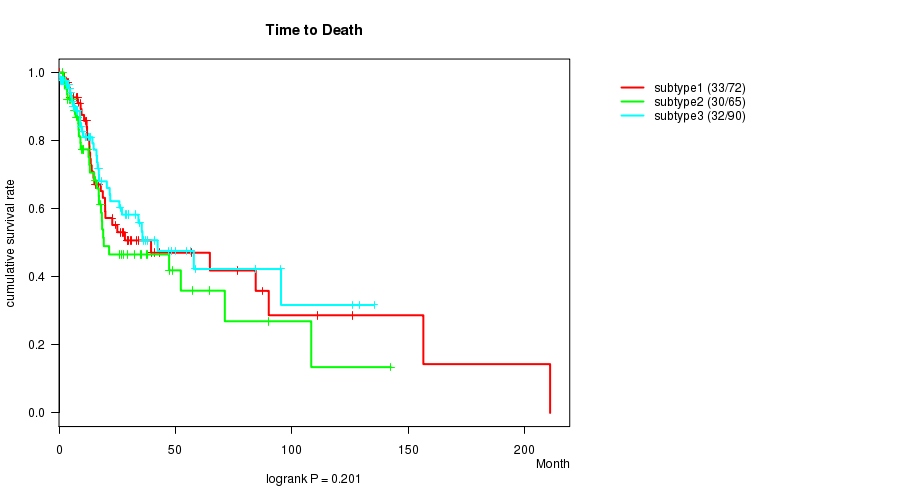
P value = 0.201 (logrank test)
Table S11. Clustering Approach #2: 'RNAseq CNMF subtypes' versus Clinical Feature #1: 'Time to Death'
| nPatients | nDeath | Duration Range (Median), Month | |
|---|---|---|---|
| ALL | 227 | 95 | 0.1 - 210.9 (14.0) |
| subtype1 | 72 | 33 | 0.1 - 210.9 (15.5) |
| subtype2 | 65 | 30 | 1.5 - 142.5 (13.0) |
| subtype3 | 90 | 32 | 0.1 - 135.3 (13.4) |
Figure S9. Get High-res Image Clustering Approach #2: 'RNAseq CNMF subtypes' versus Clinical Feature #1: 'Time to Death'
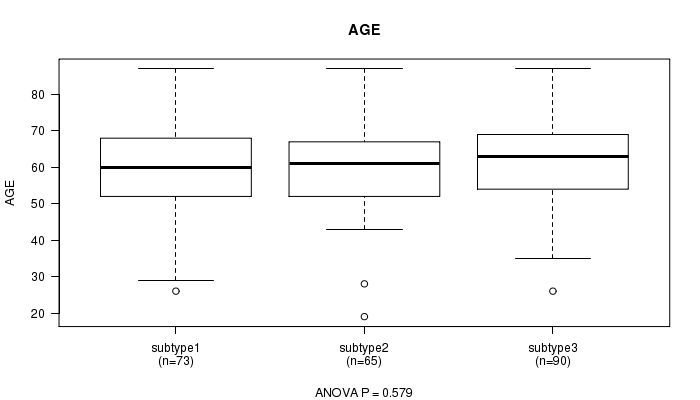
P value = 0.579 (ANOVA)
Table S12. Clustering Approach #2: 'RNAseq CNMF subtypes' versus Clinical Feature #2: 'AGE'
| nPatients | Mean (Std.Dev) | |
|---|---|---|
| ALL | 228 | 61.2 (12.3) |
| subtype1 | 73 | 60.3 (13.2) |
| subtype2 | 65 | 60.8 (12.5) |
| subtype3 | 90 | 62.2 (11.5) |
Figure S10. Get High-res Image Clustering Approach #2: 'RNAseq CNMF subtypes' versus Clinical Feature #2: 'AGE'
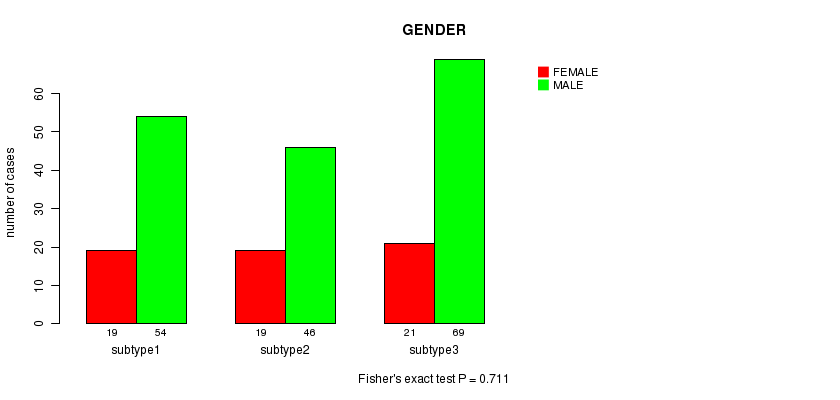
P value = 0.711 (Fisher's exact test)
Table S13. Clustering Approach #2: 'RNAseq CNMF subtypes' versus Clinical Feature #3: 'GENDER'
| nPatients | FEMALE | MALE |
|---|---|---|
| ALL | 169 | 59 |
| subtype1 | 54 | 19 |
| subtype2 | 46 | 19 |
| subtype3 | 69 | 21 |
Figure S11. Get High-res Image Clustering Approach #2: 'RNAseq CNMF subtypes' versus Clinical Feature #3: 'GENDER'
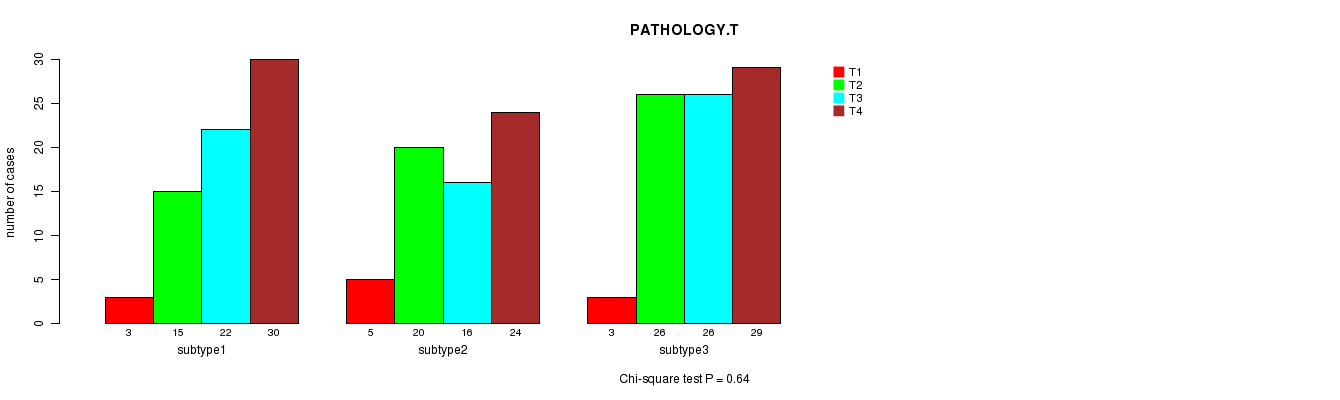
P value = 0.64 (Chi-square test)
Table S14. Clustering Approach #2: 'RNAseq CNMF subtypes' versus Clinical Feature #4: 'PATHOLOGY.T'
| nPatients | T1 | T2 | T3 | T4 |
|---|---|---|---|---|
| ALL | 11 | 61 | 64 | 83 |
| subtype1 | 3 | 15 | 22 | 30 |
| subtype2 | 5 | 20 | 16 | 24 |
| subtype3 | 3 | 26 | 26 | 29 |
Figure S12. Get High-res Image Clustering Approach #2: 'RNAseq CNMF subtypes' versus Clinical Feature #4: 'PATHOLOGY.T'
P value = 0.338 (Chi-square test)
Table S15. Clustering Approach #2: 'RNAseq CNMF subtypes' versus Clinical Feature #5: 'PATHOLOGY.N'
| nPatients | N0 | N1 | N2 | N3 |
|---|---|---|---|---|
| ALL | 85 | 37 | 88 | 3 |
| subtype1 | 30 | 17 | 22 | 1 |
| subtype2 | 21 | 10 | 31 | 1 |
| subtype3 | 34 | 10 | 35 | 1 |
Figure S13. Get High-res Image Clustering Approach #2: 'RNAseq CNMF subtypes' versus Clinical Feature #5: 'PATHOLOGY.N'
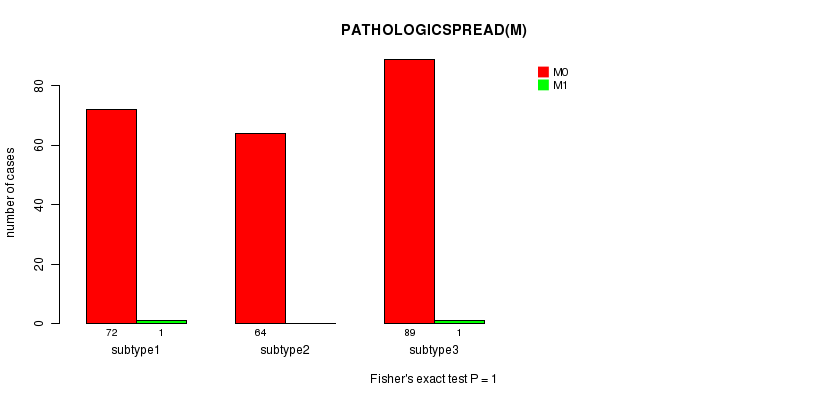
P value = 1 (Fisher's exact test)
Table S16. Clustering Approach #2: 'RNAseq CNMF subtypes' versus Clinical Feature #6: 'PATHOLOGICSPREAD(M)'
| nPatients | M0 | M1 |
|---|---|---|
| ALL | 225 | 2 |
| subtype1 | 72 | 1 |
| subtype2 | 64 | 0 |
| subtype3 | 89 | 1 |
Figure S14. Get High-res Image Clustering Approach #2: 'RNAseq CNMF subtypes' versus Clinical Feature #6: 'PATHOLOGICSPREAD(M)'
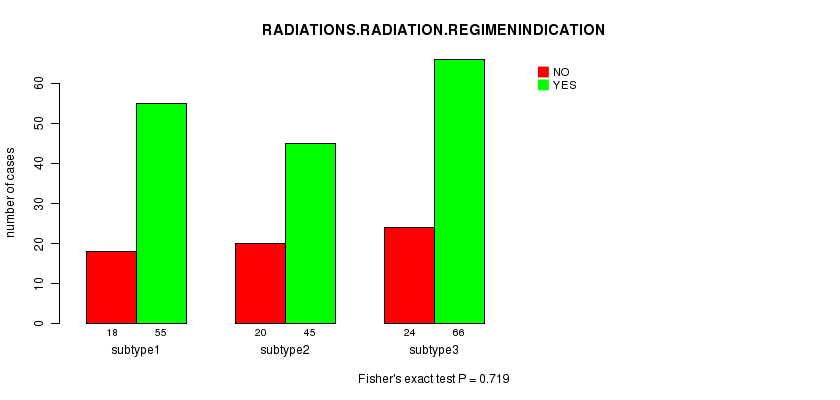
P value = 0.719 (Fisher's exact test)
Table S17. Clustering Approach #2: 'RNAseq CNMF subtypes' versus Clinical Feature #7: 'RADIATIONS.RADIATION.REGIMENINDICATION'
| nPatients | NO | YES |
|---|---|---|
| ALL | 166 | 62 |
| subtype1 | 55 | 18 |
| subtype2 | 45 | 20 |
| subtype3 | 66 | 24 |
Figure S15. Get High-res Image Clustering Approach #2: 'RNAseq CNMF subtypes' versus Clinical Feature #7: 'RADIATIONS.RADIATION.REGIMENINDICATION'
P value = 0.624 (Fisher's exact test)
Table S18. Clustering Approach #2: 'RNAseq CNMF subtypes' versus Clinical Feature #8: 'NEOADJUVANT.THERAPY'
| nPatients | NO | YES |
|---|---|---|
| ALL | 38 | 190 |
| subtype1 | 10 | 63 |
| subtype2 | 13 | 52 |
| subtype3 | 15 | 75 |
Figure S16. Get High-res Image Clustering Approach #2: 'RNAseq CNMF subtypes' versus Clinical Feature #8: 'NEOADJUVANT.THERAPY'
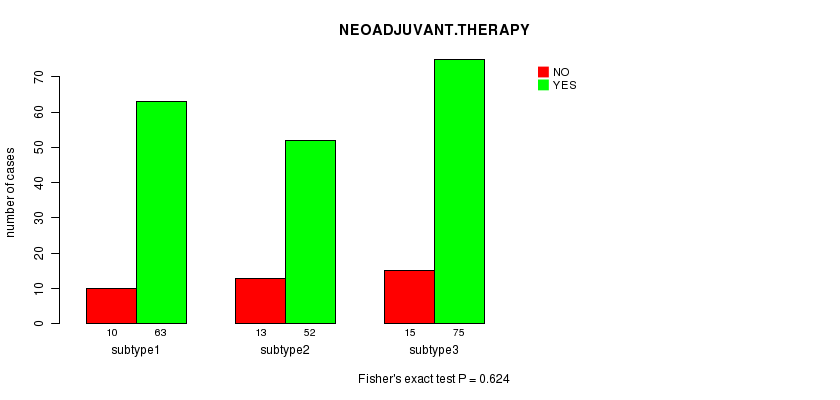
Table S19. Get Full Table Description of clustering approach #3: 'RNAseq cHierClus subtypes'
| Cluster Labels | 1 | 2 | 3 |
|---|---|---|---|
| Number of samples | 64 | 70 | 94 |
P value = 0.0699 (logrank test)
Table S20. Clustering Approach #3: 'RNAseq cHierClus subtypes' versus Clinical Feature #1: 'Time to Death'
| nPatients | nDeath | Duration Range (Median), Month | |
|---|---|---|---|
| ALL | 227 | 95 | 0.1 - 210.9 (14.0) |
| subtype1 | 64 | 23 | 0.1 - 135.3 (11.6) |
| subtype2 | 70 | 34 | 1.5 - 142.5 (13.2) |
| subtype3 | 93 | 38 | 0.1 - 210.9 (15.8) |
Figure S17. Get High-res Image Clustering Approach #3: 'RNAseq cHierClus subtypes' versus Clinical Feature #1: 'Time to Death'
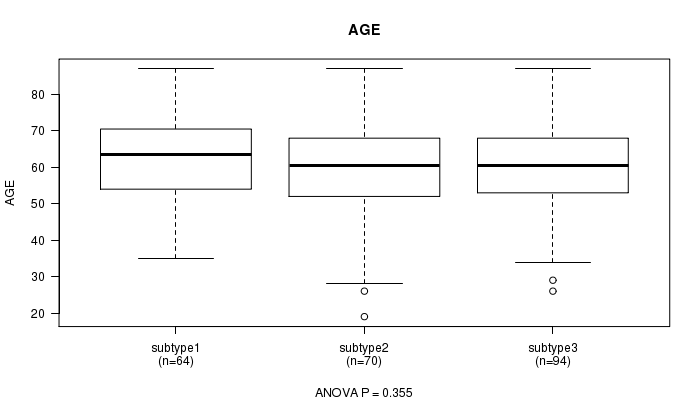
P value = 0.355 (ANOVA)
Table S21. Clustering Approach #3: 'RNAseq cHierClus subtypes' versus Clinical Feature #2: 'AGE'
| nPatients | Mean (Std.Dev) | |
|---|---|---|
| ALL | 228 | 61.2 (12.3) |
| subtype1 | 64 | 63.1 (11.2) |
| subtype2 | 70 | 60.5 (13.6) |
| subtype3 | 94 | 60.4 (12.0) |
Figure S18. Get High-res Image Clustering Approach #3: 'RNAseq cHierClus subtypes' versus Clinical Feature #2: 'AGE'
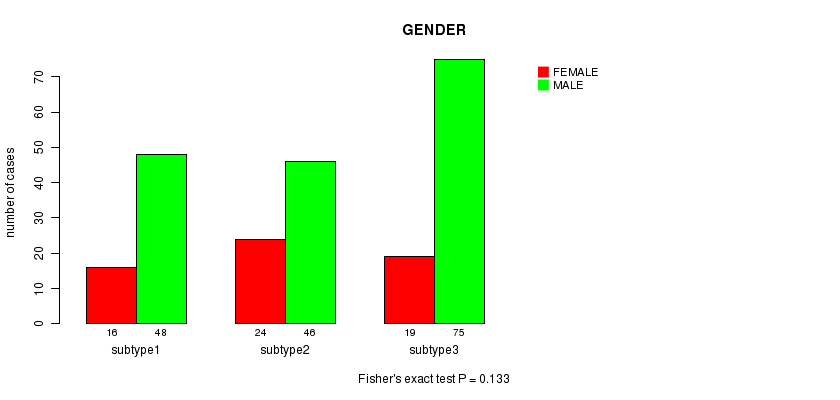
P value = 0.133 (Fisher's exact test)
Table S22. Clustering Approach #3: 'RNAseq cHierClus subtypes' versus Clinical Feature #3: 'GENDER'
| nPatients | FEMALE | MALE |
|---|---|---|
| ALL | 169 | 59 |
| subtype1 | 48 | 16 |
| subtype2 | 46 | 24 |
| subtype3 | 75 | 19 |
Figure S19. Get High-res Image Clustering Approach #3: 'RNAseq cHierClus subtypes' versus Clinical Feature #3: 'GENDER'
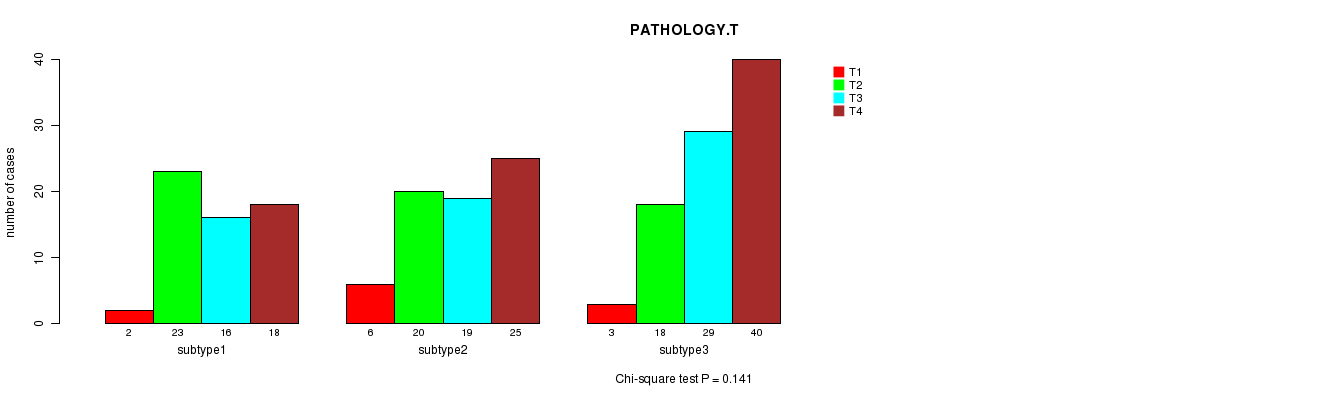
P value = 0.141 (Chi-square test)
Table S23. Clustering Approach #3: 'RNAseq cHierClus subtypes' versus Clinical Feature #4: 'PATHOLOGY.T'
| nPatients | T1 | T2 | T3 | T4 |
|---|---|---|---|---|
| ALL | 11 | 61 | 64 | 83 |
| subtype1 | 2 | 23 | 16 | 18 |
| subtype2 | 6 | 20 | 19 | 25 |
| subtype3 | 3 | 18 | 29 | 40 |
Figure S20. Get High-res Image Clustering Approach #3: 'RNAseq cHierClus subtypes' versus Clinical Feature #4: 'PATHOLOGY.T'
P value = 0.0281 (Chi-square test)
Table S24. Clustering Approach #3: 'RNAseq cHierClus subtypes' versus Clinical Feature #5: 'PATHOLOGY.N'
| nPatients | N0 | N1 | N2 | N3 |
|---|---|---|---|---|
| ALL | 85 | 37 | 88 | 3 |
| subtype1 | 19 | 5 | 31 | 1 |
| subtype2 | 22 | 12 | 32 | 1 |
| subtype3 | 44 | 20 | 25 | 1 |
Figure S21. Get High-res Image Clustering Approach #3: 'RNAseq cHierClus subtypes' versus Clinical Feature #5: 'PATHOLOGY.N'
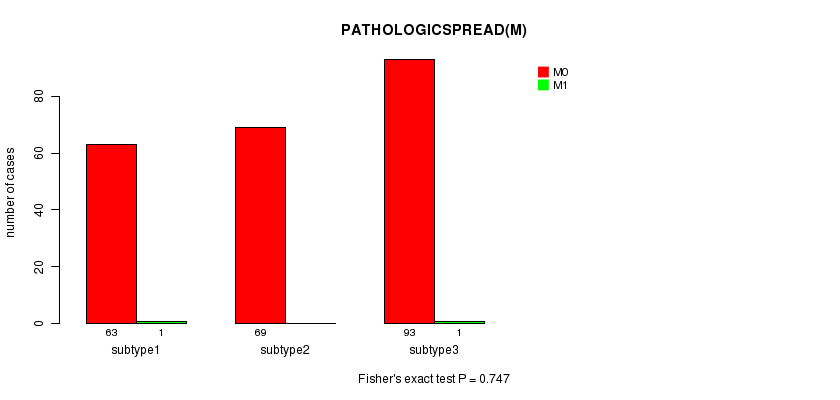
P value = 0.747 (Fisher's exact test)
Table S25. Clustering Approach #3: 'RNAseq cHierClus subtypes' versus Clinical Feature #6: 'PATHOLOGICSPREAD(M)'
| nPatients | M0 | M1 |
|---|---|---|
| ALL | 225 | 2 |
| subtype1 | 63 | 1 |
| subtype2 | 69 | 0 |
| subtype3 | 93 | 1 |
Figure S22. Get High-res Image Clustering Approach #3: 'RNAseq cHierClus subtypes' versus Clinical Feature #6: 'PATHOLOGICSPREAD(M)'
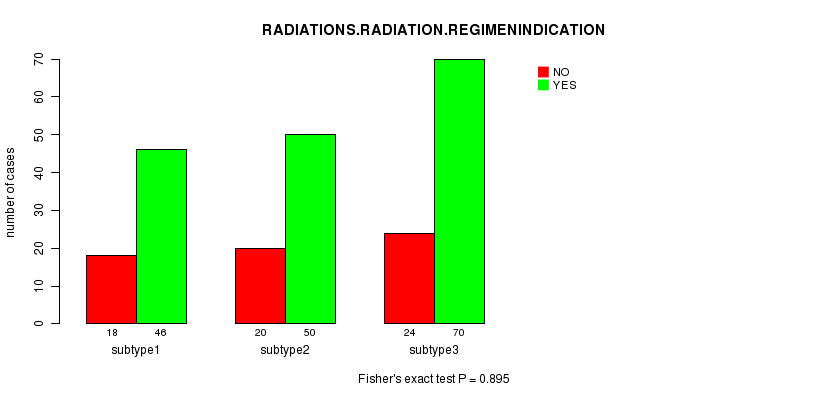
P value = 0.895 (Fisher's exact test)
Table S26. Clustering Approach #3: 'RNAseq cHierClus subtypes' versus Clinical Feature #7: 'RADIATIONS.RADIATION.REGIMENINDICATION'
| nPatients | NO | YES |
|---|---|---|
| ALL | 166 | 62 |
| subtype1 | 46 | 18 |
| subtype2 | 50 | 20 |
| subtype3 | 70 | 24 |
Figure S23. Get High-res Image Clustering Approach #3: 'RNAseq cHierClus subtypes' versus Clinical Feature #7: 'RADIATIONS.RADIATION.REGIMENINDICATION'
P value = 0.408 (Fisher's exact test)
Table S27. Clustering Approach #3: 'RNAseq cHierClus subtypes' versus Clinical Feature #8: 'NEOADJUVANT.THERAPY'
| nPatients | NO | YES |
|---|---|---|
| ALL | 38 | 190 |
| subtype1 | 12 | 52 |
| subtype2 | 14 | 56 |
| subtype3 | 12 | 82 |
Figure S24. Get High-res Image Clustering Approach #3: 'RNAseq cHierClus subtypes' versus Clinical Feature #8: 'NEOADJUVANT.THERAPY'
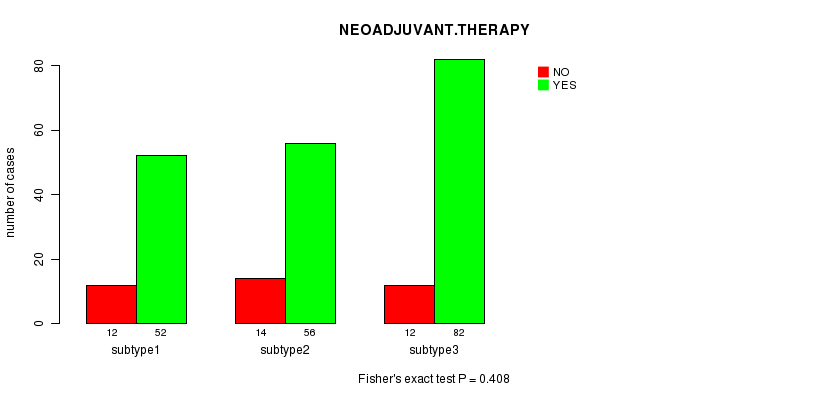
Table S28. Get Full Table Description of clustering approach #4: 'MIRseq CNMF subtypes'
| Cluster Labels | 1 | 2 | 3 |
|---|---|---|---|
| Number of samples | 75 | 102 | 81 |
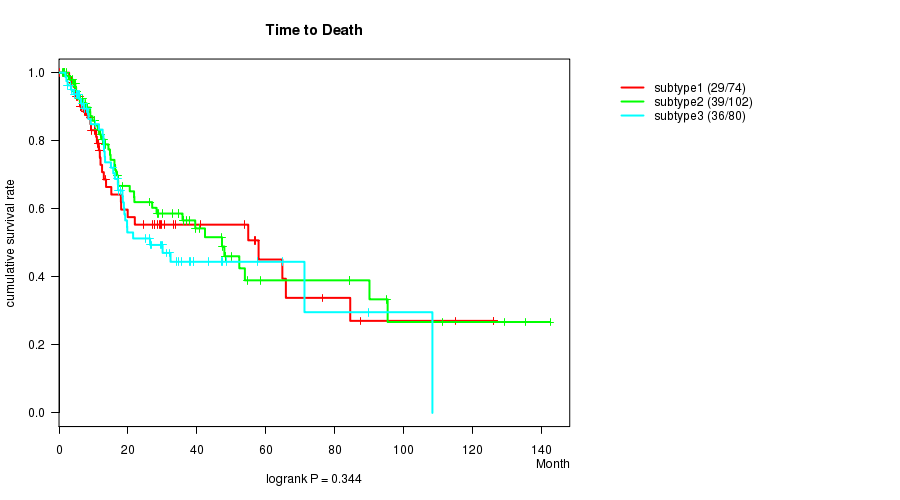
P value = 0.344 (logrank test)
Table S29. Clustering Approach #4: 'MIRseq CNMF subtypes' versus Clinical Feature #1: 'Time to Death'
| nPatients | nDeath | Duration Range (Median), Month | |
|---|---|---|---|
| ALL | 256 | 104 | 0.1 - 142.5 (14.0) |
| subtype1 | 74 | 29 | 0.1 - 126.1 (11.7) |
| subtype2 | 102 | 39 | 1.0 - 142.5 (14.6) |
| subtype3 | 80 | 36 | 1.8 - 108.3 (17.1) |
Figure S25. Get High-res Image Clustering Approach #4: 'MIRseq CNMF subtypes' versus Clinical Feature #1: 'Time to Death'
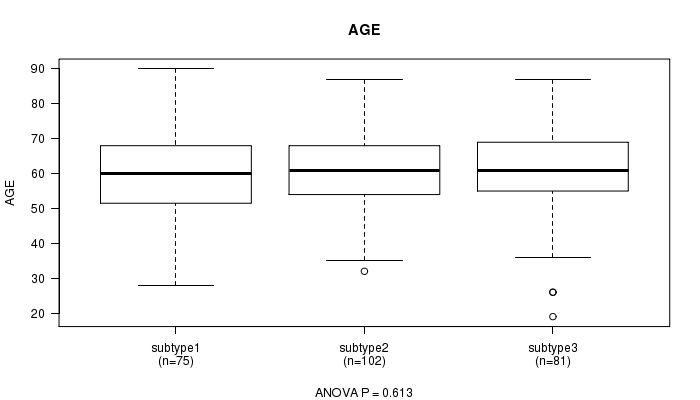
P value = 0.613 (ANOVA)
Table S30. Clustering Approach #4: 'MIRseq CNMF subtypes' versus Clinical Feature #2: 'AGE'
| nPatients | Mean (Std.Dev) | |
|---|---|---|
| ALL | 258 | 61.0 (12.2) |
| subtype1 | 75 | 59.9 (12.9) |
| subtype2 | 102 | 61.7 (11.2) |
| subtype3 | 81 | 61.2 (12.9) |
Figure S26. Get High-res Image Clustering Approach #4: 'MIRseq CNMF subtypes' versus Clinical Feature #2: 'AGE'
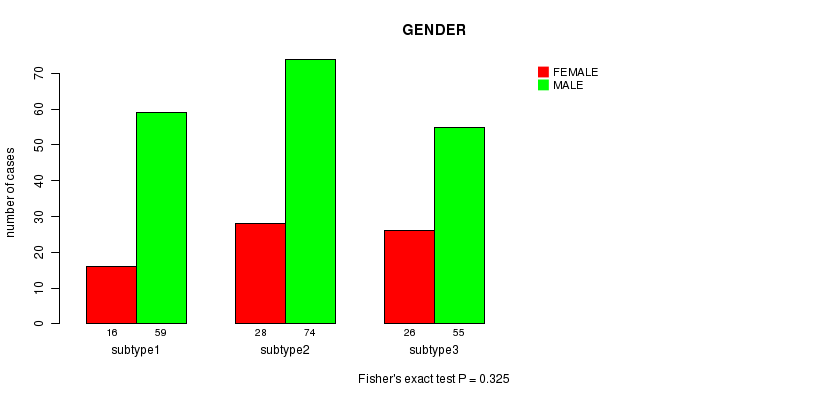
P value = 0.325 (Fisher's exact test)
Table S31. Clustering Approach #4: 'MIRseq CNMF subtypes' versus Clinical Feature #3: 'GENDER'
| nPatients | FEMALE | MALE |
|---|---|---|
| ALL | 188 | 70 |
| subtype1 | 59 | 16 |
| subtype2 | 74 | 28 |
| subtype3 | 55 | 26 |
Figure S27. Get High-res Image Clustering Approach #4: 'MIRseq CNMF subtypes' versus Clinical Feature #3: 'GENDER'
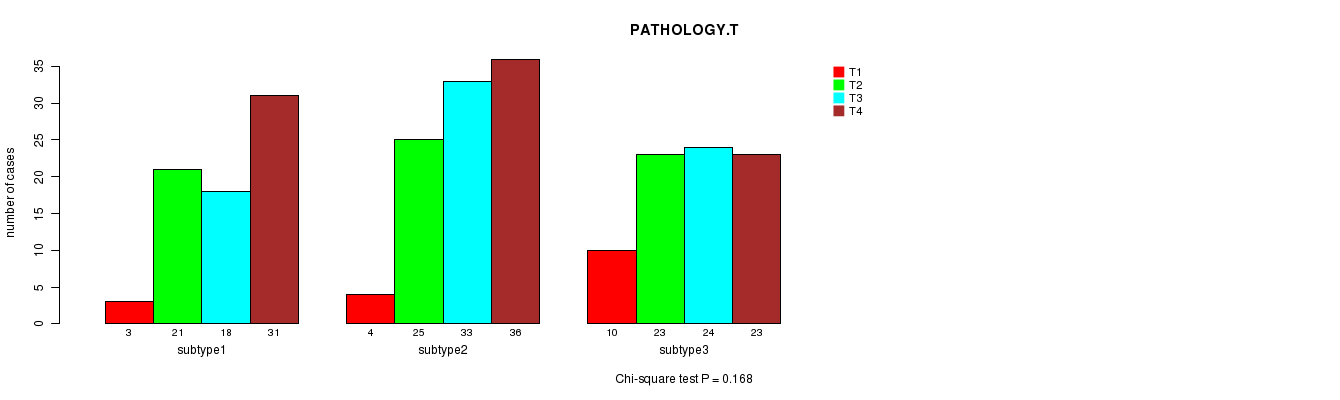
P value = 0.168 (Chi-square test)
Table S32. Clustering Approach #4: 'MIRseq CNMF subtypes' versus Clinical Feature #4: 'PATHOLOGY.T'
| nPatients | T1 | T2 | T3 | T4 |
|---|---|---|---|---|
| ALL | 17 | 69 | 75 | 90 |
| subtype1 | 3 | 21 | 18 | 31 |
| subtype2 | 4 | 25 | 33 | 36 |
| subtype3 | 10 | 23 | 24 | 23 |
Figure S28. Get High-res Image Clustering Approach #4: 'MIRseq CNMF subtypes' versus Clinical Feature #4: 'PATHOLOGY.T'
P value = 0.0273 (Chi-square test)
Table S33. Clustering Approach #4: 'MIRseq CNMF subtypes' versus Clinical Feature #5: 'PATHOLOGY.N'
| nPatients | N0 | N1 | N2 | N3 |
|---|---|---|---|---|
| ALL | 100 | 39 | 100 | 4 |
| subtype1 | 31 | 14 | 22 | 3 |
| subtype2 | 45 | 9 | 41 | 1 |
| subtype3 | 24 | 16 | 37 | 0 |
Figure S29. Get High-res Image Clustering Approach #4: 'MIRseq CNMF subtypes' versus Clinical Feature #5: 'PATHOLOGY.N'
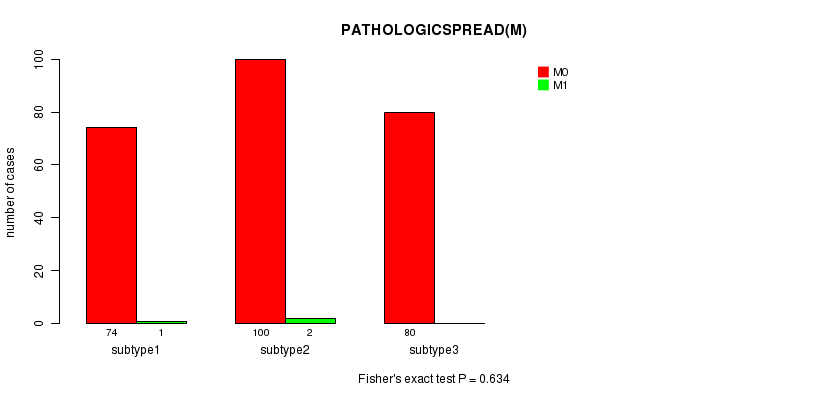
P value = 0.634 (Fisher's exact test)
Table S34. Clustering Approach #4: 'MIRseq CNMF subtypes' versus Clinical Feature #6: 'PATHOLOGICSPREAD(M)'
| nPatients | M0 | M1 |
|---|---|---|
| ALL | 254 | 3 |
| subtype1 | 74 | 1 |
| subtype2 | 100 | 2 |
| subtype3 | 80 | 0 |
Figure S30. Get High-res Image Clustering Approach #4: 'MIRseq CNMF subtypes' versus Clinical Feature #6: 'PATHOLOGICSPREAD(M)'
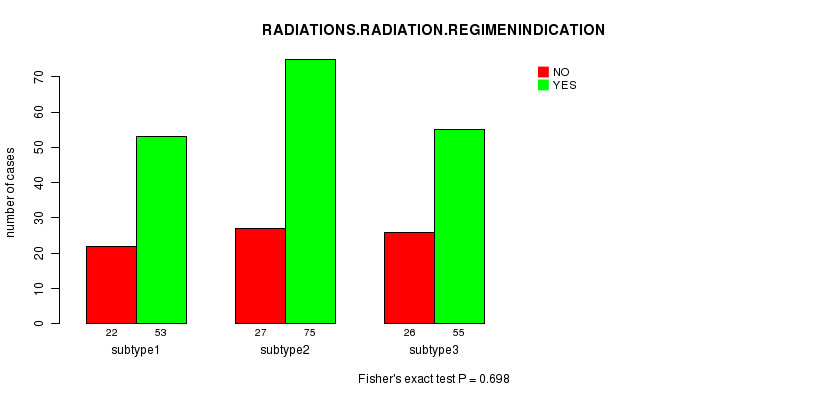
P value = 0.698 (Fisher's exact test)
Table S35. Clustering Approach #4: 'MIRseq CNMF subtypes' versus Clinical Feature #7: 'RADIATIONS.RADIATION.REGIMENINDICATION'
| nPatients | NO | YES |
|---|---|---|
| ALL | 183 | 75 |
| subtype1 | 53 | 22 |
| subtype2 | 75 | 27 |
| subtype3 | 55 | 26 |
Figure S31. Get High-res Image Clustering Approach #4: 'MIRseq CNMF subtypes' versus Clinical Feature #7: 'RADIATIONS.RADIATION.REGIMENINDICATION'
P value = 0.583 (Fisher's exact test)
Table S36. Clustering Approach #4: 'MIRseq CNMF subtypes' versus Clinical Feature #8: 'NEOADJUVANT.THERAPY'
| nPatients | NO | YES |
|---|---|---|
| ALL | 47 | 211 |
| subtype1 | 11 | 64 |
| subtype2 | 19 | 83 |
| subtype3 | 17 | 64 |
Figure S32. Get High-res Image Clustering Approach #4: 'MIRseq CNMF subtypes' versus Clinical Feature #8: 'NEOADJUVANT.THERAPY'
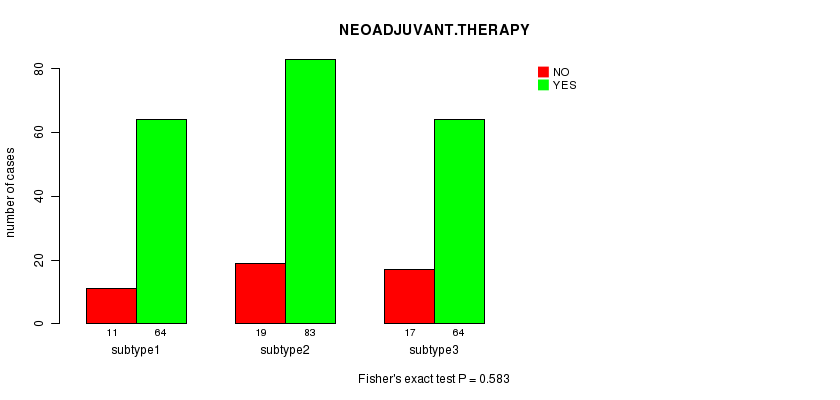
Table S37. Get Full Table Description of clustering approach #5: 'MIRseq cHierClus subtypes'
| Cluster Labels | 1 | 2 | 3 |
|---|---|---|---|
| Number of samples | 13 | 145 | 100 |
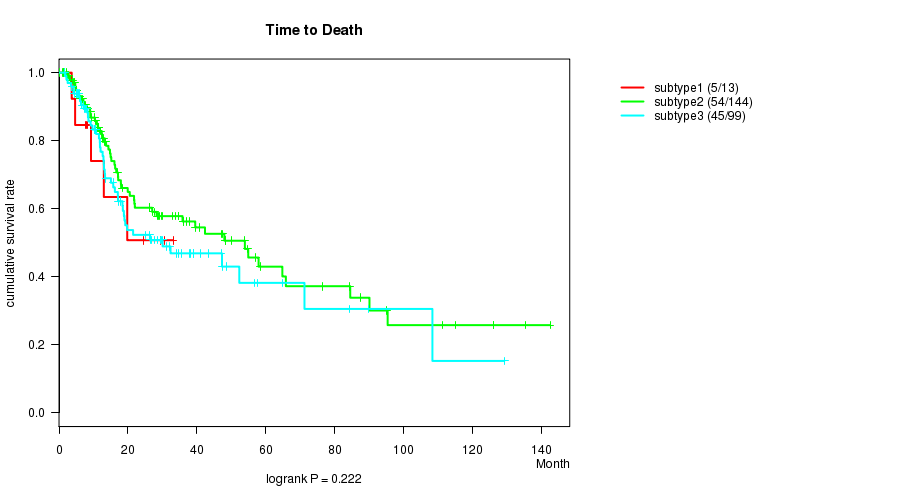
P value = 0.222 (logrank test)
Table S38. Clustering Approach #5: 'MIRseq cHierClus subtypes' versus Clinical Feature #1: 'Time to Death'
| nPatients | nDeath | Duration Range (Median), Month | |
|---|---|---|---|
| ALL | 256 | 104 | 0.1 - 142.5 (14.0) |
| subtype1 | 13 | 5 | 3.7 - 33.1 (13.0) |
| subtype2 | 144 | 54 | 0.1 - 142.5 (13.4) |
| subtype3 | 99 | 45 | 1.5 - 129.2 (15.7) |
Figure S33. Get High-res Image Clustering Approach #5: 'MIRseq cHierClus subtypes' versus Clinical Feature #1: 'Time to Death'
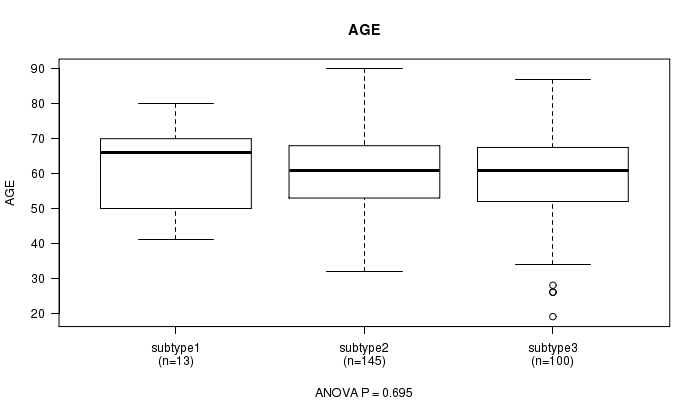
P value = 0.695 (ANOVA)
Table S39. Clustering Approach #5: 'MIRseq cHierClus subtypes' versus Clinical Feature #2: 'AGE'
| nPatients | Mean (Std.Dev) | |
|---|---|---|
| ALL | 258 | 61.0 (12.2) |
| subtype1 | 13 | 62.2 (12.8) |
| subtype2 | 145 | 61.5 (11.4) |
| subtype3 | 100 | 60.2 (13.3) |
Figure S34. Get High-res Image Clustering Approach #5: 'MIRseq cHierClus subtypes' versus Clinical Feature #2: 'AGE'
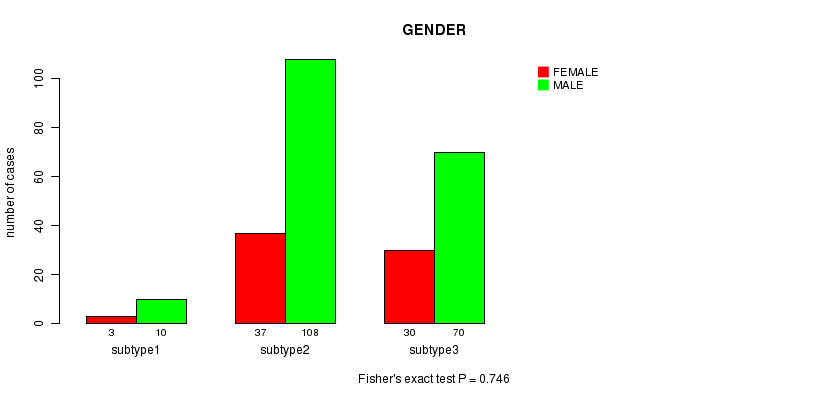
P value = 0.746 (Fisher's exact test)
Table S40. Clustering Approach #5: 'MIRseq cHierClus subtypes' versus Clinical Feature #3: 'GENDER'
| nPatients | FEMALE | MALE |
|---|---|---|
| ALL | 188 | 70 |
| subtype1 | 10 | 3 |
| subtype2 | 108 | 37 |
| subtype3 | 70 | 30 |
Figure S35. Get High-res Image Clustering Approach #5: 'MIRseq cHierClus subtypes' versus Clinical Feature #3: 'GENDER'
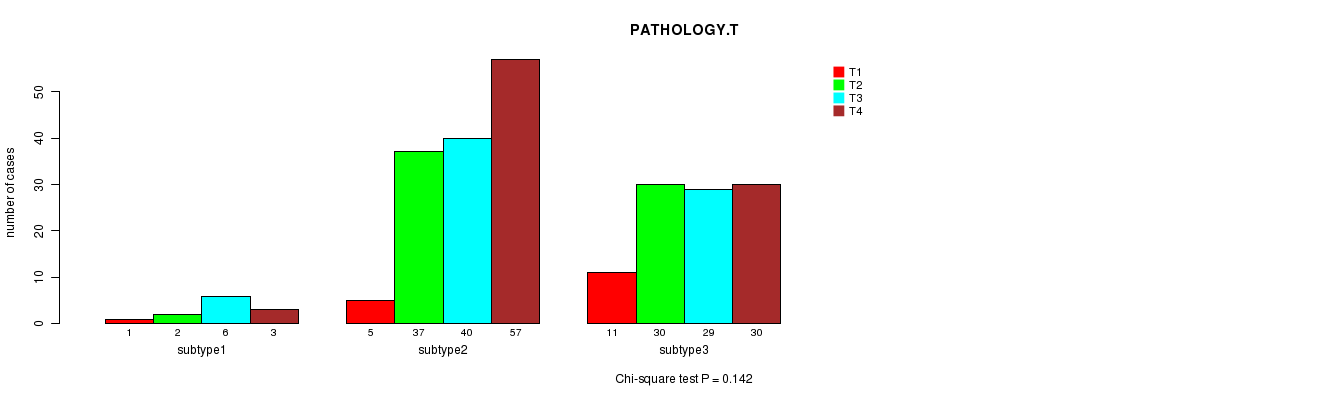
P value = 0.142 (Chi-square test)
Table S41. Clustering Approach #5: 'MIRseq cHierClus subtypes' versus Clinical Feature #4: 'PATHOLOGY.T'
| nPatients | T1 | T2 | T3 | T4 |
|---|---|---|---|---|
| ALL | 17 | 69 | 75 | 90 |
| subtype1 | 1 | 2 | 6 | 3 |
| subtype2 | 5 | 37 | 40 | 57 |
| subtype3 | 11 | 30 | 29 | 30 |
Figure S36. Get High-res Image Clustering Approach #5: 'MIRseq cHierClus subtypes' versus Clinical Feature #4: 'PATHOLOGY.T'
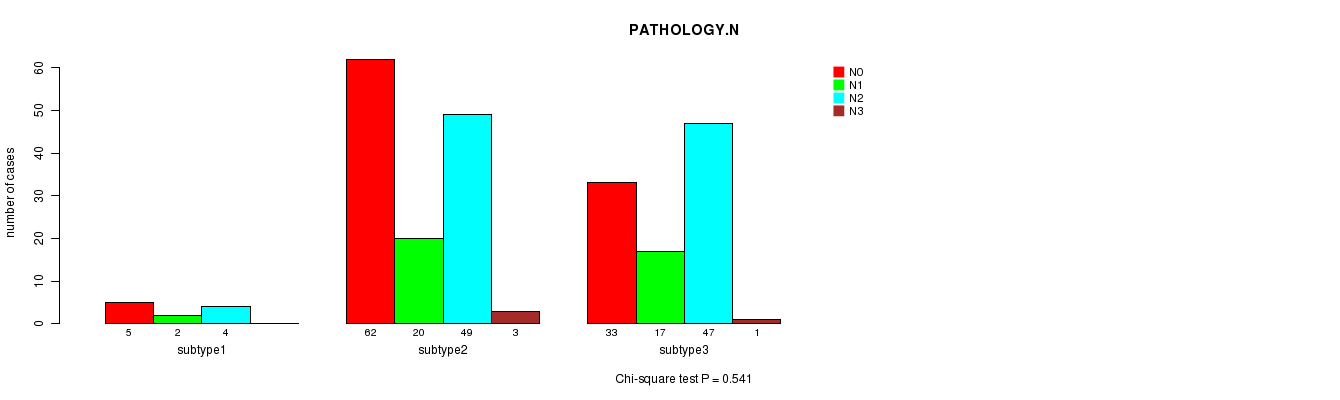
P value = 0.541 (Chi-square test)
Table S42. Clustering Approach #5: 'MIRseq cHierClus subtypes' versus Clinical Feature #5: 'PATHOLOGY.N'
| nPatients | N0 | N1 | N2 | N3 |
|---|---|---|---|---|
| ALL | 100 | 39 | 100 | 4 |
| subtype1 | 5 | 2 | 4 | 0 |
| subtype2 | 62 | 20 | 49 | 3 |
| subtype3 | 33 | 17 | 47 | 1 |
Figure S37. Get High-res Image Clustering Approach #5: 'MIRseq cHierClus subtypes' versus Clinical Feature #5: 'PATHOLOGY.N'
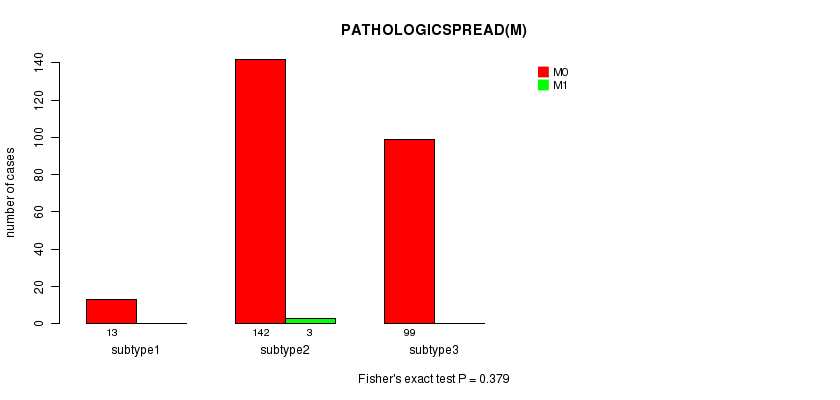
P value = 0.379 (Fisher's exact test)
Table S43. Clustering Approach #5: 'MIRseq cHierClus subtypes' versus Clinical Feature #6: 'PATHOLOGICSPREAD(M)'
| nPatients | M0 | M1 |
|---|---|---|
| ALL | 254 | 3 |
| subtype1 | 13 | 0 |
| subtype2 | 142 | 3 |
| subtype3 | 99 | 0 |
Figure S38. Get High-res Image Clustering Approach #5: 'MIRseq cHierClus subtypes' versus Clinical Feature #6: 'PATHOLOGICSPREAD(M)'
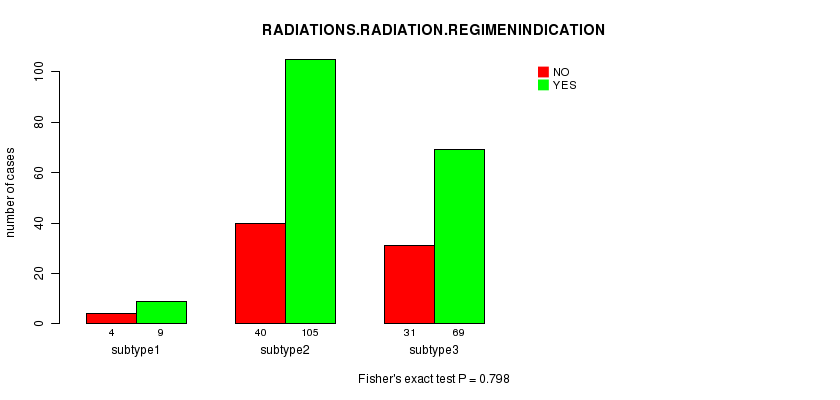
P value = 0.798 (Fisher's exact test)
Table S44. Clustering Approach #5: 'MIRseq cHierClus subtypes' versus Clinical Feature #7: 'RADIATIONS.RADIATION.REGIMENINDICATION'
| nPatients | NO | YES |
|---|---|---|
| ALL | 183 | 75 |
| subtype1 | 9 | 4 |
| subtype2 | 105 | 40 |
| subtype3 | 69 | 31 |
Figure S39. Get High-res Image Clustering Approach #5: 'MIRseq cHierClus subtypes' versus Clinical Feature #7: 'RADIATIONS.RADIATION.REGIMENINDICATION'
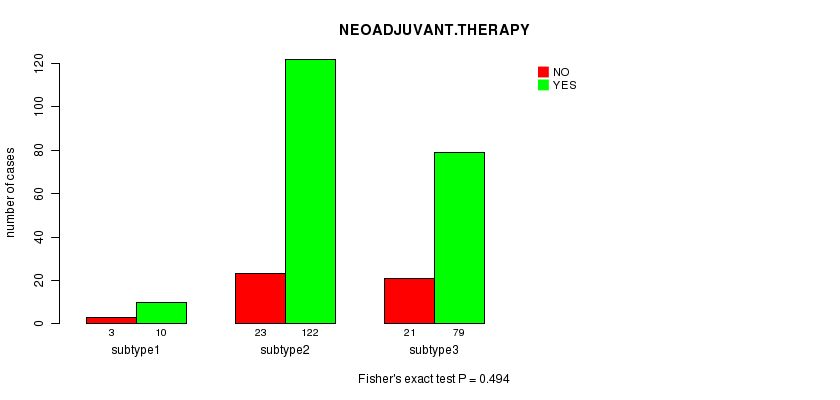
P value = 0.494 (Fisher's exact test)
Table S45. Clustering Approach #5: 'MIRseq cHierClus subtypes' versus Clinical Feature #8: 'NEOADJUVANT.THERAPY'
| nPatients | NO | YES |
|---|---|---|
| ALL | 47 | 211 |
| subtype1 | 3 | 10 |
| subtype2 | 23 | 122 |
| subtype3 | 21 | 79 |
Figure S40. Get High-res Image Clustering Approach #5: 'MIRseq cHierClus subtypes' versus Clinical Feature #8: 'NEOADJUVANT.THERAPY'
-
Cluster data file = HNSC.mergedcluster.txt
-
Clinical data file = HNSC.clin.merged.picked.txt
-
Number of patients = 290
-
Number of clustering approaches = 5
-
Number of selected clinical features = 8
-
Exclude small clusters that include fewer than K patients, K = 3
consensus non-negative matrix factorization clustering approach (Brunet et al. 2004)
Resampling-based clustering method (Monti et al. 2003)
For survival clinical features, the Kaplan-Meier survival curves of tumors with and without gene mutations were plotted and the statistical significance P values were estimated by logrank test (Bland and Altman 2004) using the 'survdiff' function in R
For continuous numerical clinical features, one-way analysis of variance (Howell 2002) was applied to compare the clinical values between tumor subtypes using 'anova' function in R
For binary clinical features, two-tailed Fisher's exact tests (Fisher 1922) were used to estimate the P values using the 'fisher.test' function in R
For multi-class clinical features (nominal or ordinal), Chi-square tests (Greenwood and Nikulin 1996) were used to estimate the P values using the 'chisq.test' function in R
This is an experimental feature. The full results of the analysis summarized in this report can be downloaded from the TCGA Data Coordination Center.