This pipeline uses various statistical tests to identify mRNAs whose expression levels correlated to selected clinical features.
Testing the association between 17814 genes and 6 clinical features across 72 samples, statistically thresholded by Q value < 0.05, 4 clinical features related to at least one genes.
-
14 genes correlated to 'GENDER'.
-
DDX3Y , RPS4Y1 , CYORF15A , EIF1AY , RPS4Y2 , ...
-
1 gene correlated to 'PATHOLOGY.T'.
-
TRIM11
-
89 genes correlated to 'PATHOLOGY.N'.
-
M6PRBP1 , FAM64A , GRAP2 , ULK1 , L2HGDH , ...
-
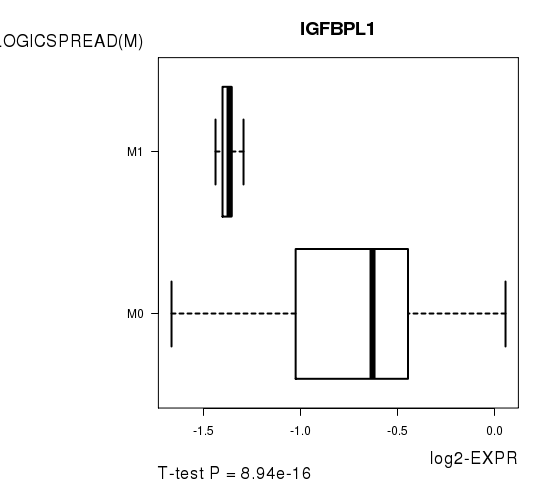
59 genes correlated to 'PATHOLOGICSPREAD(M)'.
-
IGFBPL1 , DDX3Y , CYORF15B , EIF1AY , GRIN2A , ...
-
No genes correlated to 'Time to Death', and 'AGE'.
Complete statistical result table is provided in Supplement Table 1
Table 1. Get Full Table This table shows the clinical features, statistical methods used, and the number of genes that are significantly associated with each clinical feature at Q value < 0.05.
| Clinical feature | Statistical test | Significant genes | Associated with | Associated with | ||
|---|---|---|---|---|---|---|
| Time to Death | Cox regression test | N=0 | ||||
| AGE | Spearman correlation test | N=0 | ||||
| GENDER | t test | N=14 | male | N=14 | female | N=0 |
| PATHOLOGY T | Spearman correlation test | N=1 | higher pT | N=1 | lower pT | N=0 |
| PATHOLOGY N | t test | N=89 | n1 | N=42 | n0 | N=47 |
| PATHOLOGICSPREAD(M) | t test | N=59 | m1 | N=17 | m0 | N=42 |
Table S1. Basic characteristics of clinical feature: 'Time to Death'
| Time to Death | Duration (Months) | 0.5-101.1 (median=32.6) |
| censored | N = 58 | |
| death | N = 13 | |
| Significant markers | N = 0 |
Table S2. Basic characteristics of clinical feature: 'AGE'
| AGE | Mean (SD) | 60.55 (12) |
| Significant markers | N = 0 |
Table S3. Basic characteristics of clinical feature: 'GENDER'
| GENDER | Labels | N |
| FEMALE | 29 | |
| MALE | 43 | |
| Significant markers | N = 14 | |
| Higher in MALE | 14 | |
| Higher in FEMALE | 0 |
Table S4. Get Full Table List of top 10 genes differentially expressed by 'GENDER'
| T(pos if higher in 'MALE') | ttestP | Q | AUC | |
|---|---|---|---|---|
| DDX3Y | 13.92 | 3.817e-21 | 6.8e-17 | 0.9583 |
| RPS4Y1 | 14.23 | 7.605e-21 | 1.35e-16 | 0.9615 |
| CYORF15A | 13.58 | 1.934e-20 | 3.45e-16 | 0.9687 |
| EIF1AY | 13.49 | 2.22e-20 | 3.95e-16 | 0.9647 |
| RPS4Y2 | 13.38 | 2.537e-20 | 4.52e-16 | 0.9567 |
| JARID1D | 12.61 | 3.928e-19 | 6.99e-15 | 0.9607 |
| ZFY | 11.99 | 1.925e-18 | 3.43e-14 | 0.9663 |
| CYORF15B | 11.16 | 3.496e-17 | 6.23e-13 | 0.9447 |
| UTY | 10.82 | 1.604e-16 | 2.86e-12 | 0.9575 |
| USP9Y | 9.74 | 1.181e-14 | 2.1e-10 | 0.9318 |
Figure S1. Get High-res Image As an example, this figure shows the association of DDX3Y to 'GENDER'. P value = 3.82e-21 with T-test analysis.
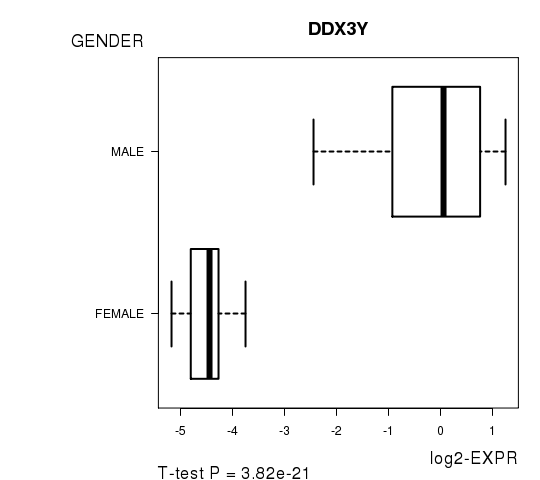
Table S5. Basic characteristics of clinical feature: 'PATHOLOGY.T'
| PATHOLOGY.T | Mean (SD) | 1.67 (0.84) |
| N | ||
| T1 | 41 | |
| T2 | 14 | |
| T3 | 17 | |
| Significant markers | N = 1 | |
| pos. correlated | 1 | |
| neg. correlated | 0 |
Table S6. Get Full Table List of one gene significantly correlated to 'PATHOLOGY.T' by Spearman correlation test
| SpearmanCorr | corrP | Q | |
|---|---|---|---|
| TRIM11 | 0.5385 | 1.064e-06 | 0.0189 |
Figure S2. Get High-res Image As an example, this figure shows the association of TRIM11 to 'PATHOLOGY.T'. P value = 1.06e-06 with Spearman correlation analysis.
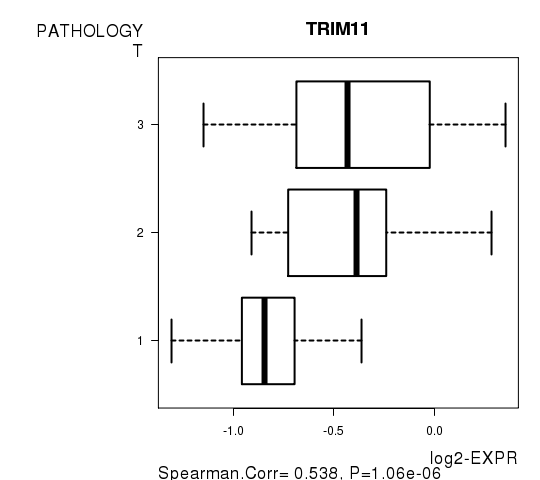
Table S7. Basic characteristics of clinical feature: 'PATHOLOGY.N'
| PATHOLOGY.N | Labels | N |
| N0 | 35 | |
| N1 | 3 | |
| Significant markers | N = 89 | |
| Higher in N1 | 42 | |
| Higher in N0 | 47 |
Table S8. Get Full Table List of top 10 genes differentially expressed by 'PATHOLOGY.N'
| T(pos if higher in 'N1') | ttestP | Q | AUC | |
|---|---|---|---|---|
| M6PRBP1 | 13.21 | 4.031e-14 | 7.14e-10 | 1 |
| FAM64A | 11.83 | 5.97e-14 | 1.06e-09 | 0.9714 |
| GRAP2 | -10.15 | 4.308e-12 | 7.63e-08 | 0.9524 |
| ULK1 | 10.62 | 9.997e-12 | 1.77e-07 | 0.9429 |
| L2HGDH | -9.83 | 1.033e-11 | 1.83e-07 | 0.9714 |
| FCHO1 | 9.95 | 1.321e-11 | 2.34e-07 | 0.9429 |
| MEG3 | 9.46 | 2.7e-11 | 4.78e-07 | 0.9524 |
| MRGPRF | 9.57 | 3.256e-11 | 5.76e-07 | 0.9429 |
| HSD17B7P2 | -9.4 | 3.921e-11 | 6.94e-07 | 0.9714 |
| FLJ40869 | 16.9 | 6.929e-11 | 1.23e-06 | 1 |
Figure S3. Get High-res Image As an example, this figure shows the association of M6PRBP1 to 'PATHOLOGY.N'. P value = 4.03e-14 with T-test analysis.
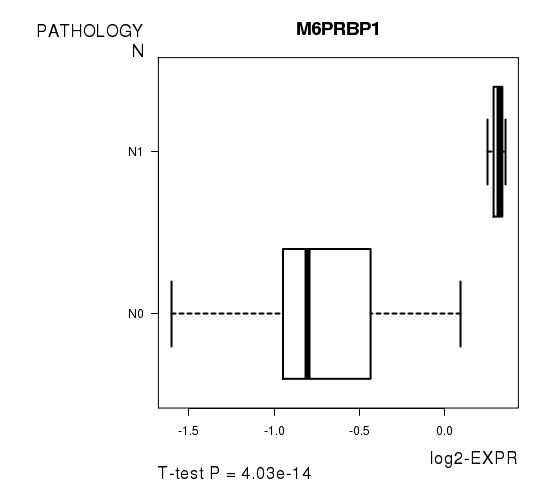
Table S9. Basic characteristics of clinical feature: 'PATHOLOGICSPREAD(M)'
| PATHOLOGICSPREAD(M) | Labels | N |
| M0 | 67 | |
| M1 | 5 | |
| Significant markers | N = 59 | |
| Higher in M1 | 17 | |
| Higher in M0 | 42 |
Table S10. Get Full Table List of top 10 genes differentially expressed by 'PATHOLOGICSPREAD(M)'
| T(pos if higher in 'M1') | ttestP | Q | AUC | |
|---|---|---|---|---|
| IGFBPL1 | -11.03 | 8.943e-16 | 1.59e-11 | 0.9164 |
| DDX3Y | -9.93 | 5.331e-15 | 9.5e-11 | 0.8269 |
| CYORF15B | -10.32 | 7.768e-14 | 1.38e-09 | 0.9254 |
| EIF1AY | -10.79 | 1.68e-13 | 2.99e-09 | 0.9493 |
| GRIN2A | -9.37 | 1.623e-12 | 2.89e-08 | 0.9433 |
| HOXA7 | -10.08 | 9e-12 | 1.6e-07 | 0.8955 |
| OAS1 | 9.36 | 2.099e-11 | 3.74e-07 | 0.9493 |
| UTY | -10.41 | 6.154e-11 | 1.1e-06 | 0.9851 |
| PELI2 | -8.93 | 6.744e-11 | 1.2e-06 | 0.8896 |
| FAM9B | -7.63 | 1.323e-10 | 2.36e-06 | 0.8388 |
Figure S4. Get High-res Image As an example, this figure shows the association of IGFBPL1 to 'PATHOLOGICSPREAD(M)'. P value = 8.94e-16 with T-test analysis.
-
Expresson data file = KIRC.medianexp.txt
-
Clinical data file = KIRC.clin.merged.picked.txt
-
Number of patients = 72
-
Number of genes = 17814
-
Number of clinical features = 6
For survival clinical features, Wald's test in univariate Cox regression analysis with proportional hazards model (Andersen and Gill 1982) was used to estimate the P values using the 'coxph' function in R. Kaplan-Meier survival curves were plot using the four quartile subgroups of patients based on expression levels
For continuous numerical clinical features, Spearman's rank correlation coefficients (Spearman 1904) and two-tailed P values were estimated using 'cor.test' function in R
For two-class clinical features, two-tailed Student's t test with unequal variance (Lehmann and Romano 2005) was applied to compare the log2-expression levels between the two clinical classes using 't.test' function in R
For multiple hypothesis correction, Q value is the False Discovery Rate (FDR) analogue of the P value (Benjamini and Hochberg 1995), defined as the minimum FDR at which the test may be called significant. We used the 'Benjamini and Hochberg' method of 'p.adjust' function in R to convert P values into Q values.
This is an experimental feature. The full results of the analysis summarized in this report can be downloaded from the TCGA Data Coordination Center.