This report serves to describe the mutational landscape and properties of a given individual set, as well as rank genes and genesets according to mutational significance. MutSig v1.5 was used to generate the results found in this report.
Working with individual set: KIRC.
Number of patients in set: 293
The input for this pipeline is a set of individuals with the following files associated for each:
1. An annotated .maf file describing the mutations called for the respective individual, and their properties.
2. A .wig file that contains information about the coverage of the sample.
Significantly mutated genes (q ≤ 0.1): 102
Mutations seen in COSMIC: 0
Significantly mutated genes in COSMIC territory: 0
Genes with clustered mutations (&le 3 aa apart): 3
Significantly mutated genesets: 44
Significantly mutated genesets: (excluding sig. mutated genes): 0
Table 1. Get Full Table Table representing breakdown of mutations by type.
| type | count |
|---|---|
| Frame_Shift_Del | 3 |
| In_Frame_Del | 2 |
| In_Frame_Ins | 1 |
| Missense_Mutation | 203 |
| Nonsense_Mutation | 10 |
| Silent | 97 |
| Splice_Site | 2 |
| Translation_Start_Site | 2 |
| Total | 320 |
Table 2. Get Full Table A breakdown of mutation rates per category discovered for this individual set.
| category | n | N | rate | rate_per_mb | relative_rate | exp_ns_s_ratio |
|---|---|---|---|---|---|---|
| *CpG->T | 22 | 5077983 | 4.3e-06 | 4.3 | 1.1 | 1.8 |
| *ApG->G | 15 | 8662545 | 1.7e-06 | 1.7 | 0.44 | 2.6 |
| *Np(A/C/T)->transit | 63 | 43398867 | 1.5e-06 | 1.5 | 0.37 | 1.8 |
| transver | 105 | 57139395 | 1.8e-06 | 1.8 | 0.47 | 4.4 |
| indel+null | 18 | 57139395 | 3.2e-07 | 0.32 | 0.081 | NaN |
| Total | 223 | 57139395 | 3.9e-06 | 3.9 | 1 | 3.2 |
The x axis represents the samples. The y axis represents the exons, one row per exon, and they are sorted by average coverage across samples. For exons with exactly the same average coverage, they are sorted next by the %GC of the exon. (The secondary sort is especially useful for the zero-coverage exons at the bottom).
Figure 1.
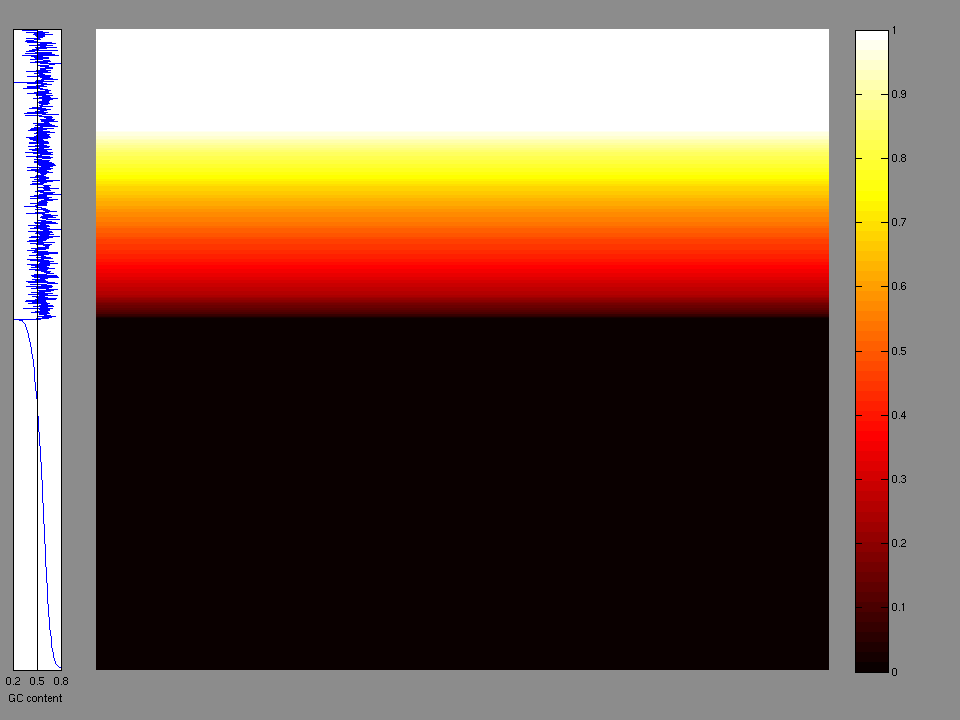
Figure 2.
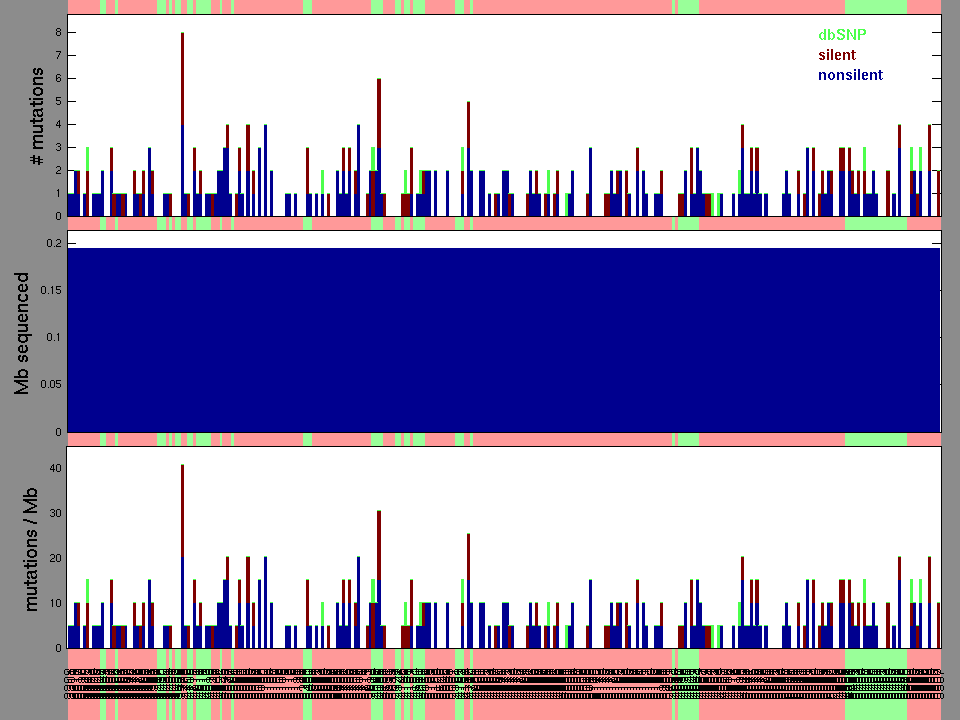
Table 3. Get Full Table A Ranked List of Significantly Mutated Genes. Number of significant genes found: 102. Number of genes displayed: 35
| rank | gene | description | N | n | npat | nsite | nsil | n1 | n2 | n3 | n4 | n5 | p_ns_s | p | q |
|---|---|---|---|---|---|---|---|---|---|---|---|---|---|---|---|
| 1 | PCDHA10 | protocadherin alpha 10 | 585707 | 5 | 5 | 5 | 0 | 1 | 0 | 2 | 2 | 0 | 0.15 | 1.5e-07 | 0.000042 |
| 2 | CT47B1 | 93467 | 3 | 3 | 3 | 1 | 0 | 0 | 1 | 2 | 0 | 0.8 | 2.2e-07 | 0.000042 | |
| 3 | WDR46 | WD repeat domain 46 | 146500 | 3 | 3 | 3 | 0 | 0 | 0 | 2 | 1 | 0 | 0.33 | 7.6e-07 | 0.000098 |
| 4 | PCDHGA1 | protocadherin gamma subfamily A, 1 | 645772 | 4 | 4 | 4 | 1 | 0 | 0 | 0 | 4 | 0 | 0.67 | 1.4e-06 | 0.00014 |
| 5 | USP48 | ubiquitin specific peptidase 48 | 292121 | 3 | 3 | 3 | 0 | 0 | 0 | 1 | 2 | 0 | 0.54 | 6.2e-06 | 0.00048 |
| 6 | TNFSF14 | tumor necrosis factor (ligand) superfamily, member 14 | 68855 | 2 | 2 | 2 | 0 | 0 | 0 | 0 | 2 | 0 | 0.61 | 0.000012 | 0.00066 |
| 7 | ABCC10 | ATP-binding cassette, sub-family C (CFTR/MRP), member 10 | 343982 | 3 | 3 | 3 | 1 | 0 | 0 | 1 | 2 | 0 | 0.63 | 0.000012 | 0.00066 |
| 8 | HOXC6 | homeobox C6 | 70027 | 2 | 2 | 2 | 0 | 0 | 0 | 2 | 0 | 0 | 0.41 | 0.000017 | 0.00077 |
| 9 | LACRT | lacritin | 34281 | 2 | 2 | 2 | 0 | 0 | 0 | 1 | 0 | 1 | 0.58 | 0.000018 | 0.00077 |
| 10 | PCDHGA8 | protocadherin gamma subfamily A, 8 | 565197 | 4 | 4 | 2 | 1 | 1 | 0 | 0 | 3 | 0 | 0.6 | 0.000021 | 0.00083 |
| 11 | KRTAP4-8 | keratin associated protein 4-8 | 55084 | 2 | 2 | 2 | 1 | 0 | 0 | 0 | 1 | 1 | 0.84 | 3e-05 | 0.001 |
| 12 | CRYGB | crystallin, gamma B | 50396 | 2 | 2 | 2 | 0 | 0 | 0 | 0 | 2 | 0 | 0.76 | 0.000031 | 0.001 |
| 13 | KHK | ketohexokinase (fructokinase) | 89951 | 3 | 3 | 3 | 1 | 0 | 1 | 1 | 1 | 0 | 0.73 | 0.000042 | 0.0012 |
| 14 | ZNF200 | zinc finger protein 200 | 96397 | 2 | 2 | 2 | 0 | 0 | 0 | 0 | 2 | 0 | 0.75 | 0.000044 | 0.0012 |
| 15 | UBE2Q1 | ubiquitin-conjugating enzyme E2Q (putative) 1 | 97862 | 2 | 2 | 2 | 0 | 0 | 0 | 0 | 1 | 1 | 0.48 | 0.000066 | 0.0017 |
| 16 | CLUAP1 | clusterin associated protein 1 | 108703 | 2 | 2 | 2 | 0 | 0 | 0 | 0 | 2 | 0 | 0.8 | 0.000075 | 0.0018 |
| 17 | C2orf62 | chromosome 2 open reading frame 62 | 108410 | 2 | 2 | 2 | 0 | 0 | 0 | 0 | 2 | 0 | 0.71 | 0.000077 | 0.0018 |
| 18 | PARS2 | prolyl-tRNA synthetase 2, mitochondrial (putative) | 109582 | 2 | 2 | 2 | 0 | 0 | 0 | 1 | 1 | 0 | 0.51 | 0.000086 | 0.0018 |
| 19 | KIAA1147 | KIAA1147 | 106066 | 2 | 2 | 2 | 0 | 0 | 0 | 1 | 1 | 0 | 0.55 | 0.000087 | 0.0018 |
| 20 | SLC35B2 | solute carrier family 35, member B2 | 126576 | 2 | 2 | 2 | 1 | 0 | 0 | 2 | 0 | 0 | 0.71 | 0.00015 | 0.0028 |
| 21 | FCRL1 | Fc receptor-like 1 | 161736 | 2 | 2 | 2 | 0 | 0 | 0 | 1 | 1 | 0 | 0.53 | 0.00035 | 0.0065 |
| 22 | ZNF20 | zinc finger protein 20 | 173163 | 2 | 2 | 2 | 0 | 0 | 0 | 0 | 1 | 1 | 0.75 | 0.00037 | 0.0065 |
| 23 | LIMA1 | LIM domain and actin binding 1 | 180195 | 2 | 2 | 2 | 1 | 0 | 0 | 0 | 1 | 1 | 0.81 | 0.00041 | 0.0069 |
| 24 | MAML1 | mastermind-like 1 (Drosophila) | 236158 | 2 | 2 | 2 | 1 | 0 | 0 | 0 | 2 | 0 | 0.92 | 0.00044 | 0.0071 |
| 25 | TMEM102 | transmembrane protein 102 | 160857 | 2 | 2 | 2 | 0 | 0 | 0 | 1 | 0 | 1 | 0.64 | 0.00047 | 0.0071 |
| 26 | ZNF214 | zinc finger protein 214 | 208909 | 2 | 2 | 2 | 0 | 0 | 0 | 0 | 2 | 0 | 0.77 | 0.00047 | 0.0071 |
| 27 | PCDHB9 | protocadherin beta 9 | 186348 | 2 | 2 | 2 | 0 | 0 | 0 | 1 | 1 | 0 | 0.52 | 0.00056 | 0.0078 |
| 28 | BACH2 | BTB and CNC homology 1, basic leucine zipper transcription factor 2 | 201291 | 2 | 2 | 2 | 1 | 0 | 0 | 1 | 1 | 0 | 0.85 | 0.00057 | 0.0078 |
| 29 | ZDHHC8 | zinc finger, DHHC-type containing 8 | 225024 | 2 | 2 | 2 | 1 | 0 | 0 | 0 | 2 | 0 | 0.87 | 0.00059 | 0.0078 |
| 30 | KLHL17 | kelch-like 17 (Drosophila) | 193380 | 2 | 2 | 2 | 0 | 0 | 0 | 1 | 1 | 0 | 0.5 | 0.0006 | 0.0078 |
| 31 | KRT36 | keratin 36 | 199826 | 2 | 2 | 2 | 0 | 0 | 0 | 0 | 2 | 0 | 0.72 | 0.00062 | 0.0078 |
| 32 | SLC12A9 | solute carrier family 12 (potassium/chloride transporters), member 9 | 261063 | 2 | 2 | 2 | 0 | 0 | 0 | 0 | 2 | 0 | 0.59 | 0.00077 | 0.0093 |
| 33 | ZNF284 | zinc finger protein 284 | 287433 | 2 | 2 | 2 | 0 | 0 | 0 | 1 | 0 | 1 | 0.43 | 0.00094 | 0.011 |
| 34 | SEMA4G | sema domain, immunoglobulin domain (Ig), transmembrane domain (TM) and short cytoplasmic domain, (semaphorin) 4G | 303255 | 2 | 2 | 2 | 0 | 0 | 0 | 1 | 1 | 0 | 0.52 | 0.0013 | 0.015 |
| 35 | PCDHB10 | protocadherin beta 10 | 194259 | 4 | 3 | 4 | 1 | 2 | 0 | 0 | 1 | 1 | 0.61 | 0.0014 | 0.016 |
Note:
N - number of sequenced bases in this gene across the individual set.
n - number of (nonsilent) mutations in this gene across the individual set.
npat - number of patients (individuals) with at least one nonsilent mutation.
nsite - number of unique sites having a non-silent mutation.
nsil - number of silent mutations in this gene across the individual set.
n1 - number of nonsilent mutations of type: *CpG->T .
n2 - number of nonsilent mutations of type: *ApG->G .
n3 - number of nonsilent mutations of type: *Np(A/C/T)->transit .
n4 - number of nonsilent mutations of type: transver .
n5 - number of nonsilent mutations of type: indel+null .
null - mutation category that includes nonsense, frameshift, splice-site mutations
p_classic = p-value for the observed amount of nonsilent mutations being elevated in this gene
p_ns_s = p-value for the observed nonsilent/silent ratio being elevated in this gene
p = p-value (overall)
q = q-value, False Discovery Rate (Benjamini-Hochberg procedure)
In this analysis, COSMIC is used as a filter to increase power by restricting the territory of each gene. Cosmic version: v48.
Table 4. Get Full Table Significantly mutated genes (COSMIC territory only). To access the database please go to: COSMIC. Number of significant genes found: 0. Number of genes displayed: 10
| rank | gene | description | n | cos | n_cos | N_cos | cos_ev | p | q |
|---|---|---|---|---|---|---|---|---|---|
| 1 | ABCC10 | ATP-binding cassette, sub-family C (CFTR/MRP), member 10 | 3 | 0 | 0 | 0 | 0 | 1 | 1 |
| 2 | BACH2 | BTB and CNC homology 1, basic leucine zipper transcription factor 2 | 2 | 0 | 0 | 0 | 0 | 1 | 1 |
| 3 | BSN | bassoon (presynaptic cytomatrix protein) | 3 | 0 | 0 | 0 | 0 | 1 | 1 |
| 4 | CLIC1 | chloride intracellular channel 1 | 0 | 0 | 0 | 0 | 0 | 1 | 1 |
| 5 | FAM78B | family with sequence similarity 78, member B | 0 | 0 | 0 | 0 | 0 | 1 | 1 |
| 6 | FGF23 | fibroblast growth factor 23 | 1 | 0 | 0 | 0 | 0 | 1 | 1 |
| 7 | GNAT1 | guanine nucleotide binding protein (G protein), alpha transducing activity polypeptide 1 | 1 | 0 | 0 | 0 | 0 | 1 | 1 |
| 8 | KLC4 | kinesin light chain 4 | 0 | 0 | 0 | 0 | 0 | 1 | 1 |
| 9 | LACRT | lacritin | 2 | 0 | 0 | 0 | 0 | 1 | 1 |
| 10 | MSH5 | mutS homolog 5 (E. coli) | 0 | 0 | 0 | 0 | 0 | 1 | 1 |
Note:
n - number of (nonsilent) mutations in this gene across the individual set.
cos = number of unique mutated sites in this gene in COSMIC
n_cos = overlap between n and cos.
N_cos = number of individuals times cos.
cos_ev = total evidence: number of reports in COSMIC for mutations seen in this gene.
p = p-value for seeing the observed amount of overlap in this gene)
q = q-value, False Discovery Rate (Benjamini-Hochberg procedure)
Table 5. Get Full Table Genes with Clustered Mutations
| num | gene | desc | n | mindist | npairs3 | npairs12 |
|---|---|---|---|---|---|---|
| 94 | PCDHGA8 | protocadherin gamma subfamily A, 8 | 4 | 0 | 3 | 3 |
| 84 | PCDHB10 | protocadherin beta 10 | 4 | 1 | 1 | 1 |
| 55 | KHK | ketohexokinase (fructokinase) | 3 | 2 | 1 | 1 |
| 58 | KRT36 | keratin 36 | 2 | 7 | 0 | 1 |
| 133 | USP48 | ubiquitin specific peptidase 48 | 3 | 7 | 0 | 1 |
| 82 | PCDHA6 | protocadherin alpha 6 | 4 | 13 | 0 | 0 |
| 9 | BSN | bassoon (presynaptic cytomatrix protein) | 3 | 22 | 0 | 0 |
| 86 | PCDHB7 | protocadherin beta 7 | 4 | 22 | 0 | 0 |
| 144 | ZNF284 | zinc finger protein 284 | 2 | 31 | 0 | 0 |
| 60 | LACRT | lacritin | 2 | 32 | 0 | 0 |
Note:
n - number of mutations in this gene in the individual set.
mindist - distance (in aa) between closest pair of mutations in this gene
npairs3 - how many pairs of mutations are within 3 aa of each other.
npairs12 - how many pairs of mutations are within 12 aa of each other.
Table 6. Get Full Table A Ranked List of Significantly Mutated Genesets. (Source: MSigDB GSEA Cannonical Pathway Set).Number of significant genesets found: 44. Number of genesets displayed: 10
| rank | geneset | description | genes | N_genes | mut_tally | N | n | npat | nsite | nsil | n1 | n2 | n3 | n4 | n5 | p_ns_s | p | q |
|---|---|---|---|---|---|---|---|---|---|---|---|---|---|---|---|---|---|---|
| 1 | HSA02010_ABC_TRANSPORTERS_GENERAL | Genes involved in ABC transporters - general | ABCA1, ABCA10, ABCA12, ABCA13, ABCA2, ABCA3, ABCA4, ABCA5, ABCA6, ABCA7, ABCA8, ABCA9, ABCB1, ABCB10, ABCB11, ABCB4, ABCB5, ABCB6, ABCB7, ABCB8, ABCB9, ABCC1, ABCC10, ABCC11, ABCC12, ABCC2, ABCC3, ABCC4, ABCC5, ABCC6, ABCC8, ABCC9, ABCD1, ABCD2, ABCD3, ABCD4, ABCG1, ABCG2, ABCG4, ABCG5, ABCG8, CFTR, TAP1, TAP2 | 1 | ABCC10(3) | 343982 | 3 | 3 | 3 | 1 | 0 | 0 | 1 | 2 | 0 | 0.63 | 0.000012 | 0.0019 |
| 2 | FEEDERPATHWAY | Sugars such as mannose, galactose, and fructose are enzymatically converted to glucose via feeder pathways that lead to glycolysis. | HK1, KHK, LCT, MPI, PGM1, PYGL, PYGM, TPI1, TREH | 1 | KHK(3) | 89951 | 3 | 3 | 3 | 1 | 0 | 1 | 1 | 1 | 0 | 0.73 | 0.000042 | 0.002 |
| 3 | FRUCTOSE_AND_MANNOSE_METABOLISM | AKR1B1, ALDOA, ALDOB, ALDOC, FBP1, FBP2, FPGT, GCK, GMDS, GMPPA, GMPPB, HK1, HK2, HK3, KHK, MPI, PFKFB1, PFKFB3, PFKFB4, PFKM, PFKP, PMM1, PMM2, SORD, TPI1 | 1 | KHK(3) | 89951 | 3 | 3 | 3 | 1 | 0 | 1 | 1 | 1 | 0 | 0.73 | 0.000042 | 0.002 | |
| 4 | HSA04060_CYTOKINE_CYTOKINE_RECEPTOR_INTERACTION | Genes involved in cytokine-cytokine receptor interaction | ACVR1, ACVR1B, ACVR2A, ACVR2B, AMH, AMHR2, BMP2, BMP7, BMPR1A, BMPR1B, BMPR2, CCL1, CCL11, CCL13, CCL14, CCL15, CCL16, CCL17, CCL18, CCL19, CCL2, CCL20, CCL21, CCL22, CCL23, CCL24, CCL25, CCL26, CCL27, CCL28, CCL3, CCL4, CCL5, CCL7, CCL8, CCR1, CCR2, CCR3, CCR4, CCR5, CCR6, CCR7, CCR8, CCR9, CD27, CD40, CD40LG, CD70, CLCF1, CNTF, CNTFR, CRLF2, CSF1, CSF1R, CSF2, CSF2RA, CSF2RB, CSF3, CSF3R, CTF1, CX3CL1, CX3CR1, CXCL1, CXCL10, CXCL11, CXCL12, CXCL13, CXCL14, CXCL16, CXCL2, CXCL3, CXCL5, CXCL6, CXCL9, CXCR3, CXCR4, CXCR6, EDA, EDA2R, EDAR, EGF, EGFR, EPO, EPOR, FAS, FASLG, FLJ78302, FLT1, FLT3, FLT3LG, FLT4, GDF5, GH1, GH2, GHR, HGF, IFNA1, IFNA10, IFNA13, IFNA14, IFNA16, IFNA17, IFNA2, IFNA21, IFNA4, IFNA5, IFNA6, IFNA7, IFNA8, IFNAR1, IFNAR2, IFNB1, IFNE1, IFNG, IFNGR1, IFNGR2, IFNK, IFNW1, IL10, IL10RA, IL10RB, IL11, IL11RA, IL12A, IL12B, IL12RB1, IL12RB2, IL13, IL13RA1, IL15, IL15RA, IL17A, IL17B, IL17RA, IL17RB, IL18, IL18R1, IL18RAP, IL19, IL1A, IL1B, IL1R1, IL1R2, IL1RAP, IL2, IL20, IL20RA, IL21, IL21R, IL22, IL22RA1, IL22RA2, IL23A, IL23R, IL24, IL25, IL26, IL28A, IL28B, IL28RA, IL29, IL2RA, IL2RB, IL2RG, IL3, IL3RA, IL4, IL4R, IL5, IL5RA, IL6, IL6R, IL6ST, IL7, IL7R, IL8, IL8RA, IL8RB, IL9, IL9R, INHBA, INHBB, INHBC, INHBE, KDR, KIT, KITLG, LEP, LEPR, LIF, LIFR, LOC728045, LTA, LTB, LTBR, MET, MPL, NGFR, OSM, OSMR, PDGFB, PDGFC, PDGFRA, PDGFRB, PF4, PF4V1, PLEKHO2, PPBP, PRL, PRLR, RELT, TGFB1, TGFB2, TGFB3, TGFBR1, TGFBR2, TNF, TNFRSF10A, TNFRSF10B, TNFRSF10C, TNFRSF10D, TNFRSF11A, TNFRSF11B, TNFRSF12A, TNFRSF13B, TNFRSF13C, TNFRSF14, TNFRSF17, TNFRSF18, TNFRSF19, TNFRSF1A, TNFRSF1B, TNFRSF21, TNFRSF25, TNFRSF4, TNFRSF6B, TNFRSF8, TNFRSF9, TNFSF10, TNFSF11, TNFSF12, TNFSF13, TNFSF13B, TNFSF14, TNFSF15, TNFSF18, TNFSF4, TNFSF8, TNFSF9, TPO, TSLP, VEGFA, VEGFB, VEGFC, XCL1, XCL2, XCR1 | 8 | CCL2(1), TNFSF14(2) | 458252 | 3 | 3 | 3 | 0 | 0 | 0 | 0 | 3 | 0 | 0.55 | 0.000051 | 0.002 |
| 5 | HSA00970_AMINOACYL_TRNA_BIOSYNTHESIS | Genes involved in aminoacyl-tRNA biosynthesis | AARS, AARS2, CARS, CARS2, DARS, DARS2, EARS2, EPRS, FARS2, FARSA, FARSB, GARS, HARS, HARS2, IARS, IARS2, KARS, LARS, LARS2, MARS, MARS2, MTFMT, NARS, NARS2, PARS2, QARS, RARS, RARS2, SARS, SARS2, TARS, TARS2, VARS, VARS2, WARS, WARS2, YARS, YARS2 | 2 | PARS2(2), QARS(1) | 477297 | 3 | 3 | 3 | 1 | 0 | 0 | 2 | 1 | 0 | 0.62 | 0.000076 | 0.0023 |
| 6 | HSA00330_ARGININE_AND_PROLINE_METABOLISM | Genes involved in arginine and proline metabolism | ALDH4A1, ARG1, ARG2, ASL, ASS1, CKB, CKM, CKMT1A, CKMT1B, CKMT2, CPS1, DAO, EPRS, GAMT, GATM, GLUD1, GLUD2, GOT1, GOT2, LAP3, NOS1, NOS2A, NOS3, OAT, OTC, P4HA1, P4HA2, P4HA3, PARS2, PRODH, PYCR1, PYCR2, PYCRL, RARS, RARS2 | 1 | PARS2(2) | 109582 | 2 | 2 | 2 | 0 | 0 | 0 | 1 | 1 | 0 | 0.51 | 0.000086 | 0.0023 |
| 7 | HSA04330_NOTCH_SIGNALING_PATHWAY | Genes involved in Notch signaling pathway | ADAM17, APH1A, CIR, CREBBP, CTBP1, CTBP2, DLL1, DLL3, DLL4, DTX1, DTX2, DTX3, DTX3L, DTX4, DVL1, DVL2, DVL3, EP300, GCN5L2, HDAC1, HDAC2, HES1, JAG1, JAG2, LFNG, LOC652788, MAML1, MAML2, MAML3, MFNG, NCOR2, NCSTN, NOTCH1, NOTCH2, NOTCH3, NOTCH4, NUMB, NUMBL, PCAF, PSEN1, PSEN2, PSENEN, PTCRA, RBPJ, RBPJL, RFNG, SNW1 | 3 | MAML1(2), RBPJL(1) | 654855 | 3 | 3 | 3 | 1 | 0 | 0 | 1 | 2 | 0 | 0.79 | 0.00027 | 0.006 |
| 8 | HSA01031_GLYCAN_STRUCTURES_BIOSYNTHESIS_2 | Genes involved in glycan structures - biosynthesis 2 | A4GALT, ABO, B3GALNT1, B3GALT1, B3GALT2, B3GALT4, B3GALT5, B3GNT1, B3GNT2, B3GNT3, B3GNT4, B3GNT5, B4GALNT1, B4GALT1, B4GALT2, B4GALT3, B4GALT4, B4GALT6, FUT1, FUT2, FUT3, FUT4, FUT5, FUT6, FUT7, FUT9, GBGT1, GCNT2, PIGA, PIGB, PIGC, PIGF, PIGG, PIGH, PIGK, PIGL, PIGM, PIGN, PIGO, PIGP, PIGQ, PIGS, PIGT, PIGU, PIGV, PIGX, PIGZ, ST3GAL1, ST3GAL2, ST3GAL3, ST3GAL4, ST3GAL5, ST3GAL6, ST6GALNAC3, ST6GALNAC4, ST6GALNAC5, ST6GALNAC6, ST8SIA1, ST8SIA5, UGCG, UGCGL1, UGCGL2 | 4 | B3GALT4(1), B3GNT1(1), PIGO(1) | 864057 | 3 | 3 | 3 | 1 | 0 | 0 | 1 | 2 | 0 | 0.68 | 0.0007 | 0.014 |
| 9 | HSA00920_SULFUR_METABOLISM | Genes involved in sulfur metabolism | BPNT1, CHST11, CHST12, CHST13, PAPSS1, PAPSS2, SULT1A1, SULT1A2, SULT1A3, SULT1A4, SULT1E1, SULT2A1, SULT2B1, SUOX | 1 | SUOX(2) | 135952 | 2 | 2 | 2 | 0 | 0 | 1 | 1 | 0 | 0 | 0.38 | 0.0022 | 0.035 |
| 10 | SULFUR_METABOLISM | BPNT1, PAPSS1, PAPSS2, SULT1A2, SULT1A3, SULT1A3, SULT1A4, SULT1E1, SULT2A1, SUOX | 1 | SUOX(2) | 135952 | 2 | 2 | 2 | 0 | 0 | 1 | 1 | 0 | 0 | 0.38 | 0.0022 | 0.035 |
Table 7. Get Full Table A Ranked List of Significantly Mutated Genesets (Excluding Significantly Mutated Genes). Number of significant genesets found: 0. Number of genesets displayed: 10
| rank | geneset | description | genes | N_genes | mut_tally | N | n | npat | nsite | nsil | n1 | n2 | n3 | n4 | n5 | p_ns_s | p | q |
|---|---|---|---|---|---|---|---|---|---|---|---|---|---|---|---|---|---|---|
| 1 | HSA00533_KERATAN_SULFATE_BIOSYNTHESIS | Genes involved in keratan sulfate biosynthesis | B3GNT1, B3GNT2, B3GNT7, B4GALT1, B4GALT2, B4GALT3, B4GALT4, CHST1, CHST2, CHST4, CHST6, FUT8, ST3GAL1, ST3GAL2, ST3GAL3, ST3GAL4 | 1 | B3GNT1(1) | 151774 | 1 | 1 | 1 | 0 | 0 | 0 | 1 | 0 | 0 | 0.59 | 0.027 | 0.68 |
| 2 | KERATAN_SULFATE_BIOSYNTHESIS | B3GNT1, B4GALT1, B4GALT2, B4GALT3, B4GALT5, FUT8, SIAT4A, SIAT4B, SIAT6, ST3GAL1, ST3GAL2, ST3GAL3, ST3GAL4 | 1 | B3GNT1(1) | 151774 | 1 | 1 | 1 | 0 | 0 | 0 | 1 | 0 | 0 | 0.59 | 0.027 | 0.68 | |
| 3 | HISTONE_METHYLTRANSFERASE | Genes with HMT activity | AOF2, KDM6A, ASH1L, ASH2L, C17orf79, CARM1, CTCFL, DOT1L, EED, EHMT1, EHMT2, EZH1, EZH2, FBXL10, FBXL11, FBXO11, HCFC1, HSF4, JMJD1A, JMJD1B, JMJD2A, JMJD2B, JMJD2C, JMJD2D, JMJD3, JMJD4, JMJD6, MEN1, MLL, MLL2, MLL3, MLL4, MLL5, NSD1, OGT, PAXIP1, PPP1CA, PPP1CB, PPP1CC, PRDM2, PRDM6, PRDM7, PRDM9, PRMT1, PRMT5, PRMT6, PRMT7, PRMT8, RBBP5, SATB1, SETD1A, SETD1B, SETD2, SETD7, SETD8, SETDB1, SETDB2, SETMAR, SMYD3, STK38, SUV39H1, SUV39H2, SUV420H1, SUV420H2, SUZ12, WHSC1, WHSC1L1 | 1 | EHMT2(2) | 293879 | 2 | 2 | 2 | 0 | 1 | 1 | 0 | 0 | 0 | 0.52 | 0.027 | 0.68 |
| 4 | LYSINE_DEGRADATION | AADAT, AASDH, AASDHPPT, AASS, ACAT1, ACAT2, ALDH1A1, ALDH1A2, ALDH1A3, ALDH1B1, ALDH2, ALDH3A1, ALDH3A2, ALDH9A1, ATP6V0C, SHMT1, BAT8, BBOX1, DLST, DLSTP, DOT1L, ECHS1, EHHADH, EHMT1, EHMT2, GCDH, HADHA, PLOD1, PLOD2, PLOD3, SDS, SHMT1, SHMT2, TMLHE | 1 | EHMT2(2) | 293879 | 2 | 2 | 2 | 0 | 1 | 1 | 0 | 0 | 0 | 0.52 | 0.027 | 0.68 | |
| 5 | HSA01031_GLYCAN_STRUCTURES_BIOSYNTHESIS_2 | Genes involved in glycan structures - biosynthesis 2 | A4GALT, ABO, B3GALNT1, B3GALT1, B3GALT2, B3GALT4, B3GALT5, B3GNT1, B3GNT2, B3GNT3, B3GNT4, B3GNT5, B4GALNT1, B4GALT1, B4GALT2, B4GALT3, B4GALT4, B4GALT6, FUT1, FUT2, FUT3, FUT4, FUT5, FUT6, FUT7, FUT9, GBGT1, GCNT2, PIGA, PIGB, PIGC, PIGF, PIGG, PIGH, PIGK, PIGL, PIGM, PIGN, PIGO, PIGP, PIGQ, PIGS, PIGT, PIGU, PIGV, PIGX, PIGZ, ST3GAL1, ST3GAL2, ST3GAL3, ST3GAL4, ST3GAL5, ST3GAL6, ST6GALNAC3, ST6GALNAC4, ST6GALNAC5, ST6GALNAC6, ST8SIA1, ST8SIA5, UGCG, UGCGL1, UGCGL2 | 3 | B3GNT1(1), PIGO(1) | 766488 | 2 | 2 | 2 | 1 | 0 | 0 | 1 | 1 | 0 | 0.77 | 0.029 | 0.68 |
| 6 | HSA00100_BIOSYNTHESIS_OF_STEROIDS | Genes involved in biosynthesis of steroids | CYP27B1, CYP51A1, DHCR24, DHCR7, EBP, FDFT1, FDPS, GGCX, GGPS1, HMGCR, HSD17B7, IDI1, IDI2, LSS, MVD, MVK, NQO1, NSDHL, PMVK, SC4MOL, SC5DL, SQLE, TM7SF2, VKORC1 | 1 | TM7SF2(1) | 166131 | 1 | 1 | 1 | 0 | 0 | 0 | 0 | 0 | 1 | 1 | 0.031 | 0.68 |
| 7 | PARKINPATHWAY | In Parkinson's disease, dopaminergic neurons contain Lewy bodies consisting of alpha-synuclein and parkin, an E3 ubiquitin ligase that targets glycosylated alpha-synuclein. | GPR37, PARK2, PNUTL1, SNCA, SNCAIP, UBE2E2, UBE2F, UBE2G1, UBE2G2, UBE2L3, UBE2L6, UBL1 | 1 | SNCAIP(1) | 248757 | 1 | 1 | 1 | 1 | 0 | 0 | 1 | 0 | 0 | 0.88 | 0.067 | 1 |
| 8 | HSA01030_GLYCAN_STRUCTURES_BIOSYNTHESIS_1 | Genes involved in glycan structures - biosynthesis 1 | A4GNT, ALG1, ALG10, ALG10B, ALG11, ALG12, ALG13, ALG14, ALG2, ALG3, ALG6, ALG8, ALG9, B3GALT6, B3GNT1, B3GNT2, B3GNT6, B3GNT7, B4GALT1, B4GALT2, B4GALT3, B4GALT4, B4GALT5, B4GALT7, C1GALT1, C1GALT1C1, ChGn, CHPF, CHST1, CHST11, CHST12, CHST13, CHST14, CHST2, CHST3, CHST4, CHST6, CHST7, CHSY-2, CHSY1, CSGlcA-T, DAD1, DDOST, DPAGT1, EXT1, EXT2, EXTL1, EXTL2, EXTL3, FUT11, FUT8, GALNAC4S-6ST, GALNACT-2, GALNT1, GALNT10, GALNT11, GALNT12, GALNT13, GALNT14, GALNT17, GALNT2, GALNT3, GALNT4, GALNT5, GALNT6, GALNT7, GALNT8, GALNT9, GALNTL1, GALNTL2, GALNTL4, GALNTL5, GANAB, GCNT1, GCNT3, GCNT4, GCS1, HS2ST1, HS3ST1, HS3ST2, HS3ST3A1, HS3ST3B1, HS3ST5, HS6ST1, HS6ST2, HS6ST3, LOC728969, MAN1A1, MAN1A2, MAN1B1, MAN1C1, MAN2A1, MGAT1, MGAT2, MGAT3, MGAT4A, MGAT4B, MGAT5, MGAT5B, NDST1, NDST2, NDST3, NDST4, OGT, RPN1, RPN2, ST3GAL1, ST3GAL2, ST3GAL3, ST3GAL4, ST6GAL1, ST6GALNAC1, STT3B, UST, WBSCR17, XYLT1, XYLT2 | 2 | B3GNT1(1) | 230298 | 1 | 1 | 1 | 0 | 0 | 0 | 1 | 0 | 0 | 0.59 | 0.076 | 1 |
| 9 | HSA03030_DNA_POLYMERASE | Genes involved in DNA polymerase | POLA1, POLA2, POLB, POLD1, POLD2, POLD3, POLD4, POLE, POLE2, POLE3, POLE4, POLG, POLG2, POLH, POLI, POLK, POLL, POLM, POLQ, POLS, PRIM1, PRIM2, REV1, REV3L, RFC5 | 1 | POLM(1) | 256668 | 1 | 1 | 1 | 1 | 0 | 0 | 0 | 1 | 0 | 0.95 | 0.082 | 1 |
| 10 | HSA00563_GLYCOSYLPHOSPHATIDYLINOSITOL_ANCHOR_BIOSYNTHESIS | Genes involved in glycosylphosphatidylinositol(GPI)-anchor biosynthesis | GPAA1, GPLD1, PGAP1, PIGA, PIGB, PIGC, PIGF, PIGG, PIGH, PIGK, PIGL, PIGM, PIGN, PIGO, PIGP, PIGQ, PIGS, PIGT, PIGU, PIGV, PIGW, PIGX, PIGZ | 1 | PIGO(1) | 322007 | 1 | 1 | 1 | 1 | 0 | 0 | 0 | 1 | 0 | 0.92 | 0.12 | 1 |
In brief, we tabulate the number of mutations and the number of covered bases for each gene. The counts are broken down by mutation context category: four context categories that are discovered by MutSig, and one for indel and 'null' mutations, which include indels, nonsense mutations, splice-site mutations, and non-stop (read-through) mutations. For each gene, we calculate the probability of seeing the observed constellation of mutations, i.e. the product P1 x P2 x ... x Pm, or a more extreme one, given the background mutation rates calculated across the dataset.[1]
This is an experimental feature. The full results of the analysis summarized in this report can be downloaded from the TCGA Data Coordination Center.