This pipeline uses various statistical tests to identify mRNAs whose expression levels correlated to selected clinical features.
Testing the association between 17814 genes and 9 clinical features across 154 samples, statistically thresholded by Q value < 0.05, 4 clinical features related to at least one genes.
-
13 genes correlated to 'GENDER'.
-
RPS4Y1 , RPS4Y2 , DDX3Y , EIF1AY , CYORF15A , ...
-
16 genes correlated to 'HISTOLOGICAL.TYPE'.
-
FAM5B , NUT , A2BP1 , SPINK7 , CAPZA3 , ...
-
16 genes correlated to 'PATHOLOGICSPREAD(M)'.
-
NSD1 , C7ORF30 , RGPD5 , GPR97 , CD274 , ...
-
2 genes correlated to 'NEOADJUVANT.THERAPY'.
-
MAGOH , HEATR5B
-
No genes correlated to 'Time to Death', 'AGE', 'KARNOFSKY.PERFORMANCE.SCORE', 'PATHOLOGY.T', and 'PATHOLOGY.N'.
Complete statistical result table is provided in Supplement Table 1
Table 1. Get Full Table This table shows the clinical features, statistical methods used, and the number of genes that are significantly associated with each clinical feature at Q value < 0.05.
| Clinical feature | Statistical test | Significant genes | Associated with | Associated with | ||
|---|---|---|---|---|---|---|
| Time to Death | Cox regression test | N=0 | ||||
| AGE | Spearman correlation test | N=0 | ||||
| GENDER | t test | N=13 | male | N=13 | female | N=0 |
| KARNOFSKY PERFORMANCE SCORE | Spearman correlation test | N=0 | ||||
| HISTOLOGICAL TYPE | ANOVA test | N=16 | ||||
| PATHOLOGY T | Spearman correlation test | N=0 | ||||
| PATHOLOGY N | Spearman correlation test | N=0 | ||||
| PATHOLOGICSPREAD(M) | t test | N=16 | m1 | N=7 | m0 | N=9 |
| NEOADJUVANT THERAPY | t test | N=2 | yes | N=1 | no | N=1 |
Table S1. Basic characteristics of clinical feature: 'Time to Death'
| Time to Death | Duration (Months) | 0.4-173.8 (median=18.2) |
| censored | N = 86 | |
| death | N = 62 | |
| Significant markers | N = 0 |
Table S2. Basic characteristics of clinical feature: 'AGE'
| AGE | Mean (SD) | 66.53 (8.6) |
| Significant markers | N = 0 |
Table S3. Basic characteristics of clinical feature: 'GENDER'
| GENDER | Labels | N |
| FEMALE | 44 | |
| MALE | 110 | |
| Significant markers | N = 13 | |
| Higher in MALE | 13 | |
| Higher in FEMALE | 0 |
Table S4. Get Full Table List of top 10 genes differentially expressed by 'GENDER'
| T(pos if higher in 'MALE') | ttestP | Q | AUC | |
|---|---|---|---|---|
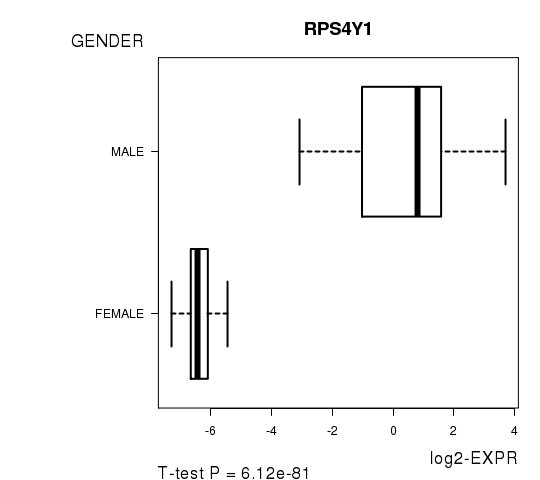
| RPS4Y1 | 41.28 | 6.117e-81 | 1.09e-76 | 1 |
| RPS4Y2 | 33.34 | 1.553e-70 | 2.77e-66 | 1 |
| DDX3Y | 26.87 | 9.588e-55 | 1.71e-50 | 0.9998 |
| EIF1AY | 24.61 | 3.14e-50 | 5.59e-46 | 0.9967 |
| CYORF15A | 18.75 | 1.076e-35 | 1.92e-31 | 0.9897 |
| UTY | 15.97 | 1.406e-32 | 2.5e-28 | 0.964 |
| JARID1D | 16.81 | 7.289e-30 | 1.3e-25 | 0.981 |
| ZFY | 13.73 | 9.25e-27 | 1.65e-22 | 0.9426 |
| TTTY14 | 12.34 | 1.436e-24 | 2.56e-20 | 0.9531 |
| CYORF15B | 13.3 | 7.232e-23 | 1.29e-18 | 0.9442 |
Figure S1. Get High-res Image As an example, this figure shows the association of RPS4Y1 to 'GENDER'. P value = 6.12e-81 with T-test analysis.
No gene related to 'KARNOFSKY.PERFORMANCE.SCORE'.
Table S5. Basic characteristics of clinical feature: 'KARNOFSKY.PERFORMANCE.SCORE'
| KARNOFSKY.PERFORMANCE.SCORE | Mean (SD) | 24.23 (38) |
| Score | N | |
| 0 | 18 | |
| 50 | 2 | |
| 70 | 1 | |
| 90 | 4 | |
| 100 | 1 | |
| Significant markers | N = 0 |
Table S6. Basic characteristics of clinical feature: 'HISTOLOGICAL.TYPE'
| HISTOLOGICAL.TYPE | Labels | N |
| LUNG BASALOID SQUAMOUS CELL CARCINOMA | 5 | |
| LUNG PAPILLARY SQUAMOUS CELL CARICNOMA | 1 | |
| LUNG SQUAMOUS CELL CARCINOMA- NOT OTHERWISE SPECIFIED (NOS) | 148 | |
| Significant markers | N = 16 |
Table S7. Get Full Table List of top 10 genes differentially expressed by 'HISTOLOGICAL.TYPE'
| ANOVA_P | Q | |
|---|---|---|
| FAM5B | 9.102e-11 | 1.62e-06 |
| NUT | 9.666e-11 | 1.72e-06 |
| A2BP1 | 6.66e-09 | 0.000119 |
| SPINK7 | 3.515e-08 | 0.000626 |
| CAPZA3 | 8.641e-08 | 0.00154 |
| PDS5B | 1.278e-07 | 0.00228 |
| GABRA4 | 1.528e-07 | 0.00272 |
| UGT2B10 | 1.636e-07 | 0.00291 |
| CCDC100 | 1.945e-07 | 0.00346 |
| MGC21881 | 2.886e-07 | 0.00514 |
Figure S2. Get High-res Image As an example, this figure shows the association of FAM5B to 'HISTOLOGICAL.TYPE'. P value = 9.1e-11 with ANOVA analysis.

Table S8. Basic characteristics of clinical feature: 'PATHOLOGY.T'
| PATHOLOGY.T | Mean (SD) | 2.04 (0.77) |
| N | ||
| T1 | 30 | |
| T2 | 100 | |
| T3 | 12 | |
| T4 | 12 | |
| Significant markers | N = 0 |
Table S9. Basic characteristics of clinical feature: 'PATHOLOGY.N'
| PATHOLOGY.N | Mean (SD) | 0.53 (0.79) |
| N | ||
| N0 | 96 | |
| N1 | 40 | |
| N2 | 13 | |
| N3 | 5 | |
| Significant markers | N = 0 |
Table S10. Basic characteristics of clinical feature: 'PATHOLOGICSPREAD(M)'
| PATHOLOGICSPREAD(M) | Labels | N |
| M0 | 146 | |
| M1 | 4 | |
| Significant markers | N = 16 | |
| Higher in M1 | 7 | |
| Higher in M0 | 9 |
Table S11. Get Full Table List of top 10 genes differentially expressed by 'PATHOLOGICSPREAD(M)'
| T(pos if higher in 'M1') | ttestP | Q | AUC | |
|---|---|---|---|---|
| NSD1 | -10.68 | 2.372e-19 | 4.23e-15 | 0.8134 |
| C7ORF30 | 8.4 | 4.367e-14 | 7.78e-10 | 0.7911 |
| RGPD5 | -11.89 | 2.11e-13 | 3.76e-09 | 0.8887 |
| GPR97 | 8.41 | 1.576e-10 | 2.81e-06 | 0.8185 |
| CD274 | -9.15 | 2.145e-09 | 3.82e-05 | 0.8168 |
| C3ORF26 | 8.79 | 1.87e-08 | 0.000333 | 0.8288 |
| KRT24 | -5.93 | 5.731e-08 | 0.00102 | 0.5873 |
| DEFB103A | -8.41 | 2.299e-07 | 0.00409 | 0.7877 |
| POPDC2 | 5.46 | 2.591e-07 | 0.00461 | 0.7038 |
| PON3 | 6.62 | 3.57e-07 | 0.00636 | 0.7774 |
Figure S3. Get High-res Image As an example, this figure shows the association of NSD1 to 'PATHOLOGICSPREAD(M)'. P value = 2.37e-19 with T-test analysis.
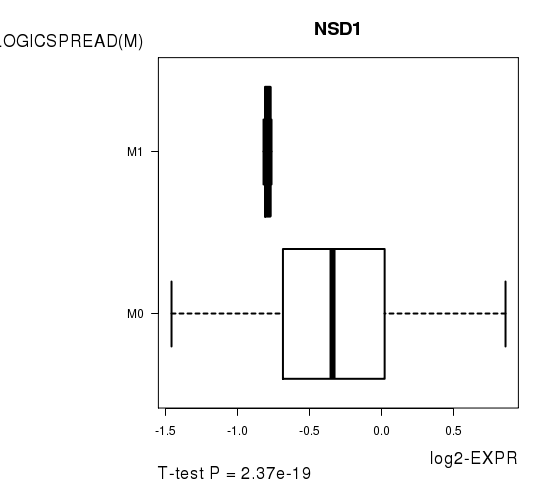
Table S12. Basic characteristics of clinical feature: 'NEOADJUVANT.THERAPY'
| NEOADJUVANT.THERAPY | Labels | N |
| NO | 13 | |
| YES | 141 | |
| Significant markers | N = 2 | |
| Higher in YES | 1 | |
| Higher in NO | 1 |
Table S13. Get Full Table List of 2 genes differentially expressed by 'NEOADJUVANT.THERAPY'
| T(pos if higher in 'YES') | ttestP | Q | AUC | |
|---|---|---|---|---|
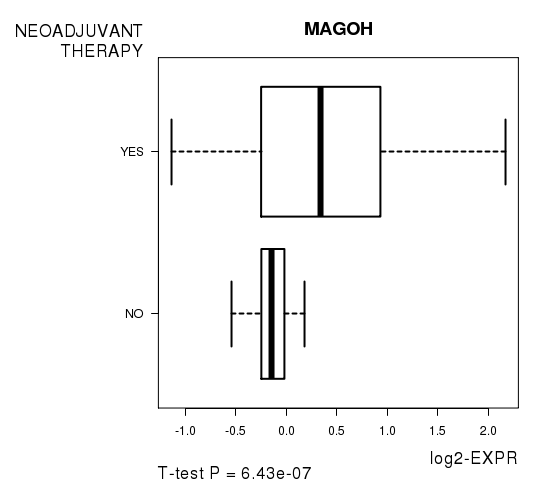
| MAGOH | 5.84 | 6.435e-07 | 0.0115 | 0.7141 |
| HEATR5B | -5.59 | 1.136e-06 | 0.0202 | 0.773 |
Figure S4. Get High-res Image As an example, this figure shows the association of MAGOH to 'NEOADJUVANT.THERAPY'. P value = 6.43e-07 with T-test analysis.
-
Expresson data file = LUSC.medianexp.txt
-
Clinical data file = LUSC.clin.merged.picked.txt
-
Number of patients = 154
-
Number of genes = 17814
-
Number of clinical features = 9
For survival clinical features, Wald's test in univariate Cox regression analysis with proportional hazards model (Andersen and Gill 1982) was used to estimate the P values using the 'coxph' function in R. Kaplan-Meier survival curves were plot using the four quartile subgroups of patients based on expression levels
For continuous numerical clinical features, Spearman's rank correlation coefficients (Spearman 1904) and two-tailed P values were estimated using 'cor.test' function in R
For two-class clinical features, two-tailed Student's t test with unequal variance (Lehmann and Romano 2005) was applied to compare the log2-expression levels between the two clinical classes using 't.test' function in R
For multi-class clinical features (ordinal or nominal), one-way analysis of variance (Howell 2002) was applied to compare the log2-expression levels between different clinical classes using 'anova' function in R
For multiple hypothesis correction, Q value is the False Discovery Rate (FDR) analogue of the P value (Benjamini and Hochberg 1995), defined as the minimum FDR at which the test may be called significant. We used the 'Benjamini and Hochberg' method of 'p.adjust' function in R to convert P values into Q values.
This is an experimental feature. The full results of the analysis summarized in this report can be downloaded from the TCGA Data Coordination Center.