This pipeline computes the correlation between cancer subtypes identified by different molecular patterns and selected clinical features.
Testing the association between subtypes identified by 7 different clustering approaches and 10 clinical features across 278 patients, 13 significant findings detected with P value < 0.05.
-
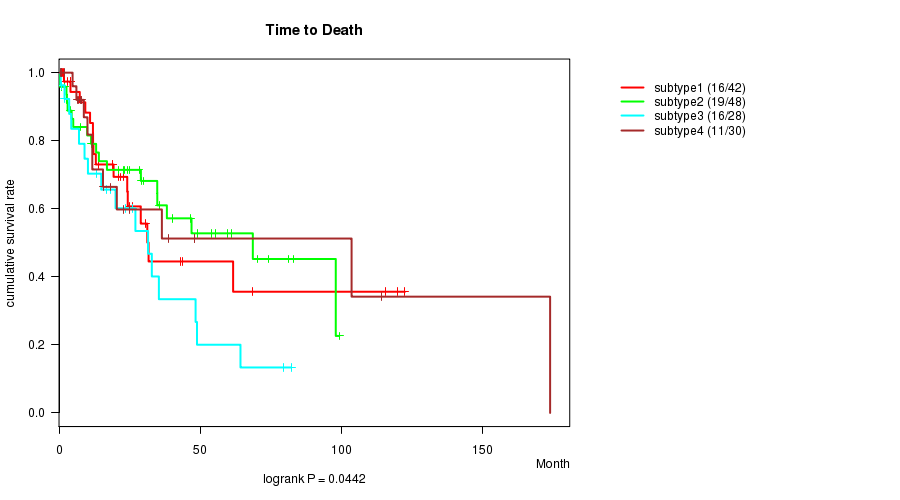
CNMF clustering analysis on array-based mRNA expression data identified 4 subtypes that correlate to 'Time to Death' and 'PATHOLOGY.T'.
-
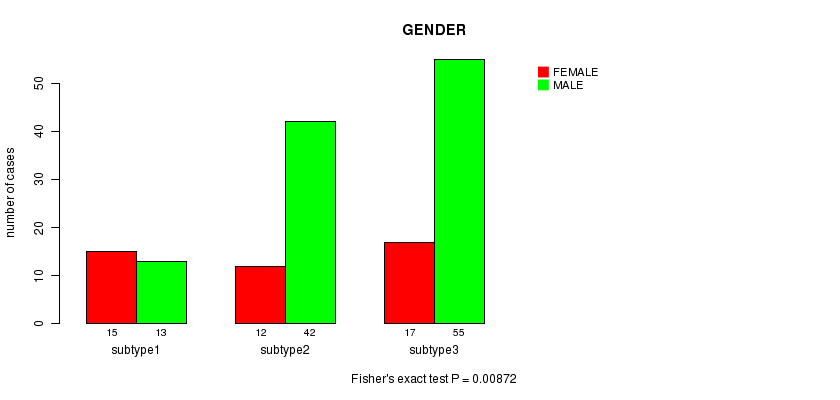
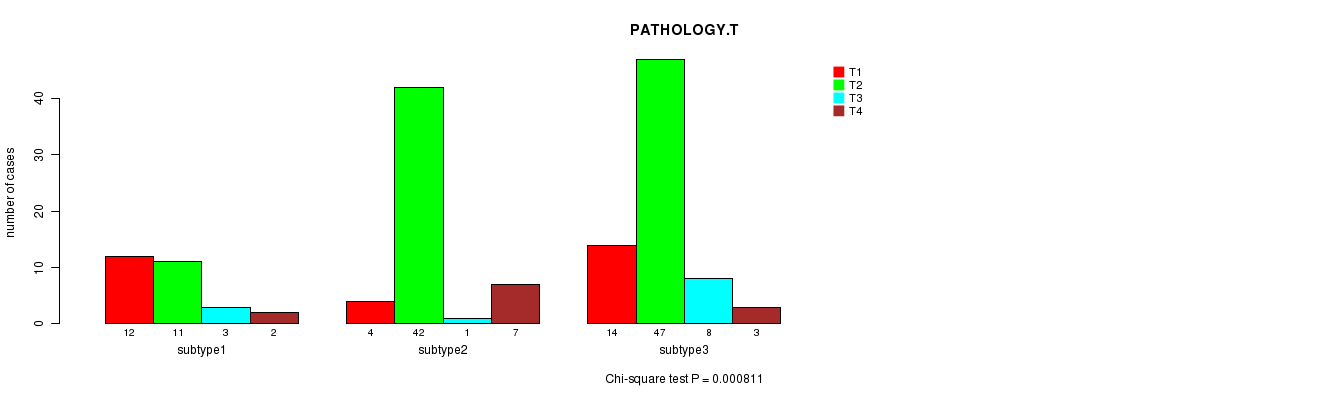
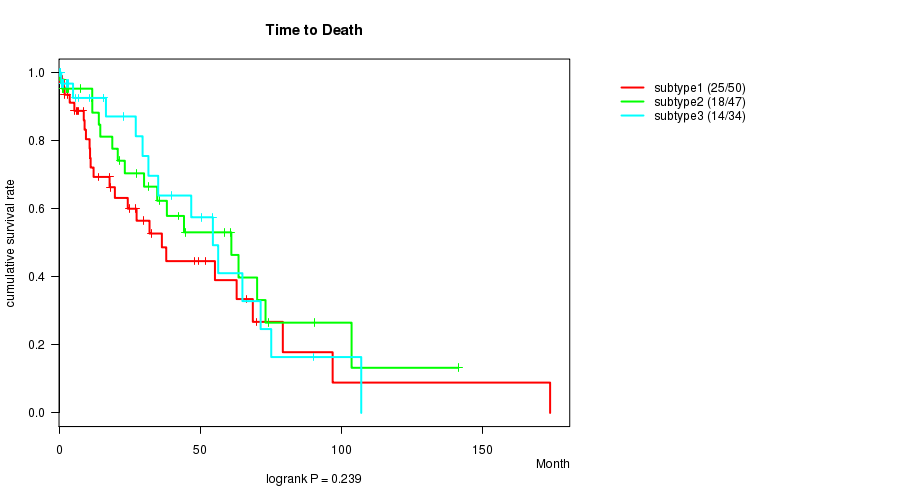
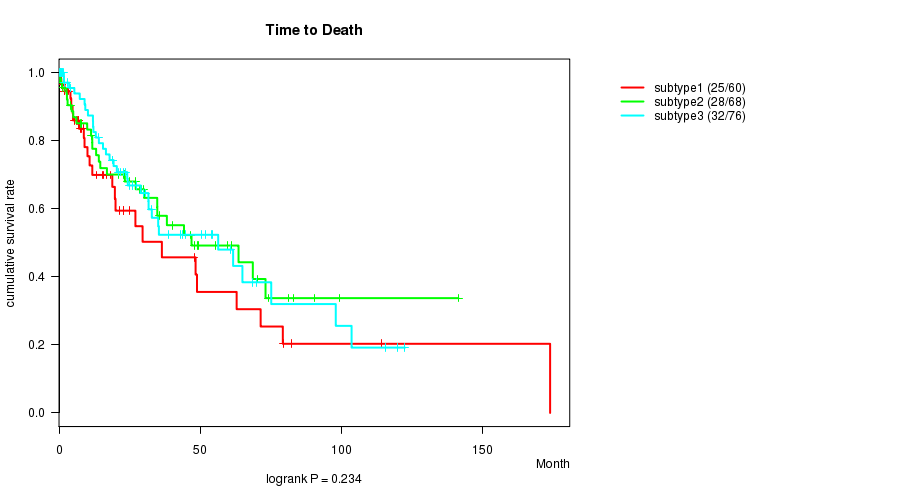
Consensus hierarchical clustering analysis on array-based mRNA expression data identified 3 subtypes that correlate to 'Time to Death', 'GENDER', and 'PATHOLOGY.T'.
-
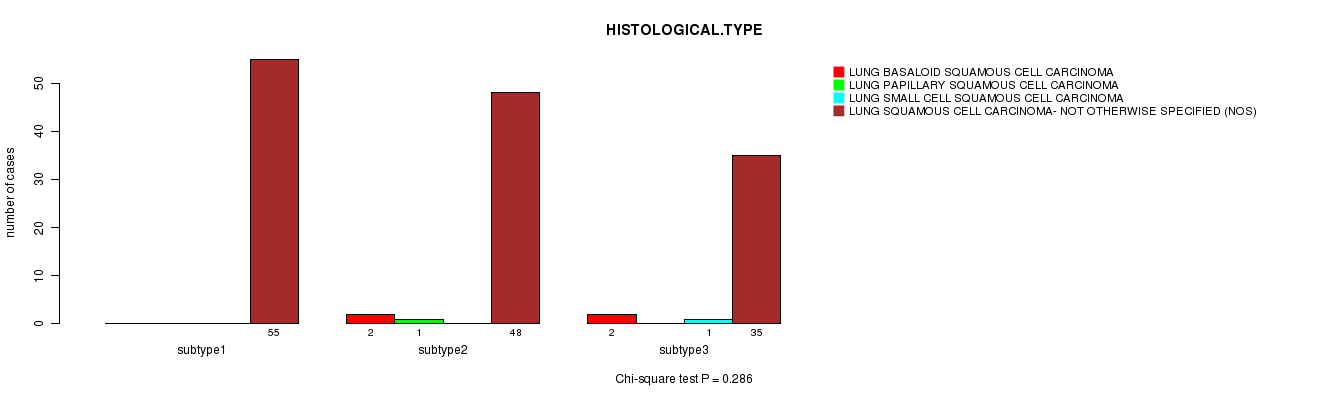
3 subtypes identified in current cancer cohort by 'METHLYATION CNMF'. These subtypes do not correlate to any clinical features.
-
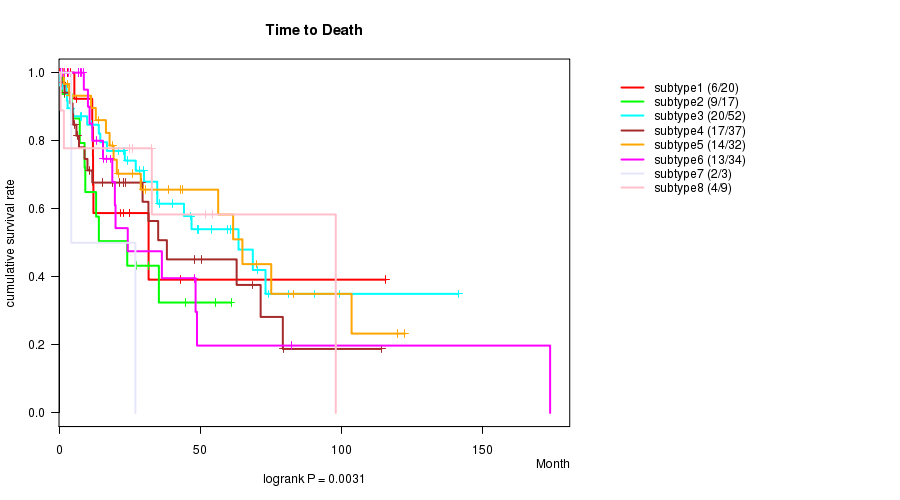
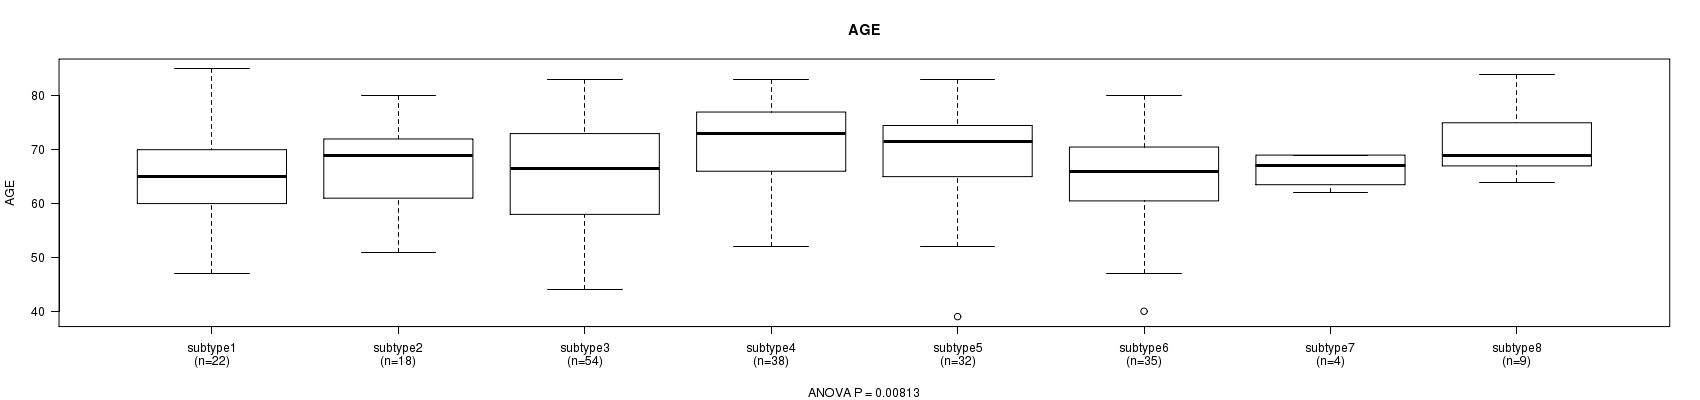
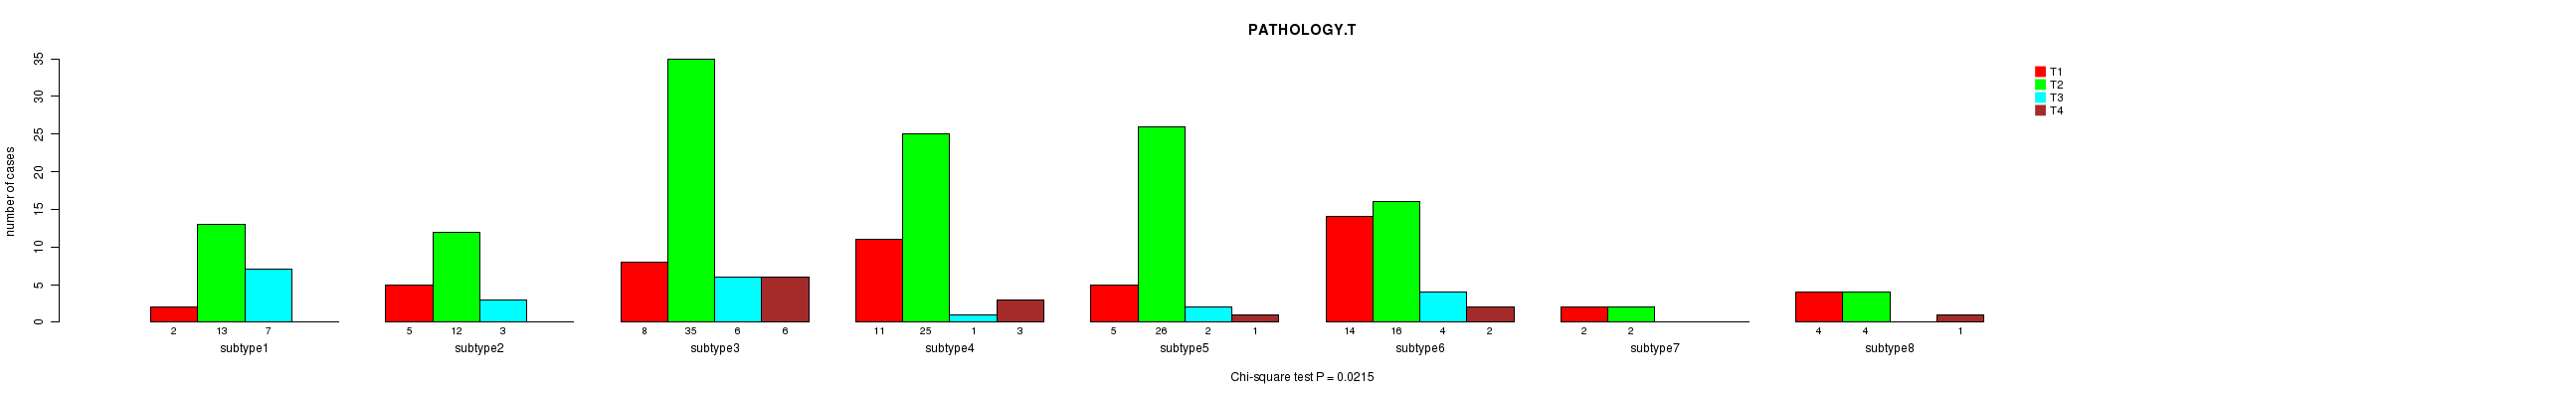
CNMF clustering analysis on sequencing-based mRNA expression data identified 8 subtypes that correlate to 'Time to Death', 'AGE', and 'PATHOLOGY.T'.
-
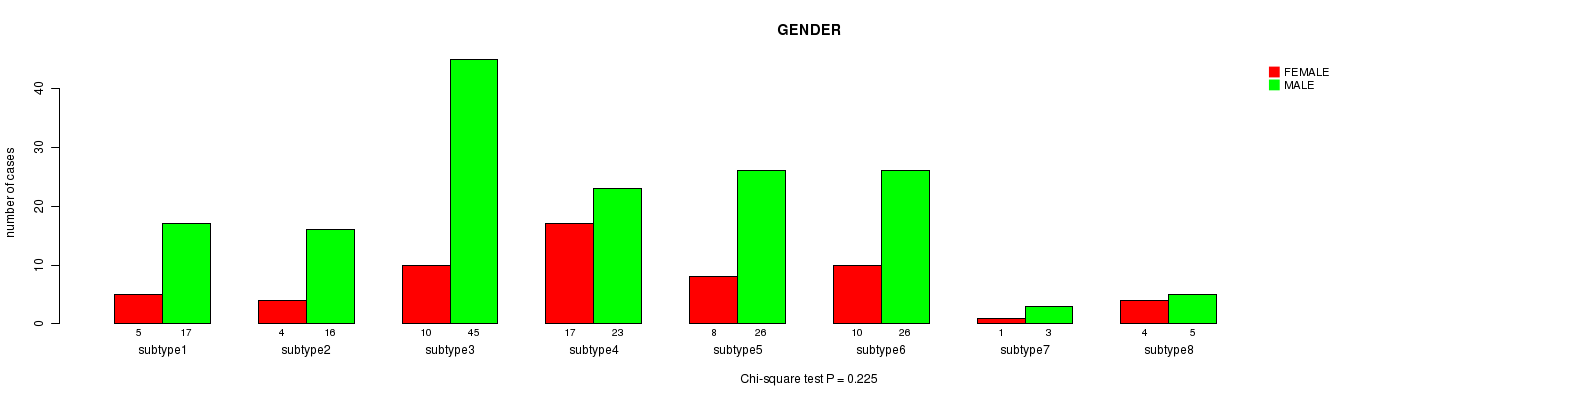
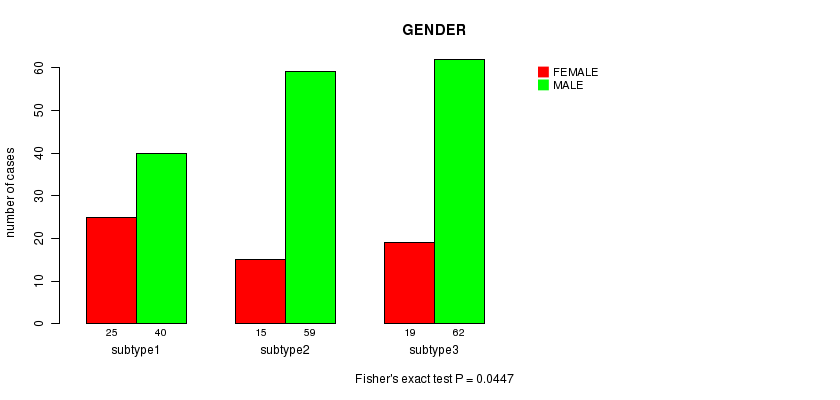
Consensus hierarchical clustering analysis on sequencing-based mRNA expression data identified 3 subtypes that correlate to 'GENDER'.
-
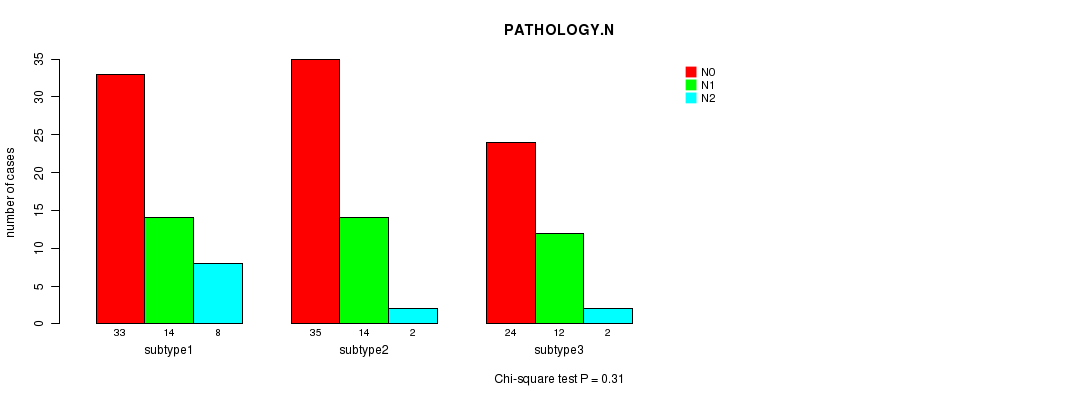
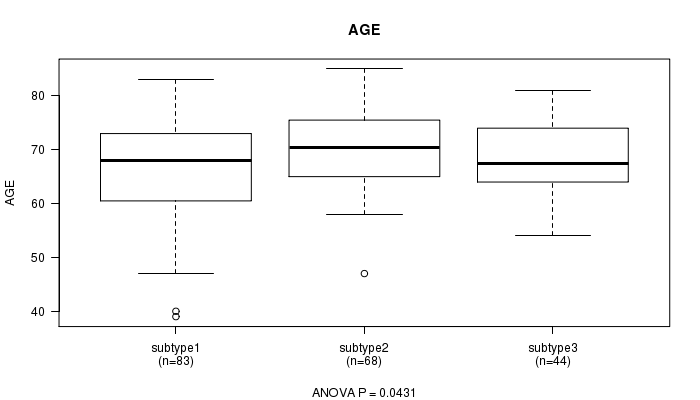
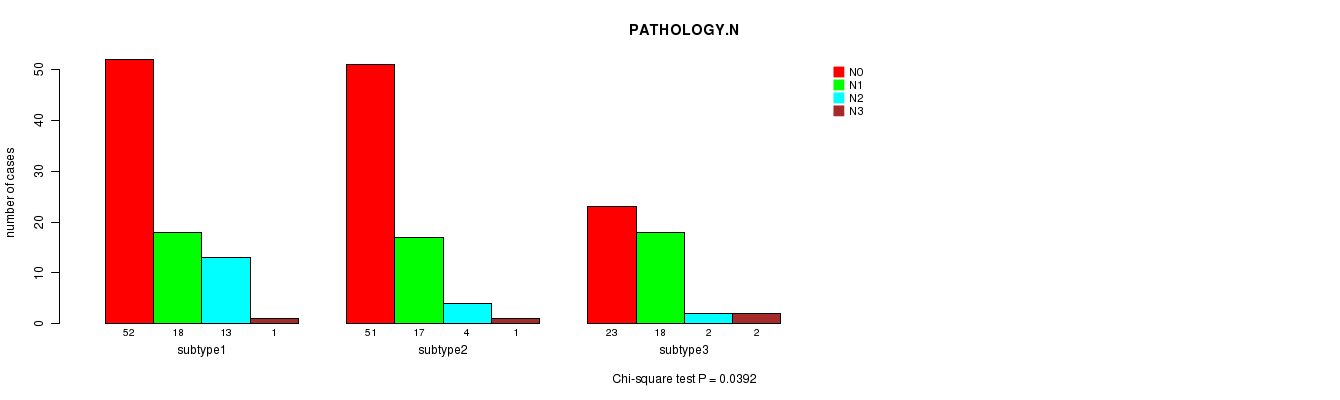
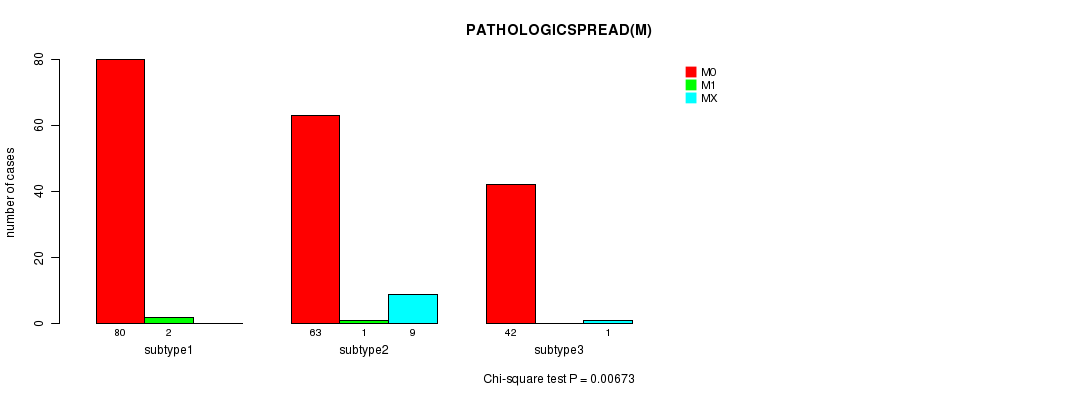
CNMF clustering analysis on sequencing-based miR expression data identified 3 subtypes that correlate to 'AGE', 'PATHOLOGY.N', and 'PATHOLOGICSPREAD(M)'.
-
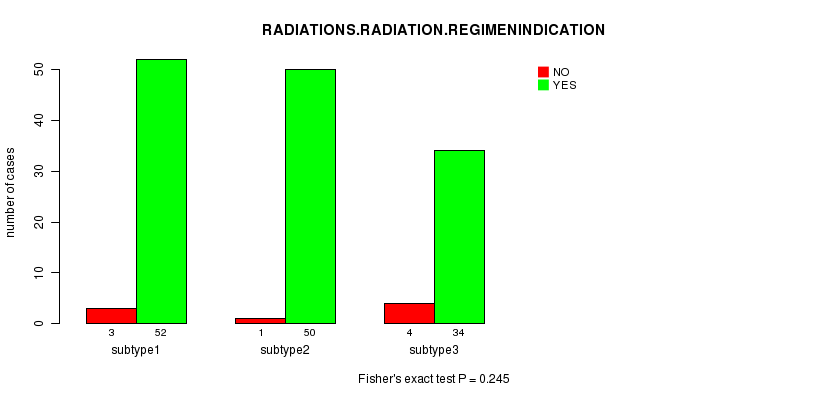
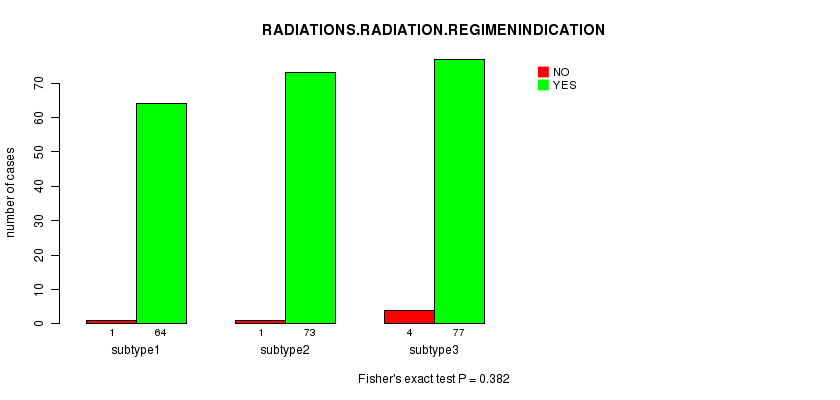
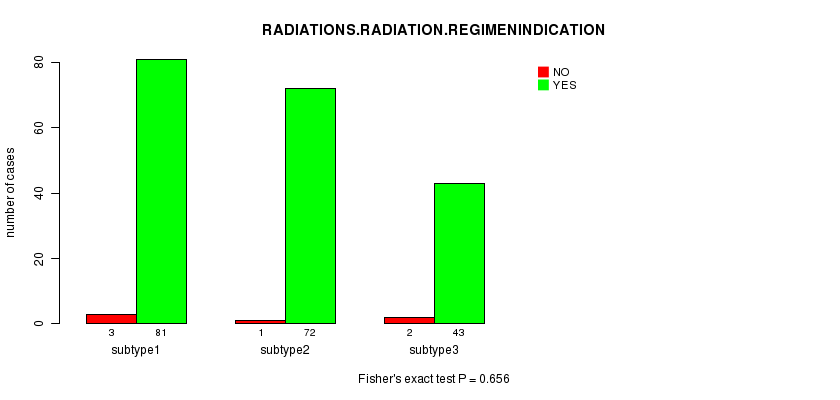
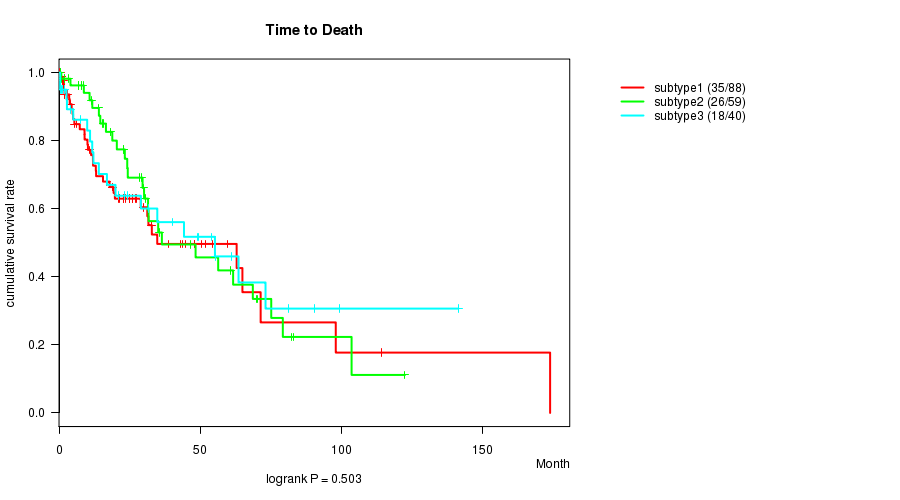
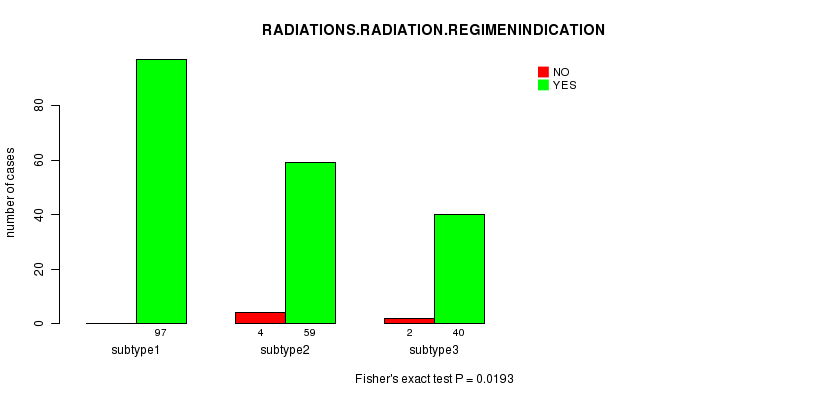
Consensus hierarchical clustering analysis on sequencing-based miR expression data identified 3 subtypes that correlate to 'RADIATIONS.RADIATION.REGIMENINDICATION'.
Table 1. Get Full Table Overview of the association between subtypes identified by 7 different clustering approaches and 10 clinical features. Shown in the table are P values from statistical tests. Thresholded by P value < 0.05, 13 significant findings detected.
|
Clinical Features |
Statistical Tests |
mRNA CNMF subtypes |
mRNA cHierClus subtypes |
METHLYATION CNMF |
RNAseq CNMF subtypes |
RNAseq cHierClus subtypes |
MIRseq CNMF subtypes |
MIRseq cHierClus subtypes |
| Time to Death | logrank test | 0.0442 | 0.0312 | 0.239 | 0.0031 | 0.234 | 0.601 | 0.503 |
| AGE | ANOVA | 0.546 | 0.168 | 0.354 | 0.00813 | 0.443 | 0.0431 | 0.897 |
| GENDER | Fisher's exact test | 0.382 | 0.00872 | 0.843 | 0.225 | 0.0447 | 0.654 | 0.353 |
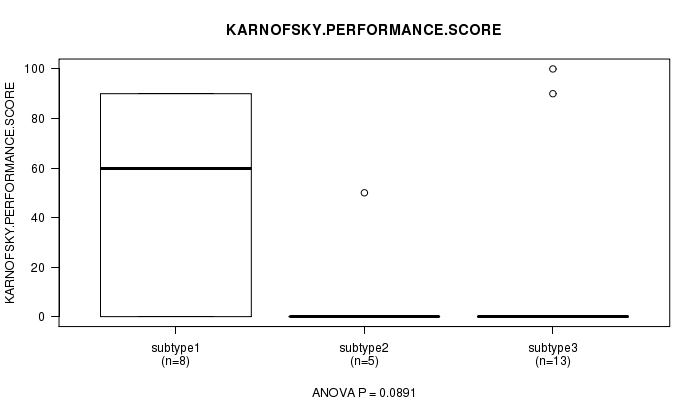
| KARNOFSKY PERFORMANCE SCORE | ANOVA | 0.191 | 0.0891 | 0.533 | 0.543 | 0.429 | 0.421 | 0.4 |
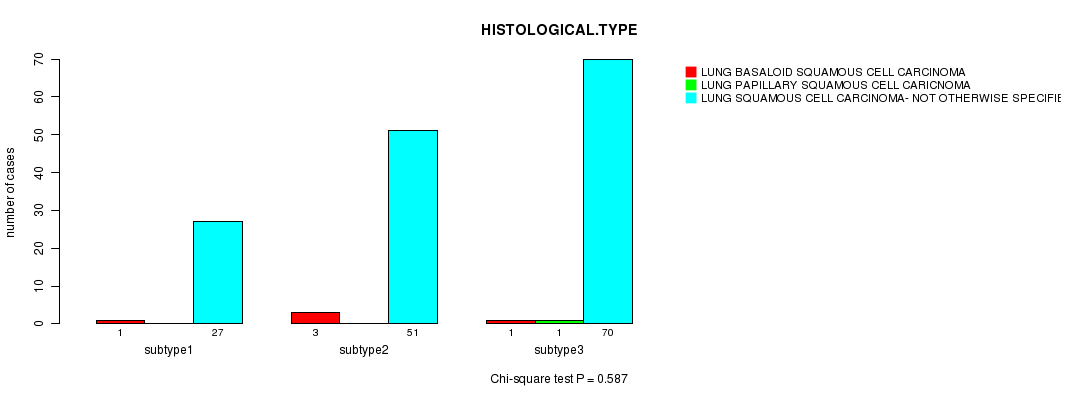
| HISTOLOGICAL TYPE | Chi-square test | 0.355 | 0.587 | 0.286 | 0.897 | 0.294 | 0.412 | 0.401 |
| PATHOLOGY T | Chi-square test | 0.0029 | 0.000811 | 0.375 | 0.0215 | 0.364 | 0.683 | 0.329 |
| PATHOLOGY N | Chi-square test | 0.818 | 0.32 | 0.31 | 0.673 | 0.9 | 0.0392 | 0.061 |
| PATHOLOGICSPREAD(M) | Chi-square test | 0.146 | 0.323 | 0.53 | 0.0795 | 0.655 | 0.00673 | 0.205 |
| RADIATIONS RADIATION REGIMENINDICATION | Fisher's exact test | 0.445 | 0.453 | 0.245 | 0.399 | 0.382 | 0.656 | 0.0193 |
| NEOADJUVANT THERAPY | Fisher's exact test | 0.734 | 0.799 | 0.668 | 0.246 | 0.958 | 0.748 | 0.571 |
Table S1. Get Full Table Description of clustering approach #1: 'mRNA CNMF subtypes'
| Cluster Labels | 1 | 2 | 3 | 4 |
|---|---|---|---|---|
| Number of samples | 43 | 50 | 30 | 31 |
P value = 0.0442 (logrank test)
Table S2. Clustering Approach #1: 'mRNA CNMF subtypes' versus Clinical Feature #1: 'Time to Death'
| nPatients | nDeath | Duration Range (Median), Month | |
|---|---|---|---|
| ALL | 148 | 62 | 0.4 - 173.8 (18.2) |
| subtype1 | 42 | 16 | 0.4 - 122.4 (19.0) |
| subtype2 | 48 | 19 | 0.4 - 99.2 (24.5) |
| subtype3 | 28 | 16 | 0.4 - 82.2 (15.9) |
| subtype4 | 30 | 11 | 0.4 - 173.8 (11.8) |
Figure S1. Get High-res Image Clustering Approach #1: 'mRNA CNMF subtypes' versus Clinical Feature #1: 'Time to Death'
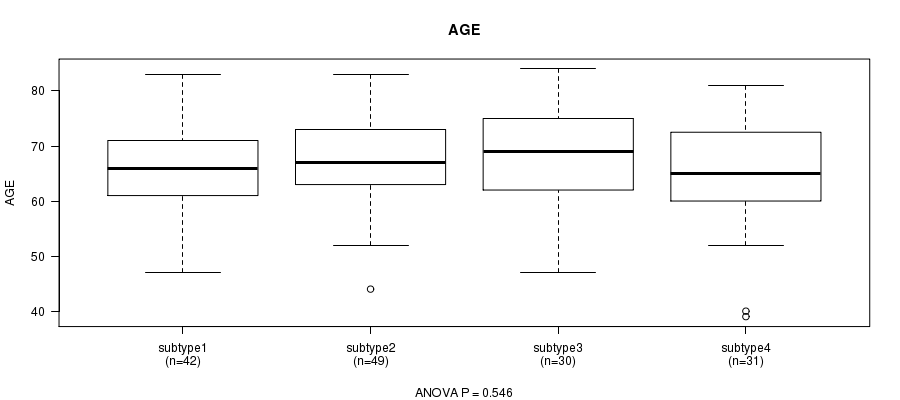
P value = 0.546 (ANOVA)
Table S3. Clustering Approach #1: 'mRNA CNMF subtypes' versus Clinical Feature #2: 'AGE'
| nPatients | Mean (Std.Dev) | |
|---|---|---|
| ALL | 152 | 66.5 (8.6) |
| subtype1 | 42 | 66.3 (7.6) |
| subtype2 | 49 | 66.6 (8.4) |
| subtype3 | 30 | 68.2 (8.6) |
| subtype4 | 31 | 65.0 (10.1) |
Figure S2. Get High-res Image Clustering Approach #1: 'mRNA CNMF subtypes' versus Clinical Feature #2: 'AGE'
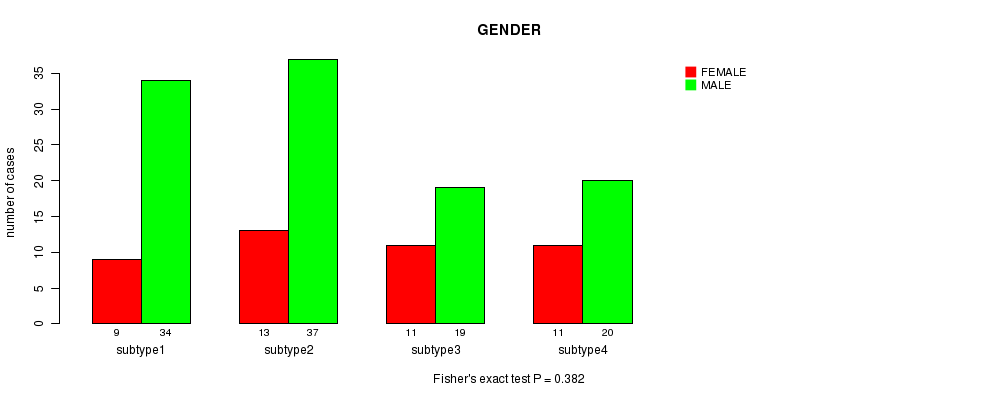
P value = 0.382 (Fisher's exact test)
Table S4. Clustering Approach #1: 'mRNA CNMF subtypes' versus Clinical Feature #3: 'GENDER'
| nPatients | FEMALE | MALE |
|---|---|---|
| ALL | 110 | 44 |
| subtype1 | 34 | 9 |
| subtype2 | 37 | 13 |
| subtype3 | 19 | 11 |
| subtype4 | 20 | 11 |
Figure S3. Get High-res Image Clustering Approach #1: 'mRNA CNMF subtypes' versus Clinical Feature #3: 'GENDER'
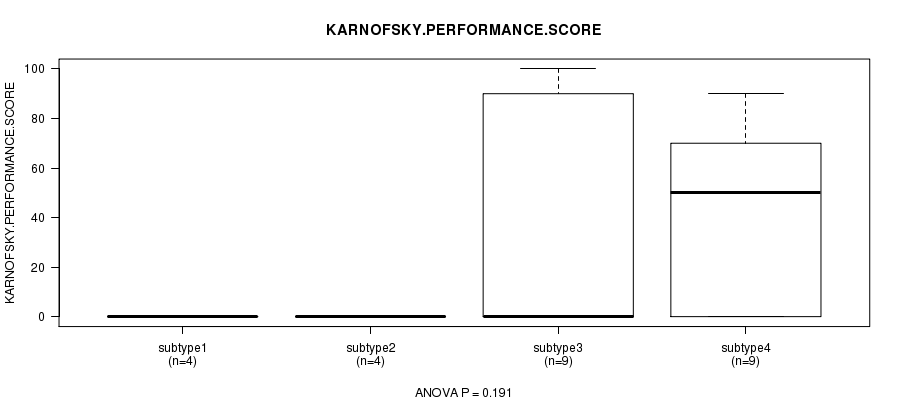
P value = 0.191 (ANOVA)
Table S5. Clustering Approach #1: 'mRNA CNMF subtypes' versus Clinical Feature #4: 'KARNOFSKY.PERFORMANCE.SCORE'
| nPatients | Mean (Std.Dev) | |
|---|---|---|
| ALL | 26 | 24.2 (38.5) |
| subtype1 | 4 | 0.0 (0.0) |
| subtype2 | 4 | 0.0 (0.0) |
| subtype3 | 9 | 31.1 (46.8) |
| subtype4 | 9 | 38.9 (39.5) |
Figure S4. Get High-res Image Clustering Approach #1: 'mRNA CNMF subtypes' versus Clinical Feature #4: 'KARNOFSKY.PERFORMANCE.SCORE'
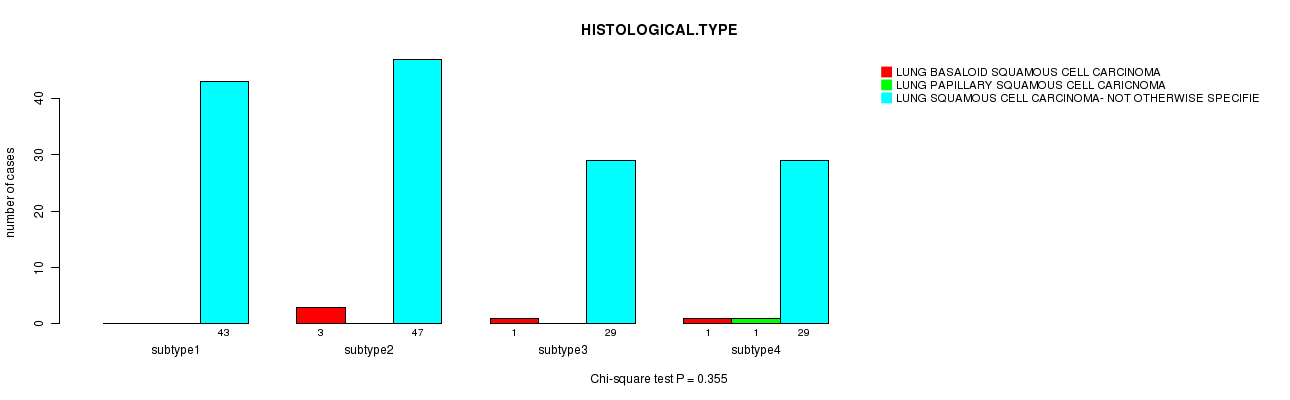
P value = 0.355 (Chi-square test)
Table S6. Clustering Approach #1: 'mRNA CNMF subtypes' versus Clinical Feature #5: 'HISTOLOGICAL.TYPE'
| nPatients | LUNG BASALOID SQUAMOUS CELL CARCINOMA | LUNG PAPILLARY SQUAMOUS CELL CARICNOMA | LUNG SQUAMOUS CELL CARCINOMA- NOT OTHERWISE SPECIFIED (NOS) |
|---|---|---|---|
| ALL | 5 | 1 | 148 |
| subtype1 | 0 | 0 | 43 |
| subtype2 | 3 | 0 | 47 |
| subtype3 | 1 | 0 | 29 |
| subtype4 | 1 | 1 | 29 |
Figure S5. Get High-res Image Clustering Approach #1: 'mRNA CNMF subtypes' versus Clinical Feature #5: 'HISTOLOGICAL.TYPE'
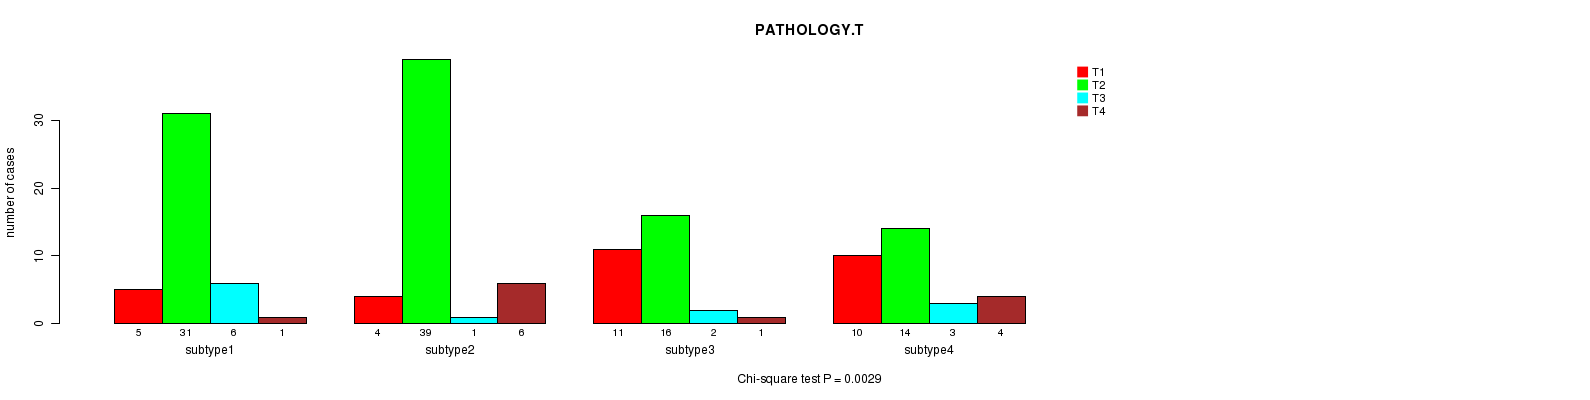
P value = 0.0029 (Chi-square test)
Table S7. Clustering Approach #1: 'mRNA CNMF subtypes' versus Clinical Feature #6: 'PATHOLOGY.T'
| nPatients | T1 | T2 | T3 | T4 |
|---|---|---|---|---|
| ALL | 30 | 100 | 12 | 12 |
| subtype1 | 5 | 31 | 6 | 1 |
| subtype2 | 4 | 39 | 1 | 6 |
| subtype3 | 11 | 16 | 2 | 1 |
| subtype4 | 10 | 14 | 3 | 4 |
Figure S6. Get High-res Image Clustering Approach #1: 'mRNA CNMF subtypes' versus Clinical Feature #6: 'PATHOLOGY.T'
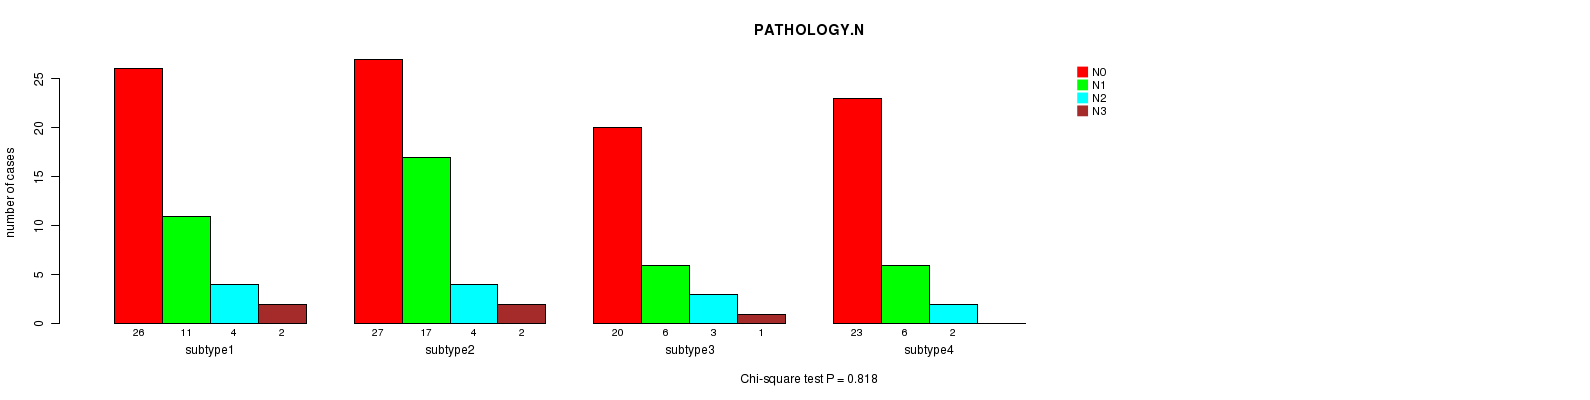
P value = 0.818 (Chi-square test)
Table S8. Clustering Approach #1: 'mRNA CNMF subtypes' versus Clinical Feature #7: 'PATHOLOGY.N'
| nPatients | N0 | N1 | N2 | N3 |
|---|---|---|---|---|
| ALL | 96 | 40 | 13 | 5 |
| subtype1 | 26 | 11 | 4 | 2 |
| subtype2 | 27 | 17 | 4 | 2 |
| subtype3 | 20 | 6 | 3 | 1 |
| subtype4 | 23 | 6 | 2 | 0 |
Figure S7. Get High-res Image Clustering Approach #1: 'mRNA CNMF subtypes' versus Clinical Feature #7: 'PATHOLOGY.N'
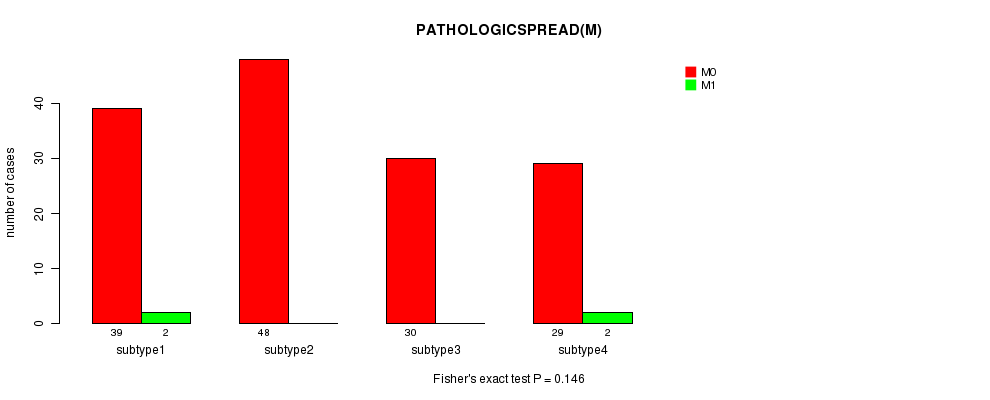
P value = 0.146 (Fisher's exact test)
Table S9. Clustering Approach #1: 'mRNA CNMF subtypes' versus Clinical Feature #8: 'PATHOLOGICSPREAD(M)'
| nPatients | M0 | M1 |
|---|---|---|
| ALL | 146 | 4 |
| subtype1 | 39 | 2 |
| subtype2 | 48 | 0 |
| subtype3 | 30 | 0 |
| subtype4 | 29 | 2 |
Figure S8. Get High-res Image Clustering Approach #1: 'mRNA CNMF subtypes' versus Clinical Feature #8: 'PATHOLOGICSPREAD(M)'
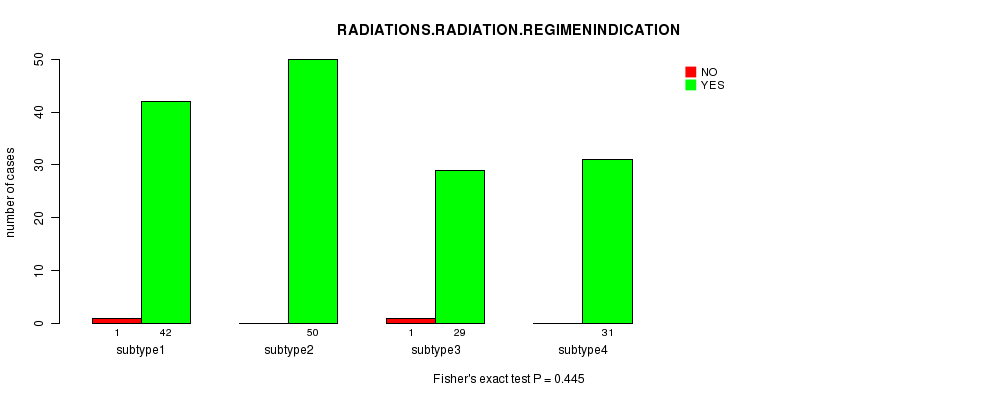
P value = 0.445 (Fisher's exact test)
Table S10. Clustering Approach #1: 'mRNA CNMF subtypes' versus Clinical Feature #9: 'RADIATIONS.RADIATION.REGIMENINDICATION'
| nPatients | NO | YES |
|---|---|---|
| ALL | 152 | 2 |
| subtype1 | 42 | 1 |
| subtype2 | 50 | 0 |
| subtype3 | 29 | 1 |
| subtype4 | 31 | 0 |
Figure S9. Get High-res Image Clustering Approach #1: 'mRNA CNMF subtypes' versus Clinical Feature #9: 'RADIATIONS.RADIATION.REGIMENINDICATION'
P value = 0.734 (Fisher's exact test)
Table S11. Clustering Approach #1: 'mRNA CNMF subtypes' versus Clinical Feature #10: 'NEOADJUVANT.THERAPY'
| nPatients | NO | YES |
|---|---|---|
| ALL | 141 | 13 |
| subtype1 | 39 | 4 |
| subtype2 | 45 | 5 |
| subtype3 | 27 | 3 |
| subtype4 | 30 | 1 |
Figure S10. Get High-res Image Clustering Approach #1: 'mRNA CNMF subtypes' versus Clinical Feature #10: 'NEOADJUVANT.THERAPY'
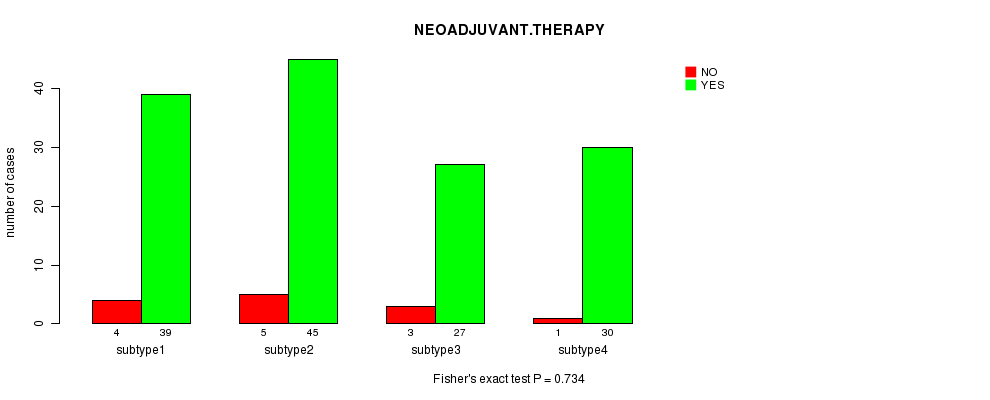
Table S12. Get Full Table Description of clustering approach #2: 'mRNA cHierClus subtypes'
| Cluster Labels | 1 | 2 | 3 |
|---|---|---|---|
| Number of samples | 28 | 54 | 72 |
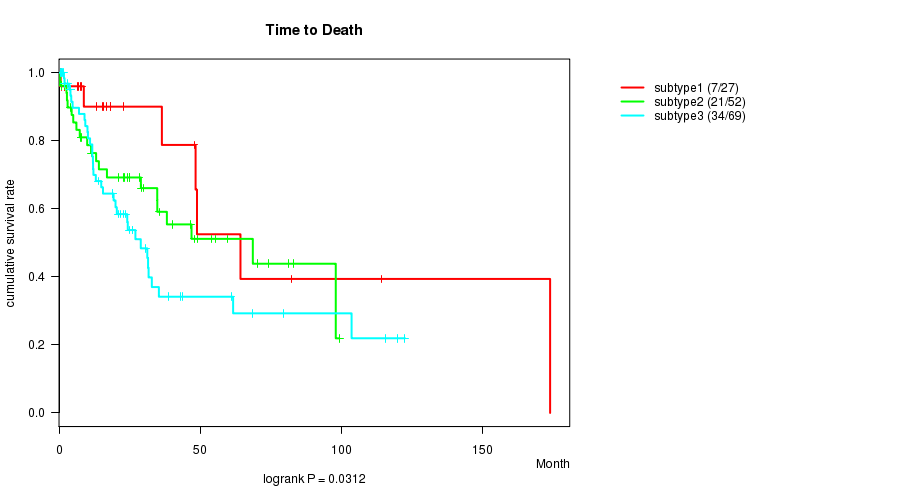
P value = 0.0312 (logrank test)
Table S13. Clustering Approach #2: 'mRNA cHierClus subtypes' versus Clinical Feature #1: 'Time to Death'
| nPatients | nDeath | Duration Range (Median), Month | |
|---|---|---|---|
| ALL | 148 | 62 | 0.4 - 173.8 (18.2) |
| subtype1 | 27 | 7 | 0.4 - 173.8 (15.6) |
| subtype2 | 52 | 21 | 0.4 - 99.2 (23.6) |
| subtype3 | 69 | 34 | 0.4 - 122.4 (18.8) |
Figure S11. Get High-res Image Clustering Approach #2: 'mRNA cHierClus subtypes' versus Clinical Feature #1: 'Time to Death'
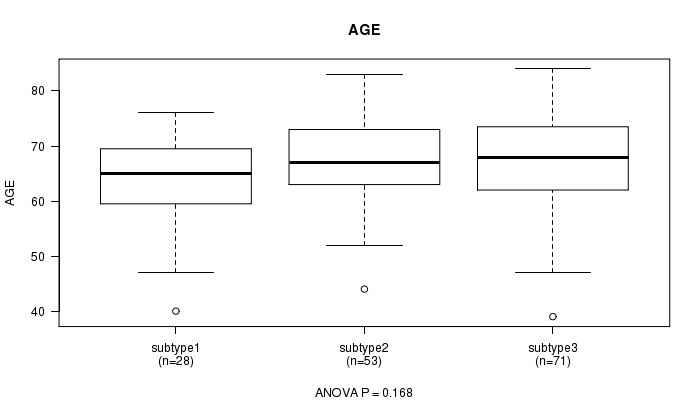
P value = 0.168 (ANOVA)
Table S14. Clustering Approach #2: 'mRNA cHierClus subtypes' versus Clinical Feature #2: 'AGE'
| nPatients | Mean (Std.Dev) | |
|---|---|---|
| ALL | 152 | 66.5 (8.6) |
| subtype1 | 28 | 63.9 (8.4) |
| subtype2 | 53 | 66.5 (7.9) |
| subtype3 | 71 | 67.5 (9.0) |
Figure S12. Get High-res Image Clustering Approach #2: 'mRNA cHierClus subtypes' versus Clinical Feature #2: 'AGE'
P value = 0.00872 (Fisher's exact test)
Table S15. Clustering Approach #2: 'mRNA cHierClus subtypes' versus Clinical Feature #3: 'GENDER'
| nPatients | FEMALE | MALE |
|---|---|---|
| ALL | 110 | 44 |
| subtype1 | 13 | 15 |
| subtype2 | 42 | 12 |
| subtype3 | 55 | 17 |
Figure S13. Get High-res Image Clustering Approach #2: 'mRNA cHierClus subtypes' versus Clinical Feature #3: 'GENDER'
P value = 0.0891 (ANOVA)
Table S16. Clustering Approach #2: 'mRNA cHierClus subtypes' versus Clinical Feature #4: 'KARNOFSKY.PERFORMANCE.SCORE'
| nPatients | Mean (Std.Dev) | |
|---|---|---|
| ALL | 26 | 24.2 (38.5) |
| subtype1 | 8 | 48.8 (42.6) |
| subtype2 | 5 | 10.0 (22.4) |
| subtype3 | 13 | 14.6 (35.7) |
Figure S14. Get High-res Image Clustering Approach #2: 'mRNA cHierClus subtypes' versus Clinical Feature #4: 'KARNOFSKY.PERFORMANCE.SCORE'
P value = 0.587 (Chi-square test)
Table S17. Clustering Approach #2: 'mRNA cHierClus subtypes' versus Clinical Feature #5: 'HISTOLOGICAL.TYPE'
| nPatients | LUNG BASALOID SQUAMOUS CELL CARCINOMA | LUNG PAPILLARY SQUAMOUS CELL CARICNOMA | LUNG SQUAMOUS CELL CARCINOMA- NOT OTHERWISE SPECIFIED (NOS) |
|---|---|---|---|
| ALL | 5 | 1 | 148 |
| subtype1 | 1 | 0 | 27 |
| subtype2 | 3 | 0 | 51 |
| subtype3 | 1 | 1 | 70 |
Figure S15. Get High-res Image Clustering Approach #2: 'mRNA cHierClus subtypes' versus Clinical Feature #5: 'HISTOLOGICAL.TYPE'
P value = 0.000811 (Chi-square test)
Table S18. Clustering Approach #2: 'mRNA cHierClus subtypes' versus Clinical Feature #6: 'PATHOLOGY.T'
| nPatients | T1 | T2 | T3 | T4 |
|---|---|---|---|---|
| ALL | 30 | 100 | 12 | 12 |
| subtype1 | 12 | 11 | 3 | 2 |
| subtype2 | 4 | 42 | 1 | 7 |
| subtype3 | 14 | 47 | 8 | 3 |
Figure S16. Get High-res Image Clustering Approach #2: 'mRNA cHierClus subtypes' versus Clinical Feature #6: 'PATHOLOGY.T'
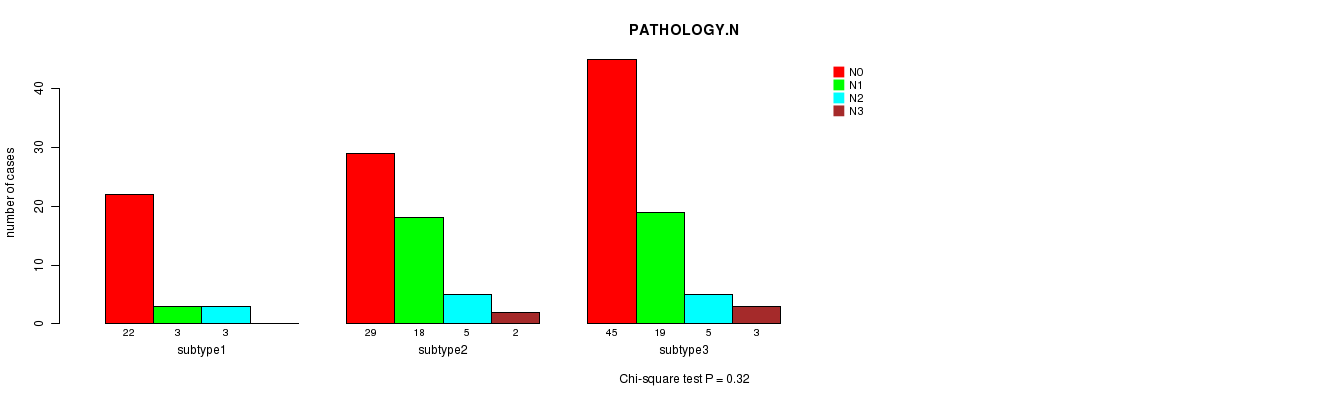
P value = 0.32 (Chi-square test)
Table S19. Clustering Approach #2: 'mRNA cHierClus subtypes' versus Clinical Feature #7: 'PATHOLOGY.N'
| nPatients | N0 | N1 | N2 | N3 |
|---|---|---|---|---|
| ALL | 96 | 40 | 13 | 5 |
| subtype1 | 22 | 3 | 3 | 0 |
| subtype2 | 29 | 18 | 5 | 2 |
| subtype3 | 45 | 19 | 5 | 3 |
Figure S17. Get High-res Image Clustering Approach #2: 'mRNA cHierClus subtypes' versus Clinical Feature #7: 'PATHOLOGY.N'
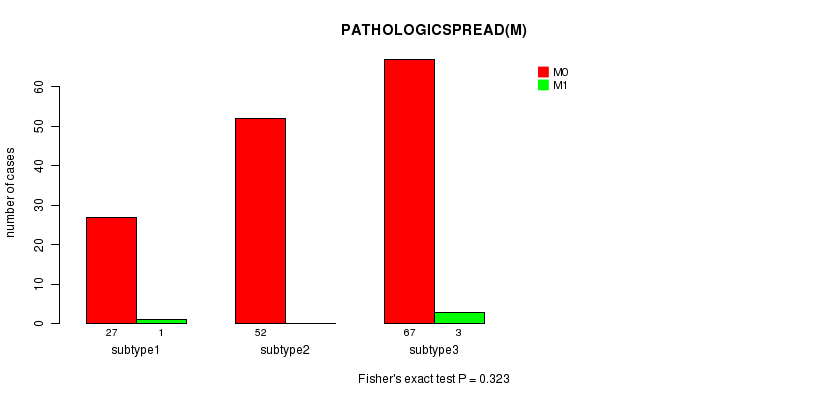
P value = 0.323 (Fisher's exact test)
Table S20. Clustering Approach #2: 'mRNA cHierClus subtypes' versus Clinical Feature #8: 'PATHOLOGICSPREAD(M)'
| nPatients | M0 | M1 |
|---|---|---|
| ALL | 146 | 4 |
| subtype1 | 27 | 1 |
| subtype2 | 52 | 0 |
| subtype3 | 67 | 3 |
Figure S18. Get High-res Image Clustering Approach #2: 'mRNA cHierClus subtypes' versus Clinical Feature #8: 'PATHOLOGICSPREAD(M)'
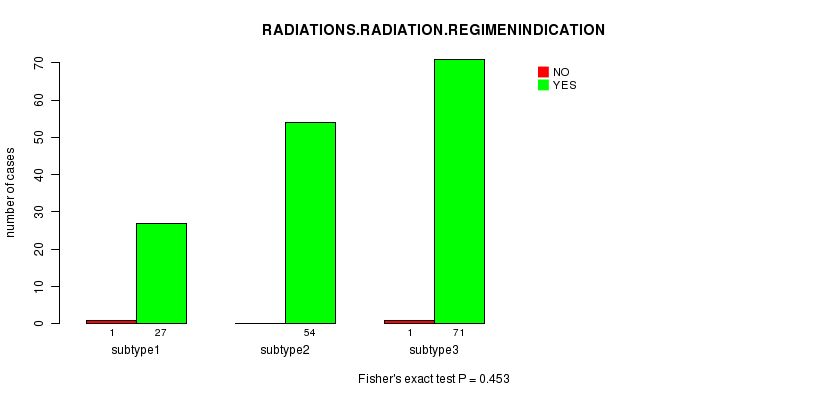
P value = 0.453 (Fisher's exact test)
Table S21. Clustering Approach #2: 'mRNA cHierClus subtypes' versus Clinical Feature #9: 'RADIATIONS.RADIATION.REGIMENINDICATION'
| nPatients | NO | YES |
|---|---|---|
| ALL | 152 | 2 |
| subtype1 | 27 | 1 |
| subtype2 | 54 | 0 |
| subtype3 | 71 | 1 |
Figure S19. Get High-res Image Clustering Approach #2: 'mRNA cHierClus subtypes' versus Clinical Feature #9: 'RADIATIONS.RADIATION.REGIMENINDICATION'
P value = 0.799 (Fisher's exact test)
Table S22. Clustering Approach #2: 'mRNA cHierClus subtypes' versus Clinical Feature #10: 'NEOADJUVANT.THERAPY'
| nPatients | NO | YES |
|---|---|---|
| ALL | 141 | 13 |
| subtype1 | 25 | 3 |
| subtype2 | 49 | 5 |
| subtype3 | 67 | 5 |
Figure S20. Get High-res Image Clustering Approach #2: 'mRNA cHierClus subtypes' versus Clinical Feature #10: 'NEOADJUVANT.THERAPY'
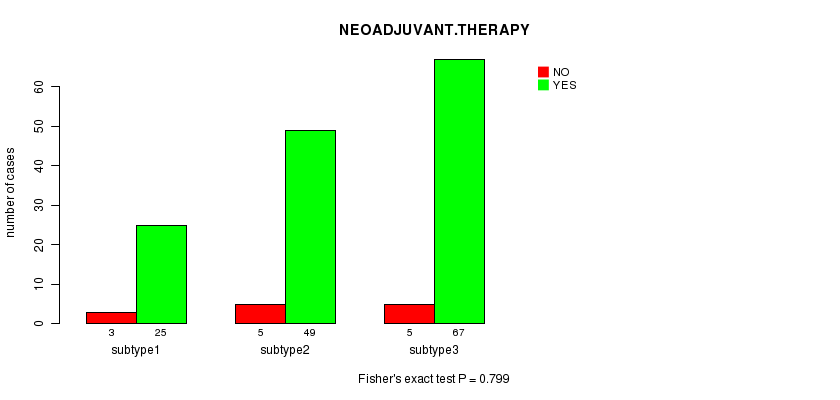
Table S23. Get Full Table Description of clustering approach #3: 'METHLYATION CNMF'
| Cluster Labels | 1 | 2 | 3 |
|---|---|---|---|
| Number of samples | 55 | 51 | 38 |
P value = 0.239 (logrank test)
Table S24. Clustering Approach #3: 'METHLYATION CNMF' versus Clinical Feature #1: 'Time to Death'
| nPatients | nDeath | Duration Range (Median), Month | |
|---|---|---|---|
| ALL | 131 | 57 | 0.0 - 173.8 (15.6) |
| subtype1 | 50 | 25 | 0.1 - 173.8 (13.2) |
| subtype2 | 47 | 18 | 0.2 - 141.3 (14.6) |
| subtype3 | 34 | 14 | 0.0 - 107.0 (16.2) |
Figure S21. Get High-res Image Clustering Approach #3: 'METHLYATION CNMF' versus Clinical Feature #1: 'Time to Death'
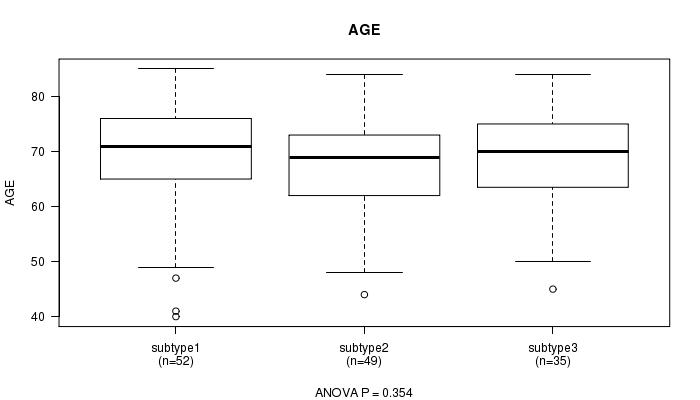
P value = 0.354 (ANOVA)
Table S25. Clustering Approach #3: 'METHLYATION CNMF' versus Clinical Feature #2: 'AGE'
| nPatients | Mean (Std.Dev) | |
|---|---|---|
| ALL | 136 | 68.5 (9.2) |
| subtype1 | 52 | 69.7 (9.7) |
| subtype2 | 49 | 67.1 (8.1) |
| subtype3 | 35 | 68.5 (9.8) |
Figure S22. Get High-res Image Clustering Approach #3: 'METHLYATION CNMF' versus Clinical Feature #2: 'AGE'
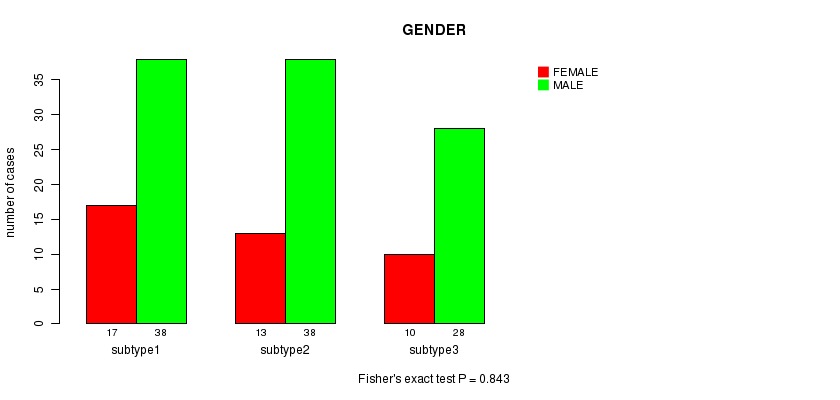
P value = 0.843 (Fisher's exact test)
Table S26. Clustering Approach #3: 'METHLYATION CNMF' versus Clinical Feature #3: 'GENDER'
| nPatients | FEMALE | MALE |
|---|---|---|
| ALL | 104 | 40 |
| subtype1 | 38 | 17 |
| subtype2 | 38 | 13 |
| subtype3 | 28 | 10 |
Figure S23. Get High-res Image Clustering Approach #3: 'METHLYATION CNMF' versus Clinical Feature #3: 'GENDER'
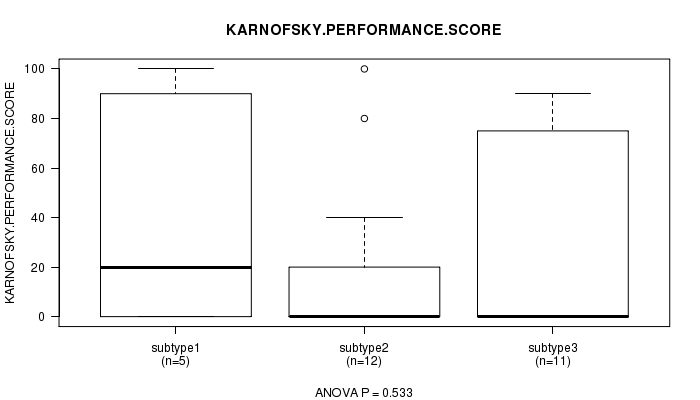
P value = 0.533 (ANOVA)
Table S27. Clustering Approach #3: 'METHLYATION CNMF' versus Clinical Feature #4: 'KARNOFSKY.PERFORMANCE.SCORE'
| nPatients | Mean (Std.Dev) | |
|---|---|---|
| ALL | 28 | 26.8 (39.5) |
| subtype1 | 5 | 42.0 (49.2) |
| subtype2 | 12 | 18.3 (35.6) |
| subtype3 | 11 | 29.1 (40.6) |
Figure S24. Get High-res Image Clustering Approach #3: 'METHLYATION CNMF' versus Clinical Feature #4: 'KARNOFSKY.PERFORMANCE.SCORE'
P value = 0.286 (Chi-square test)
Table S28. Clustering Approach #3: 'METHLYATION CNMF' versus Clinical Feature #5: 'HISTOLOGICAL.TYPE'
| nPatients | LUNG BASALOID SQUAMOUS CELL CARCINOMA | LUNG PAPILLARY SQUAMOUS CELL CARCINOMA | LUNG SMALL CELL SQUAMOUS CELL CARCINOMA | LUNG SQUAMOUS CELL CARCINOMA- NOT OTHERWISE SPECIFIED (NOS) |
|---|---|---|---|---|
| ALL | 4 | 1 | 1 | 138 |
| subtype1 | 0 | 0 | 0 | 55 |
| subtype2 | 2 | 1 | 0 | 48 |
| subtype3 | 2 | 0 | 1 | 35 |
Figure S25. Get High-res Image Clustering Approach #3: 'METHLYATION CNMF' versus Clinical Feature #5: 'HISTOLOGICAL.TYPE'
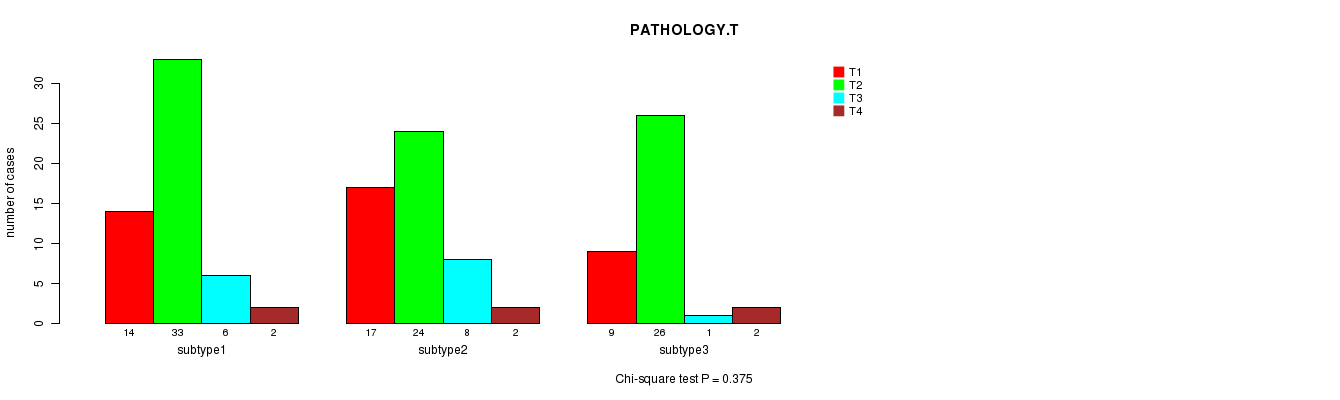
P value = 0.375 (Chi-square test)
Table S29. Clustering Approach #3: 'METHLYATION CNMF' versus Clinical Feature #6: 'PATHOLOGY.T'
| nPatients | T1 | T2 | T3 | T4 |
|---|---|---|---|---|
| ALL | 40 | 83 | 15 | 6 |
| subtype1 | 14 | 33 | 6 | 2 |
| subtype2 | 17 | 24 | 8 | 2 |
| subtype3 | 9 | 26 | 1 | 2 |
Figure S26. Get High-res Image Clustering Approach #3: 'METHLYATION CNMF' versus Clinical Feature #6: 'PATHOLOGY.T'
P value = 0.31 (Chi-square test)
Table S30. Clustering Approach #3: 'METHLYATION CNMF' versus Clinical Feature #7: 'PATHOLOGY.N'
| nPatients | N0 | N1 | N2 |
|---|---|---|---|
| ALL | 92 | 40 | 12 |
| subtype1 | 33 | 14 | 8 |
| subtype2 | 35 | 14 | 2 |
| subtype3 | 24 | 12 | 2 |
Figure S27. Get High-res Image Clustering Approach #3: 'METHLYATION CNMF' versus Clinical Feature #7: 'PATHOLOGY.N'
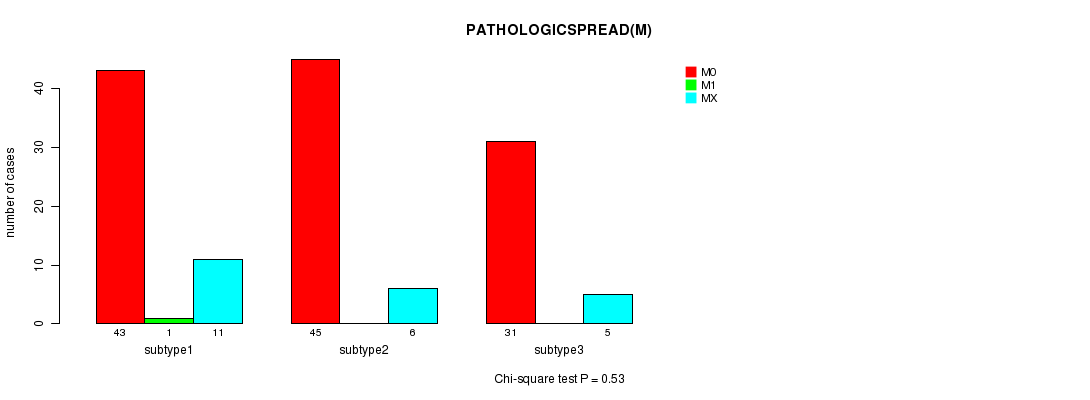
P value = 0.53 (Chi-square test)
Table S31. Clustering Approach #3: 'METHLYATION CNMF' versus Clinical Feature #8: 'PATHOLOGICSPREAD(M)'
| nPatients | M0 | M1 | MX |
|---|---|---|---|
| ALL | 119 | 1 | 22 |
| subtype1 | 43 | 1 | 11 |
| subtype2 | 45 | 0 | 6 |
| subtype3 | 31 | 0 | 5 |
Figure S28. Get High-res Image Clustering Approach #3: 'METHLYATION CNMF' versus Clinical Feature #8: 'PATHOLOGICSPREAD(M)'
P value = 0.245 (Fisher's exact test)
Table S32. Clustering Approach #3: 'METHLYATION CNMF' versus Clinical Feature #9: 'RADIATIONS.RADIATION.REGIMENINDICATION'
| nPatients | NO | YES |
|---|---|---|
| ALL | 136 | 8 |
| subtype1 | 52 | 3 |
| subtype2 | 50 | 1 |
| subtype3 | 34 | 4 |
Figure S29. Get High-res Image Clustering Approach #3: 'METHLYATION CNMF' versus Clinical Feature #9: 'RADIATIONS.RADIATION.REGIMENINDICATION'
P value = 0.668 (Fisher's exact test)
Table S33. Clustering Approach #3: 'METHLYATION CNMF' versus Clinical Feature #10: 'NEOADJUVANT.THERAPY'
| nPatients | NO | YES |
|---|---|---|
| ALL | 128 | 16 |
| subtype1 | 48 | 7 |
| subtype2 | 47 | 4 |
| subtype3 | 33 | 5 |
Figure S30. Get High-res Image Clustering Approach #3: 'METHLYATION CNMF' versus Clinical Feature #10: 'NEOADJUVANT.THERAPY'
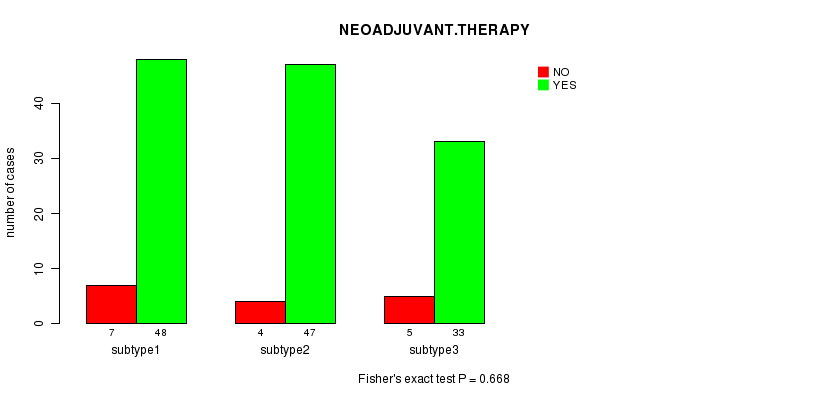
Table S34. Get Full Table Description of clustering approach #4: 'RNAseq CNMF subtypes'
| Cluster Labels | 1 | 2 | 3 | 4 | 5 | 6 | 7 | 8 |
|---|---|---|---|---|---|---|---|---|
| Number of samples | 22 | 20 | 55 | 40 | 34 | 36 | 4 | 9 |
P value = 0.0031 (logrank test)
Table S35. Clustering Approach #4: 'RNAseq CNMF subtypes' versus Clinical Feature #1: 'Time to Death'
| nPatients | nDeath | Duration Range (Median), Month | |
|---|---|---|---|
| ALL | 204 | 85 | 0.1 - 173.8 (18.5) |
| subtype1 | 20 | 6 | 0.1 - 115.6 (11.9) |
| subtype2 | 17 | 9 | 0.8 - 60.9 (13.1) |
| subtype3 | 52 | 20 | 0.4 - 141.3 (23.7) |
| subtype4 | 37 | 17 | 0.4 - 114.0 (15.6) |
| subtype5 | 32 | 14 | 1.0 - 122.4 (23.6) |
| subtype6 | 34 | 13 | 0.4 - 173.8 (11.3) |
| subtype7 | 3 | 2 | 1.0 - 27.0 (4.3) |
| subtype8 | 9 | 4 | 0.6 - 97.9 (32.7) |
Figure S31. Get High-res Image Clustering Approach #4: 'RNAseq CNMF subtypes' versus Clinical Feature #1: 'Time to Death'
P value = 0.00813 (ANOVA)
Table S36. Clustering Approach #4: 'RNAseq CNMF subtypes' versus Clinical Feature #2: 'AGE'
| nPatients | Mean (Std.Dev) | |
|---|---|---|
| ALL | 212 | 67.5 (8.4) |
| subtype1 | 22 | 65.1 (8.7) |
| subtype2 | 18 | 66.8 (7.9) |
| subtype3 | 54 | 66.0 (8.3) |
| subtype4 | 38 | 71.7 (6.9) |
| subtype5 | 32 | 68.8 (9.2) |
| subtype6 | 35 | 64.9 (8.8) |
| subtype7 | 4 | 66.2 (3.4) |
| subtype8 | 9 | 71.0 (6.2) |
Figure S32. Get High-res Image Clustering Approach #4: 'RNAseq CNMF subtypes' versus Clinical Feature #2: 'AGE'
P value = 0.225 (Chi-square test)
Table S37. Clustering Approach #4: 'RNAseq CNMF subtypes' versus Clinical Feature #3: 'GENDER'
| nPatients | FEMALE | MALE |
|---|---|---|
| ALL | 161 | 59 |
| subtype1 | 17 | 5 |
| subtype2 | 16 | 4 |
| subtype3 | 45 | 10 |
| subtype4 | 23 | 17 |
| subtype5 | 26 | 8 |
| subtype6 | 26 | 10 |
| subtype7 | 3 | 1 |
| subtype8 | 5 | 4 |
Figure S33. Get High-res Image Clustering Approach #4: 'RNAseq CNMF subtypes' versus Clinical Feature #3: 'GENDER'
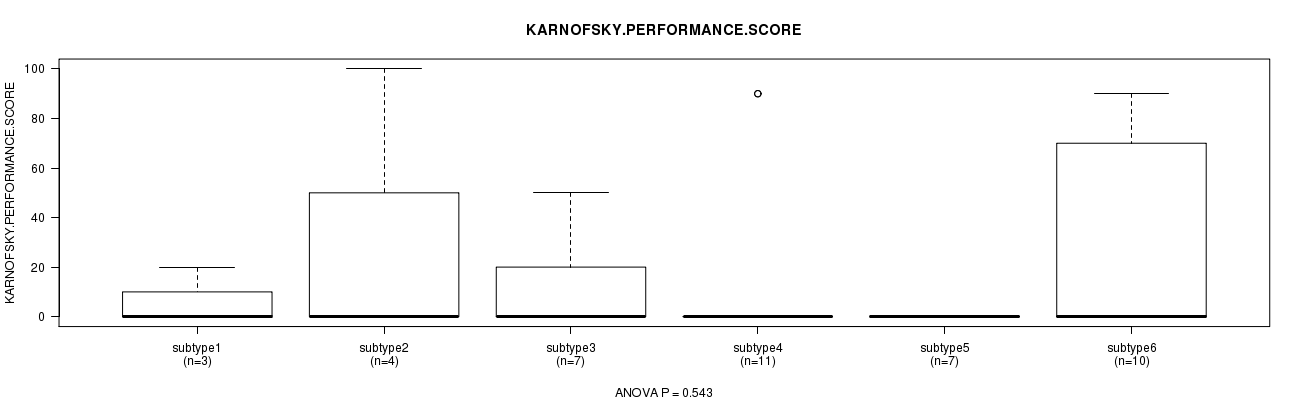
P value = 0.543 (ANOVA)
Table S38. Clustering Approach #4: 'RNAseq CNMF subtypes' versus Clinical Feature #4: 'KARNOFSKY.PERFORMANCE.SCORE'
| nPatients | Mean (Std.Dev) | |
|---|---|---|
| ALL | 44 | 17.7 (33.6) |
| subtype1 | 3 | 6.7 (11.5) |
| subtype2 | 4 | 25.0 (50.0) |
| subtype3 | 7 | 12.9 (22.1) |
| subtype4 | 11 | 16.4 (36.4) |
| subtype5 | 7 | 0.0 (0.0) |
| subtype6 | 10 | 30.0 (40.3) |
| subtype8 | 2 | 45.0 (63.6) |
Figure S34. Get High-res Image Clustering Approach #4: 'RNAseq CNMF subtypes' versus Clinical Feature #4: 'KARNOFSKY.PERFORMANCE.SCORE'
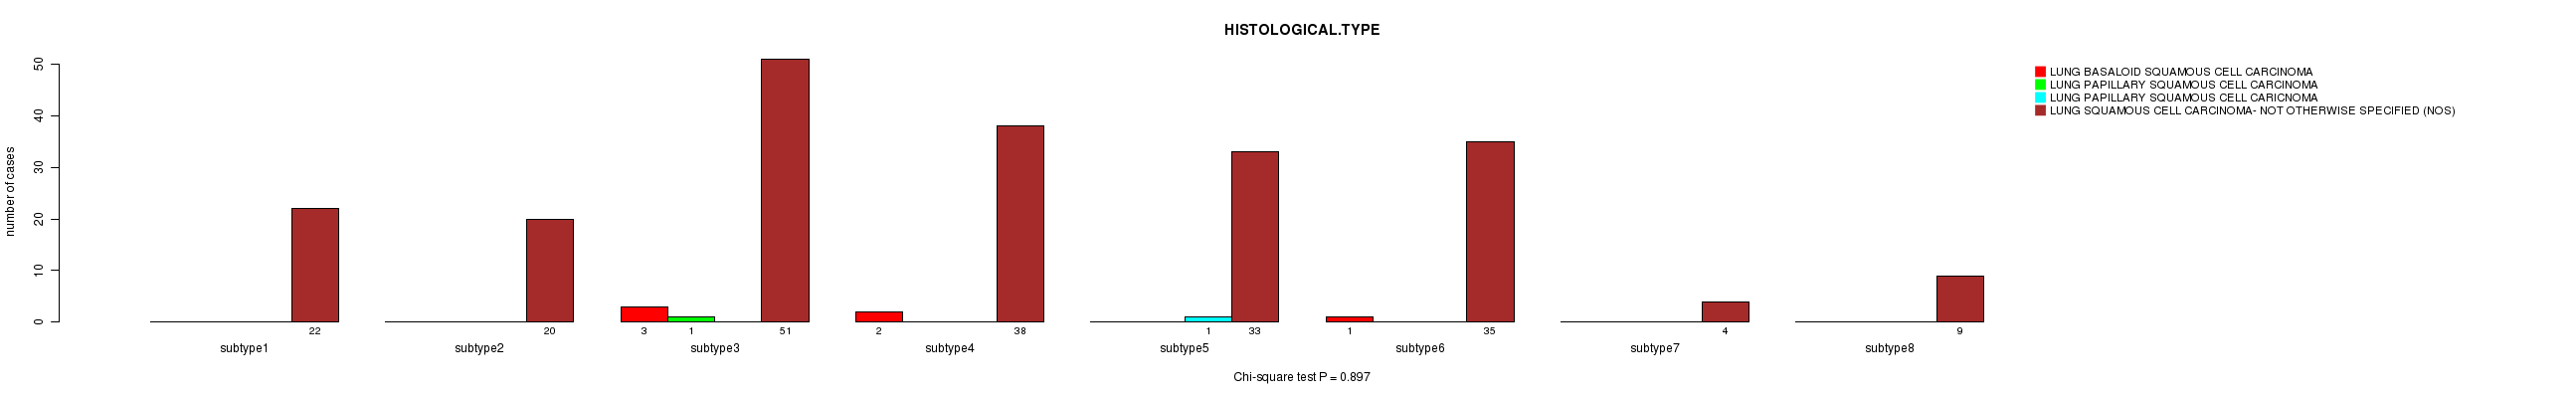
P value = 0.897 (Chi-square test)
Table S39. Clustering Approach #4: 'RNAseq CNMF subtypes' versus Clinical Feature #5: 'HISTOLOGICAL.TYPE'
| nPatients | LUNG BASALOID SQUAMOUS CELL CARCINOMA | LUNG PAPILLARY SQUAMOUS CELL CARCINOMA | LUNG PAPILLARY SQUAMOUS CELL CARICNOMA | LUNG SQUAMOUS CELL CARCINOMA- NOT OTHERWISE SPECIFIED (NOS) |
|---|---|---|---|---|
| ALL | 6 | 1 | 1 | 212 |
| subtype1 | 0 | 0 | 0 | 22 |
| subtype2 | 0 | 0 | 0 | 20 |
| subtype3 | 3 | 1 | 0 | 51 |
| subtype4 | 2 | 0 | 0 | 38 |
| subtype5 | 0 | 0 | 1 | 33 |
| subtype6 | 1 | 0 | 0 | 35 |
| subtype7 | 0 | 0 | 0 | 4 |
| subtype8 | 0 | 0 | 0 | 9 |
Figure S35. Get High-res Image Clustering Approach #4: 'RNAseq CNMF subtypes' versus Clinical Feature #5: 'HISTOLOGICAL.TYPE'
P value = 0.0215 (Chi-square test)
Table S40. Clustering Approach #4: 'RNAseq CNMF subtypes' versus Clinical Feature #6: 'PATHOLOGY.T'
| nPatients | T1 | T2 | T3 | T4 |
|---|---|---|---|---|
| ALL | 51 | 133 | 23 | 13 |
| subtype1 | 2 | 13 | 7 | 0 |
| subtype2 | 5 | 12 | 3 | 0 |
| subtype3 | 8 | 35 | 6 | 6 |
| subtype4 | 11 | 25 | 1 | 3 |
| subtype5 | 5 | 26 | 2 | 1 |
| subtype6 | 14 | 16 | 4 | 2 |
| subtype7 | 2 | 2 | 0 | 0 |
| subtype8 | 4 | 4 | 0 | 1 |
Figure S36. Get High-res Image Clustering Approach #4: 'RNAseq CNMF subtypes' versus Clinical Feature #6: 'PATHOLOGY.T'
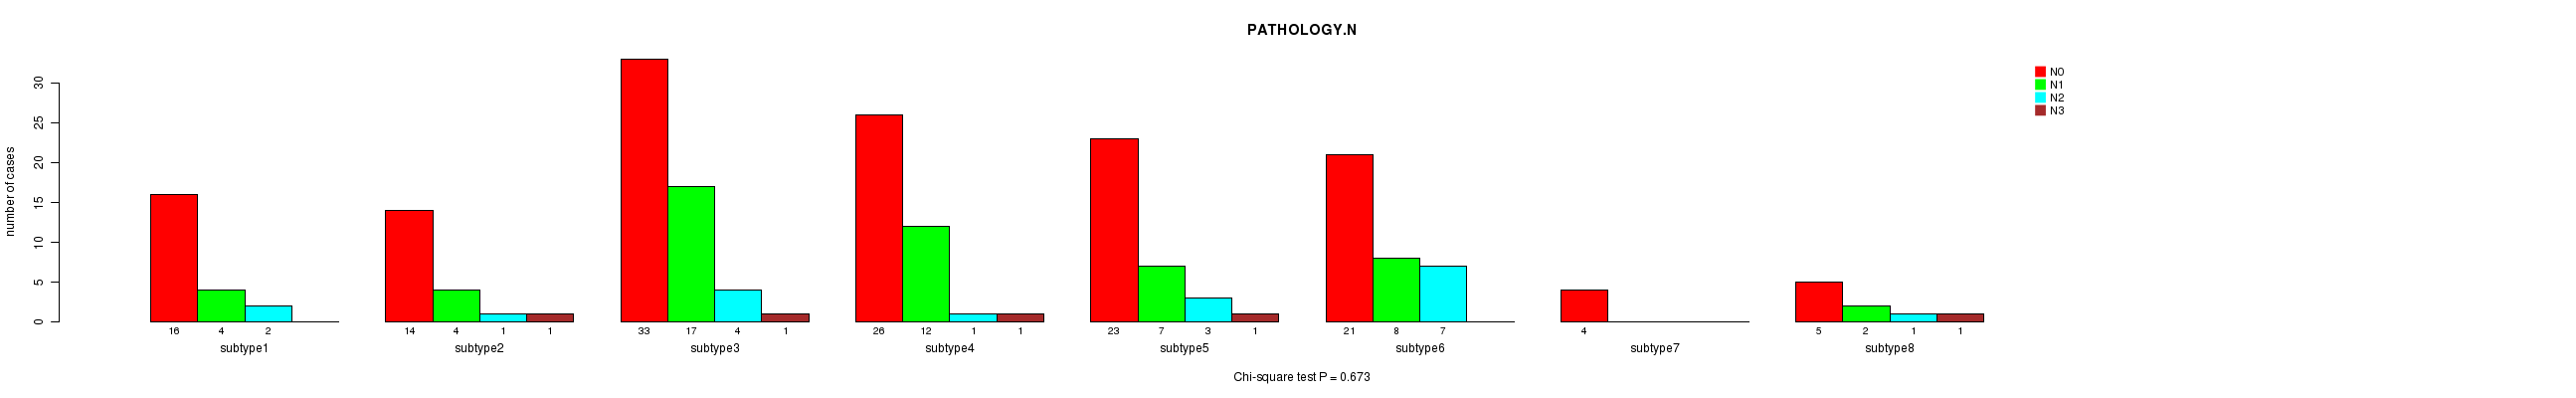
P value = 0.673 (Chi-square test)
Table S41. Clustering Approach #4: 'RNAseq CNMF subtypes' versus Clinical Feature #7: 'PATHOLOGY.N'
| nPatients | N0 | N1 | N2 | N3 |
|---|---|---|---|---|
| ALL | 142 | 54 | 19 | 5 |
| subtype1 | 16 | 4 | 2 | 0 |
| subtype2 | 14 | 4 | 1 | 1 |
| subtype3 | 33 | 17 | 4 | 1 |
| subtype4 | 26 | 12 | 1 | 1 |
| subtype5 | 23 | 7 | 3 | 1 |
| subtype6 | 21 | 8 | 7 | 0 |
| subtype7 | 4 | 0 | 0 | 0 |
| subtype8 | 5 | 2 | 1 | 1 |
Figure S37. Get High-res Image Clustering Approach #4: 'RNAseq CNMF subtypes' versus Clinical Feature #7: 'PATHOLOGY.N'
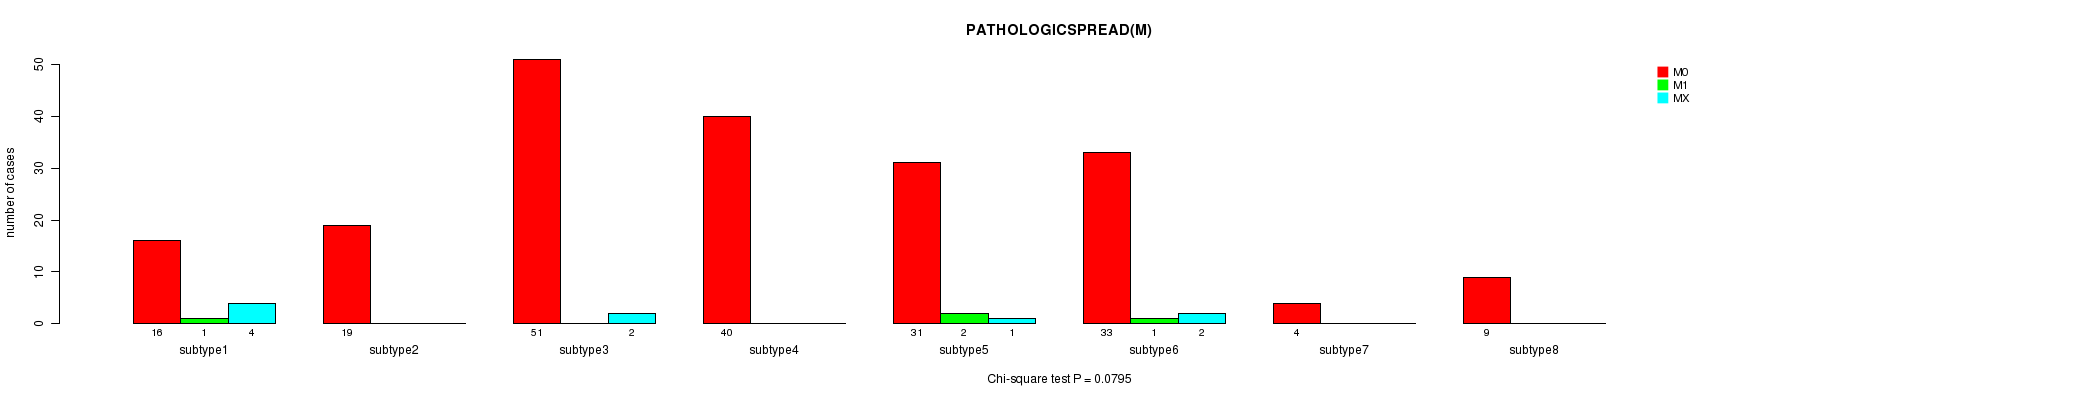
P value = 0.0795 (Chi-square test)
Table S42. Clustering Approach #4: 'RNAseq CNMF subtypes' versus Clinical Feature #8: 'PATHOLOGICSPREAD(M)'
| nPatients | M0 | M1 | MX |
|---|---|---|---|
| ALL | 203 | 4 | 9 |
| subtype1 | 16 | 1 | 4 |
| subtype2 | 19 | 0 | 0 |
| subtype3 | 51 | 0 | 2 |
| subtype4 | 40 | 0 | 0 |
| subtype5 | 31 | 2 | 1 |
| subtype6 | 33 | 1 | 2 |
| subtype7 | 4 | 0 | 0 |
| subtype8 | 9 | 0 | 0 |
Figure S38. Get High-res Image Clustering Approach #4: 'RNAseq CNMF subtypes' versus Clinical Feature #8: 'PATHOLOGICSPREAD(M)'
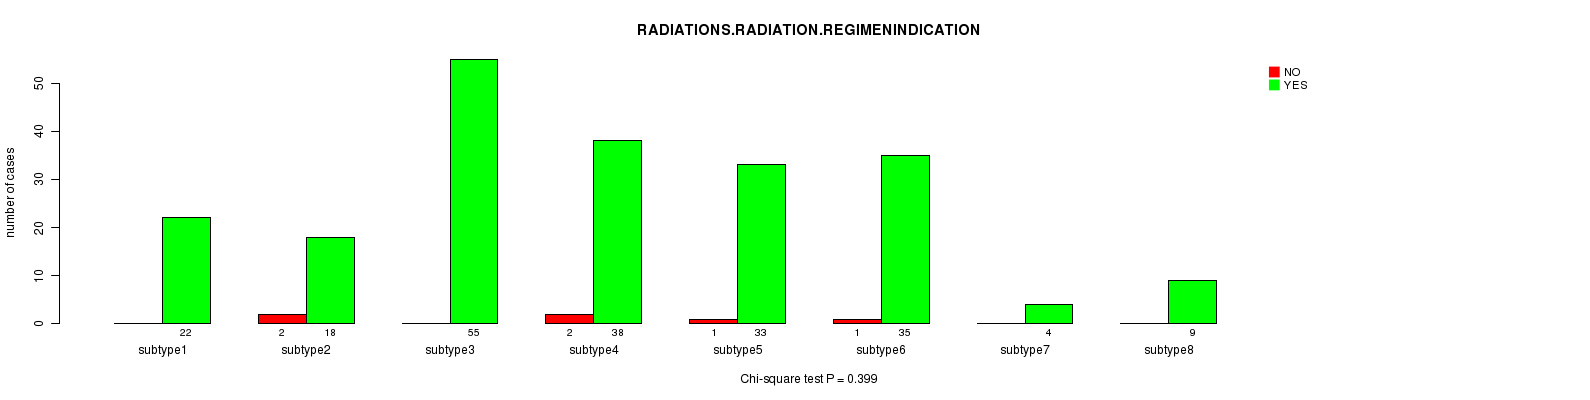
P value = 0.399 (Chi-square test)
Table S43. Clustering Approach #4: 'RNAseq CNMF subtypes' versus Clinical Feature #9: 'RADIATIONS.RADIATION.REGIMENINDICATION'
| nPatients | NO | YES |
|---|---|---|
| ALL | 214 | 6 |
| subtype1 | 22 | 0 |
| subtype2 | 18 | 2 |
| subtype3 | 55 | 0 |
| subtype4 | 38 | 2 |
| subtype5 | 33 | 1 |
| subtype6 | 35 | 1 |
| subtype7 | 4 | 0 |
| subtype8 | 9 | 0 |
Figure S39. Get High-res Image Clustering Approach #4: 'RNAseq CNMF subtypes' versus Clinical Feature #9: 'RADIATIONS.RADIATION.REGIMENINDICATION'
P value = 0.246 (Chi-square test)
Table S44. Clustering Approach #4: 'RNAseq CNMF subtypes' versus Clinical Feature #10: 'NEOADJUVANT.THERAPY'
| nPatients | NO | YES |
|---|---|---|
| ALL | 199 | 21 |
| subtype1 | 21 | 1 |
| subtype2 | 18 | 2 |
| subtype3 | 51 | 4 |
| subtype4 | 38 | 2 |
| subtype5 | 31 | 3 |
| subtype6 | 28 | 8 |
| subtype7 | 4 | 0 |
| subtype8 | 8 | 1 |
Figure S40. Get High-res Image Clustering Approach #4: 'RNAseq CNMF subtypes' versus Clinical Feature #10: 'NEOADJUVANT.THERAPY'
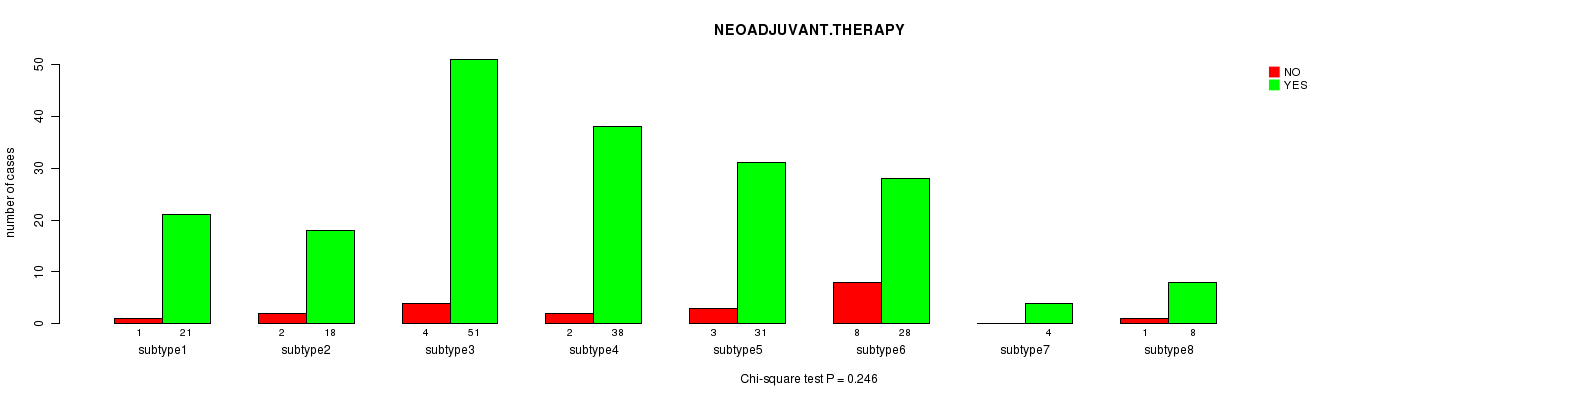
Table S45. Get Full Table Description of clustering approach #5: 'RNAseq cHierClus subtypes'
| Cluster Labels | 1 | 2 | 3 |
|---|---|---|---|
| Number of samples | 65 | 74 | 81 |
P value = 0.234 (logrank test)
Table S46. Clustering Approach #5: 'RNAseq cHierClus subtypes' versus Clinical Feature #1: 'Time to Death'
| nPatients | nDeath | Duration Range (Median), Month | |
|---|---|---|---|
| ALL | 204 | 85 | 0.1 - 173.8 (18.5) |
| subtype1 | 60 | 25 | 0.4 - 173.8 (8.9) |
| subtype2 | 68 | 28 | 0.4 - 141.3 (23.1) |
| subtype3 | 76 | 32 | 0.1 - 122.4 (22.3) |
Figure S41. Get High-res Image Clustering Approach #5: 'RNAseq cHierClus subtypes' versus Clinical Feature #1: 'Time to Death'
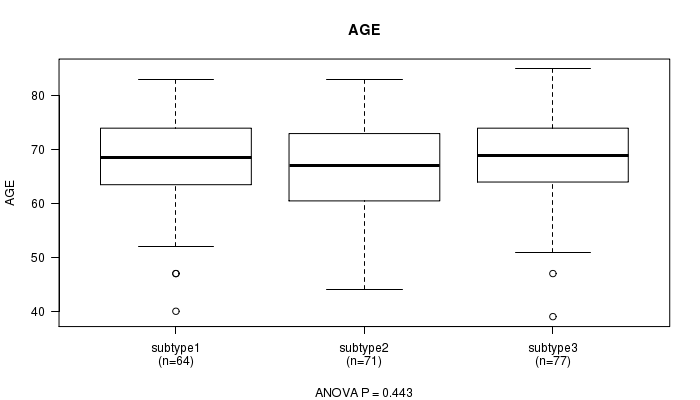
P value = 0.443 (ANOVA)
Table S47. Clustering Approach #5: 'RNAseq cHierClus subtypes' versus Clinical Feature #2: 'AGE'
| nPatients | Mean (Std.Dev) | |
|---|---|---|
| ALL | 212 | 67.5 (8.4) |
| subtype1 | 64 | 67.6 (8.6) |
| subtype2 | 71 | 66.5 (8.2) |
| subtype3 | 77 | 68.3 (8.5) |
Figure S42. Get High-res Image Clustering Approach #5: 'RNAseq cHierClus subtypes' versus Clinical Feature #2: 'AGE'
P value = 0.0447 (Fisher's exact test)
Table S48. Clustering Approach #5: 'RNAseq cHierClus subtypes' versus Clinical Feature #3: 'GENDER'
| nPatients | FEMALE | MALE |
|---|---|---|
| ALL | 161 | 59 |
| subtype1 | 40 | 25 |
| subtype2 | 59 | 15 |
| subtype3 | 62 | 19 |
Figure S43. Get High-res Image Clustering Approach #5: 'RNAseq cHierClus subtypes' versus Clinical Feature #3: 'GENDER'
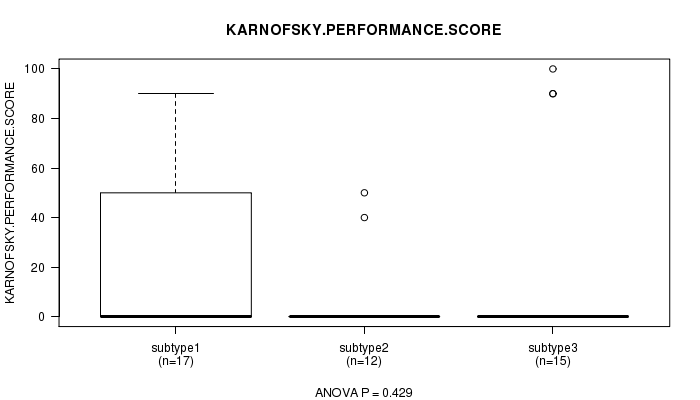
P value = 0.429 (ANOVA)
Table S49. Clustering Approach #5: 'RNAseq cHierClus subtypes' versus Clinical Feature #4: 'KARNOFSKY.PERFORMANCE.SCORE'
| nPatients | Mean (Std.Dev) | |
|---|---|---|
| ALL | 44 | 17.7 (33.6) |
| subtype1 | 17 | 24.1 (37.3) |
| subtype2 | 12 | 7.5 (17.6) |
| subtype3 | 15 | 18.7 (38.7) |
Figure S44. Get High-res Image Clustering Approach #5: 'RNAseq cHierClus subtypes' versus Clinical Feature #4: 'KARNOFSKY.PERFORMANCE.SCORE'
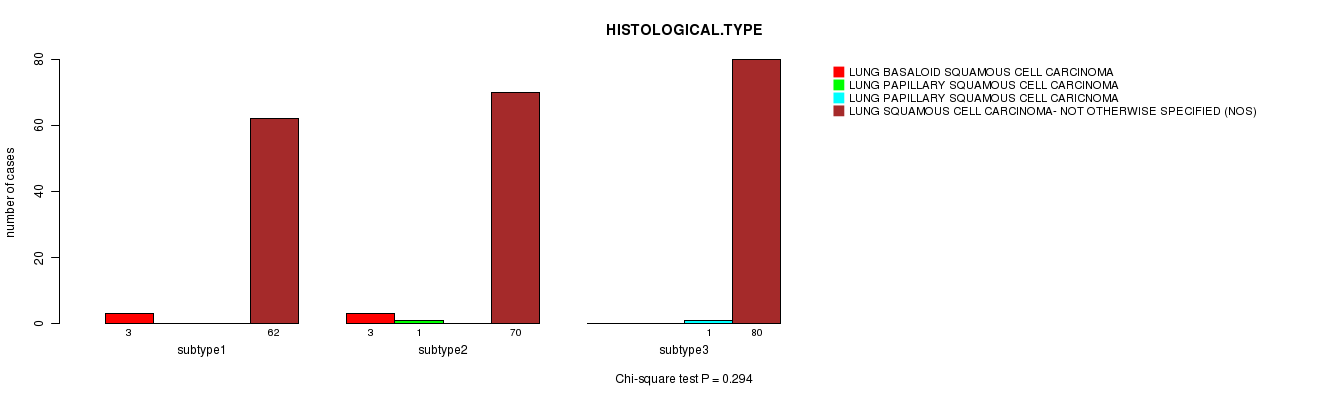
P value = 0.294 (Chi-square test)
Table S50. Clustering Approach #5: 'RNAseq cHierClus subtypes' versus Clinical Feature #5: 'HISTOLOGICAL.TYPE'
| nPatients | LUNG BASALOID SQUAMOUS CELL CARCINOMA | LUNG PAPILLARY SQUAMOUS CELL CARCINOMA | LUNG PAPILLARY SQUAMOUS CELL CARICNOMA | LUNG SQUAMOUS CELL CARCINOMA- NOT OTHERWISE SPECIFIED (NOS) |
|---|---|---|---|---|
| ALL | 6 | 1 | 1 | 212 |
| subtype1 | 3 | 0 | 0 | 62 |
| subtype2 | 3 | 1 | 0 | 70 |
| subtype3 | 0 | 0 | 1 | 80 |
Figure S45. Get High-res Image Clustering Approach #5: 'RNAseq cHierClus subtypes' versus Clinical Feature #5: 'HISTOLOGICAL.TYPE'
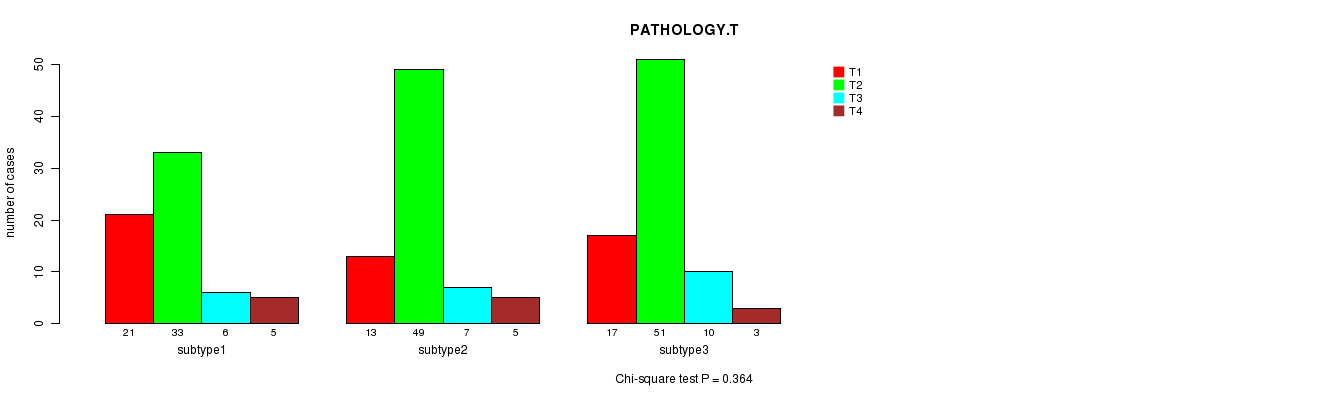
P value = 0.364 (Chi-square test)
Table S51. Clustering Approach #5: 'RNAseq cHierClus subtypes' versus Clinical Feature #6: 'PATHOLOGY.T'
| nPatients | T1 | T2 | T3 | T4 |
|---|---|---|---|---|
| ALL | 51 | 133 | 23 | 13 |
| subtype1 | 21 | 33 | 6 | 5 |
| subtype2 | 13 | 49 | 7 | 5 |
| subtype3 | 17 | 51 | 10 | 3 |
Figure S46. Get High-res Image Clustering Approach #5: 'RNAseq cHierClus subtypes' versus Clinical Feature #6: 'PATHOLOGY.T'
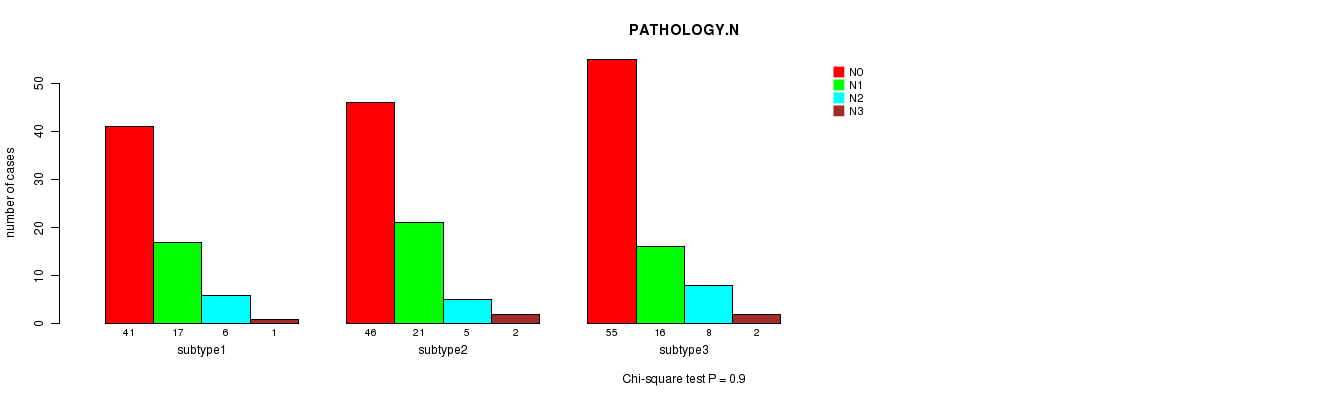
P value = 0.9 (Chi-square test)
Table S52. Clustering Approach #5: 'RNAseq cHierClus subtypes' versus Clinical Feature #7: 'PATHOLOGY.N'
| nPatients | N0 | N1 | N2 | N3 |
|---|---|---|---|---|
| ALL | 142 | 54 | 19 | 5 |
| subtype1 | 41 | 17 | 6 | 1 |
| subtype2 | 46 | 21 | 5 | 2 |
| subtype3 | 55 | 16 | 8 | 2 |
Figure S47. Get High-res Image Clustering Approach #5: 'RNAseq cHierClus subtypes' versus Clinical Feature #7: 'PATHOLOGY.N'
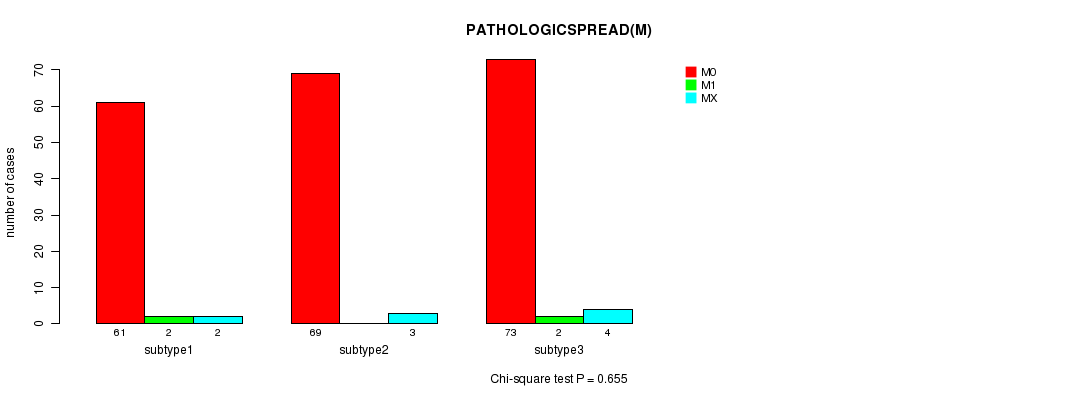
P value = 0.655 (Chi-square test)
Table S53. Clustering Approach #5: 'RNAseq cHierClus subtypes' versus Clinical Feature #8: 'PATHOLOGICSPREAD(M)'
| nPatients | M0 | M1 | MX |
|---|---|---|---|
| ALL | 203 | 4 | 9 |
| subtype1 | 61 | 2 | 2 |
| subtype2 | 69 | 0 | 3 |
| subtype3 | 73 | 2 | 4 |
Figure S48. Get High-res Image Clustering Approach #5: 'RNAseq cHierClus subtypes' versus Clinical Feature #8: 'PATHOLOGICSPREAD(M)'
P value = 0.382 (Fisher's exact test)
Table S54. Clustering Approach #5: 'RNAseq cHierClus subtypes' versus Clinical Feature #9: 'RADIATIONS.RADIATION.REGIMENINDICATION'
| nPatients | NO | YES |
|---|---|---|
| ALL | 214 | 6 |
| subtype1 | 64 | 1 |
| subtype2 | 73 | 1 |
| subtype3 | 77 | 4 |
Figure S49. Get High-res Image Clustering Approach #5: 'RNAseq cHierClus subtypes' versus Clinical Feature #9: 'RADIATIONS.RADIATION.REGIMENINDICATION'
P value = 0.958 (Fisher's exact test)
Table S55. Clustering Approach #5: 'RNAseq cHierClus subtypes' versus Clinical Feature #10: 'NEOADJUVANT.THERAPY'
| nPatients | NO | YES |
|---|---|---|
| ALL | 199 | 21 |
| subtype1 | 58 | 7 |
| subtype2 | 67 | 7 |
| subtype3 | 74 | 7 |
Figure S50. Get High-res Image Clustering Approach #5: 'RNAseq cHierClus subtypes' versus Clinical Feature #10: 'NEOADJUVANT.THERAPY'
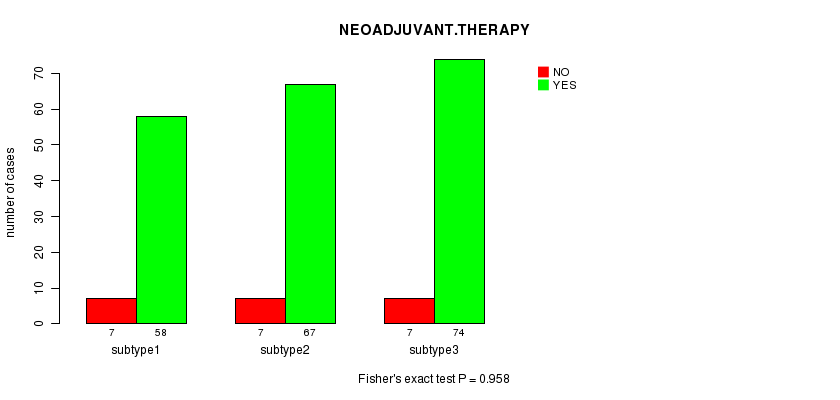
Table S56. Get Full Table Description of clustering approach #6: 'MIRseq CNMF subtypes'
| Cluster Labels | 1 | 2 | 3 |
|---|---|---|---|
| Number of samples | 84 | 73 | 45 |
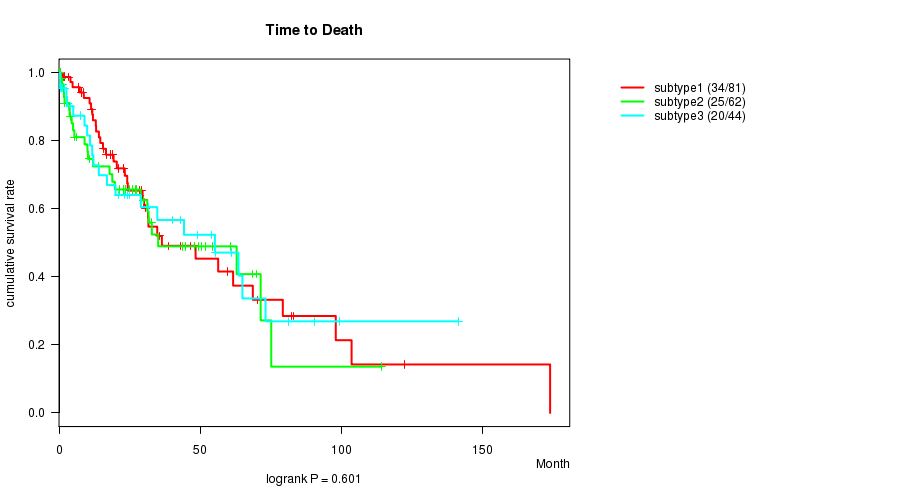
P value = 0.601 (logrank test)
Table S57. Clustering Approach #6: 'MIRseq CNMF subtypes' versus Clinical Feature #1: 'Time to Death'
| nPatients | nDeath | Duration Range (Median), Month | |
|---|---|---|---|
| ALL | 187 | 79 | 0.1 - 173.8 (18.8) |
| subtype1 | 81 | 34 | 0.4 - 173.8 (18.3) |
| subtype2 | 62 | 25 | 0.1 - 114.0 (18.4) |
| subtype3 | 44 | 20 | 0.4 - 141.3 (20.5) |
Figure S51. Get High-res Image Clustering Approach #6: 'MIRseq CNMF subtypes' versus Clinical Feature #1: 'Time to Death'
P value = 0.0431 (ANOVA)
Table S58. Clustering Approach #6: 'MIRseq CNMF subtypes' versus Clinical Feature #2: 'AGE'
| nPatients | Mean (Std.Dev) | |
|---|---|---|
| ALL | 195 | 68.3 (8.3) |
| subtype1 | 83 | 66.8 (9.3) |
| subtype2 | 68 | 70.2 (7.1) |
| subtype3 | 44 | 68.2 (7.5) |
Figure S52. Get High-res Image Clustering Approach #6: 'MIRseq CNMF subtypes' versus Clinical Feature #2: 'AGE'
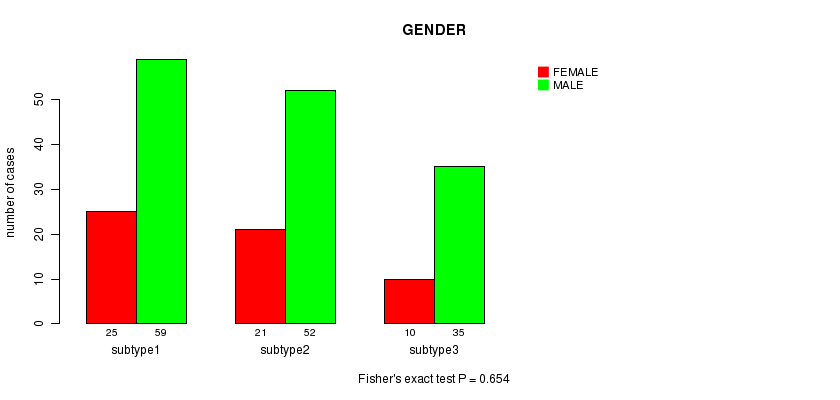
P value = 0.654 (Fisher's exact test)
Table S59. Clustering Approach #6: 'MIRseq CNMF subtypes' versus Clinical Feature #3: 'GENDER'
| nPatients | FEMALE | MALE |
|---|---|---|
| ALL | 146 | 56 |
| subtype1 | 59 | 25 |
| subtype2 | 52 | 21 |
| subtype3 | 35 | 10 |
Figure S53. Get High-res Image Clustering Approach #6: 'MIRseq CNMF subtypes' versus Clinical Feature #3: 'GENDER'
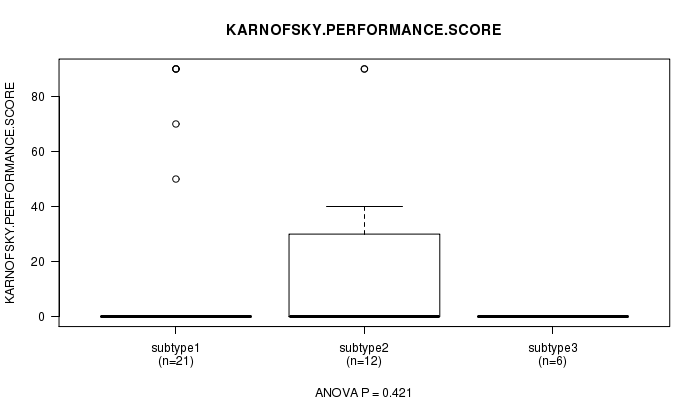
P value = 0.421 (ANOVA)
Table S60. Clustering Approach #6: 'MIRseq CNMF subtypes' versus Clinical Feature #4: 'KARNOFSKY.PERFORMANCE.SCORE'
| nPatients | Mean (Std.Dev) | |
|---|---|---|
| ALL | 39 | 16.2 (32.3) |
| subtype1 | 21 | 18.6 (35.0) |
| subtype2 | 12 | 20.0 (34.9) |
| subtype3 | 6 | 0.0 (0.0) |
Figure S54. Get High-res Image Clustering Approach #6: 'MIRseq CNMF subtypes' versus Clinical Feature #4: 'KARNOFSKY.PERFORMANCE.SCORE'
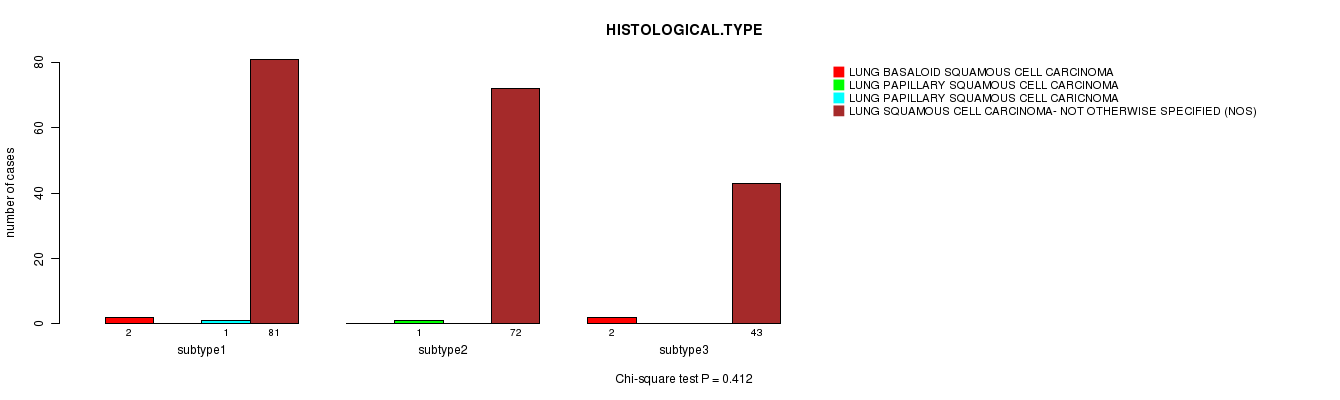
P value = 0.412 (Chi-square test)
Table S61. Clustering Approach #6: 'MIRseq CNMF subtypes' versus Clinical Feature #5: 'HISTOLOGICAL.TYPE'
| nPatients | LUNG BASALOID SQUAMOUS CELL CARCINOMA | LUNG PAPILLARY SQUAMOUS CELL CARCINOMA | LUNG PAPILLARY SQUAMOUS CELL CARICNOMA | LUNG SQUAMOUS CELL CARCINOMA- NOT OTHERWISE SPECIFIED (NOS) |
|---|---|---|---|---|
| ALL | 4 | 1 | 1 | 196 |
| subtype1 | 2 | 0 | 1 | 81 |
| subtype2 | 0 | 1 | 0 | 72 |
| subtype3 | 2 | 0 | 0 | 43 |
Figure S55. Get High-res Image Clustering Approach #6: 'MIRseq CNMF subtypes' versus Clinical Feature #5: 'HISTOLOGICAL.TYPE'
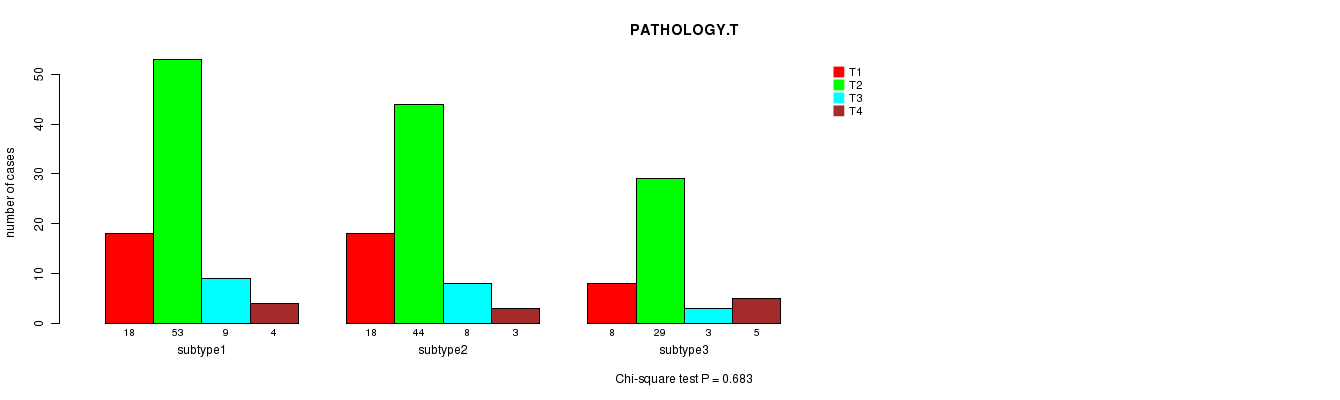
P value = 0.683 (Chi-square test)
Table S62. Clustering Approach #6: 'MIRseq CNMF subtypes' versus Clinical Feature #6: 'PATHOLOGY.T'
| nPatients | T1 | T2 | T3 | T4 |
|---|---|---|---|---|
| ALL | 44 | 126 | 20 | 12 |
| subtype1 | 18 | 53 | 9 | 4 |
| subtype2 | 18 | 44 | 8 | 3 |
| subtype3 | 8 | 29 | 3 | 5 |
Figure S56. Get High-res Image Clustering Approach #6: 'MIRseq CNMF subtypes' versus Clinical Feature #6: 'PATHOLOGY.T'
P value = 0.0392 (Chi-square test)
Table S63. Clustering Approach #6: 'MIRseq CNMF subtypes' versus Clinical Feature #7: 'PATHOLOGY.N'
| nPatients | N0 | N1 | N2 | N3 |
|---|---|---|---|---|
| ALL | 126 | 53 | 19 | 4 |
| subtype1 | 52 | 18 | 13 | 1 |
| subtype2 | 51 | 17 | 4 | 1 |
| subtype3 | 23 | 18 | 2 | 2 |
Figure S57. Get High-res Image Clustering Approach #6: 'MIRseq CNMF subtypes' versus Clinical Feature #7: 'PATHOLOGY.N'
P value = 0.00673 (Chi-square test)
Table S64. Clustering Approach #6: 'MIRseq CNMF subtypes' versus Clinical Feature #8: 'PATHOLOGICSPREAD(M)'
| nPatients | M0 | M1 | MX |
|---|---|---|---|
| ALL | 185 | 3 | 10 |
| subtype1 | 80 | 2 | 0 |
| subtype2 | 63 | 1 | 9 |
| subtype3 | 42 | 0 | 1 |
Figure S58. Get High-res Image Clustering Approach #6: 'MIRseq CNMF subtypes' versus Clinical Feature #8: 'PATHOLOGICSPREAD(M)'
P value = 0.656 (Fisher's exact test)
Table S65. Clustering Approach #6: 'MIRseq CNMF subtypes' versus Clinical Feature #9: 'RADIATIONS.RADIATION.REGIMENINDICATION'
| nPatients | NO | YES |
|---|---|---|
| ALL | 196 | 6 |
| subtype1 | 81 | 3 |
| subtype2 | 72 | 1 |
| subtype3 | 43 | 2 |
Figure S59. Get High-res Image Clustering Approach #6: 'MIRseq CNMF subtypes' versus Clinical Feature #9: 'RADIATIONS.RADIATION.REGIMENINDICATION'
P value = 0.748 (Fisher's exact test)
Table S66. Clustering Approach #6: 'MIRseq CNMF subtypes' versus Clinical Feature #10: 'NEOADJUVANT.THERAPY'
| nPatients | NO | YES |
|---|---|---|
| ALL | 179 | 23 |
| subtype1 | 76 | 8 |
| subtype2 | 64 | 9 |
| subtype3 | 39 | 6 |
Figure S60. Get High-res Image Clustering Approach #6: 'MIRseq CNMF subtypes' versus Clinical Feature #10: 'NEOADJUVANT.THERAPY'
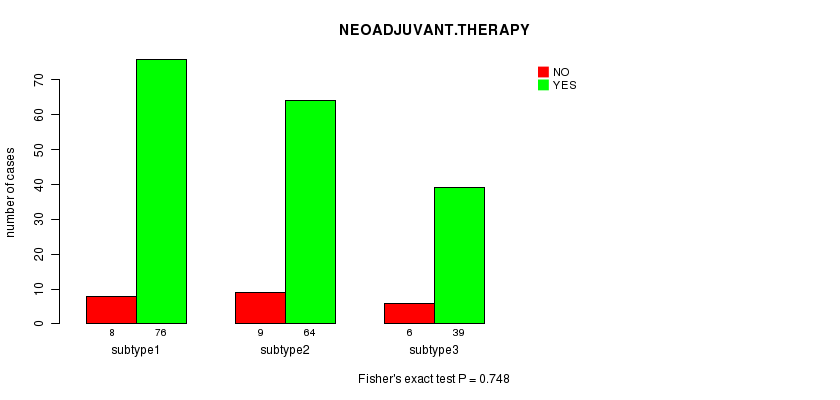
Table S67. Get Full Table Description of clustering approach #7: 'MIRseq cHierClus subtypes'
| Cluster Labels | 1 | 2 | 3 |
|---|---|---|---|
| Number of samples | 97 | 63 | 42 |
P value = 0.503 (logrank test)
Table S68. Clustering Approach #7: 'MIRseq cHierClus subtypes' versus Clinical Feature #1: 'Time to Death'
| nPatients | nDeath | Duration Range (Median), Month | |
|---|---|---|---|
| ALL | 187 | 79 | 0.1 - 173.8 (18.8) |
| subtype1 | 88 | 35 | 0.1 - 173.8 (14.3) |
| subtype2 | 59 | 26 | 0.4 - 122.4 (22.8) |
| subtype3 | 40 | 18 | 0.4 - 141.3 (20.5) |
Figure S61. Get High-res Image Clustering Approach #7: 'MIRseq cHierClus subtypes' versus Clinical Feature #1: 'Time to Death'
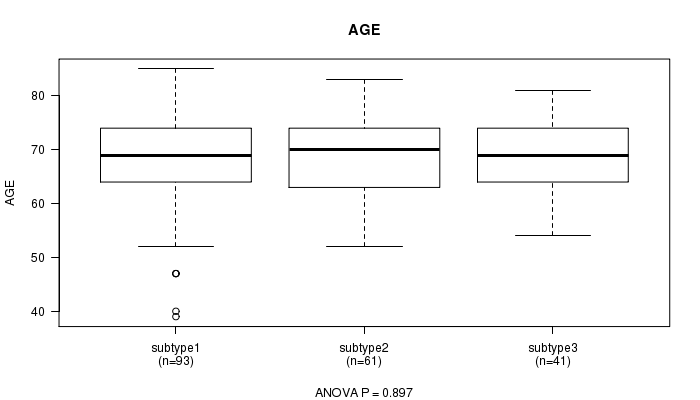
P value = 0.897 (ANOVA)
Table S69. Clustering Approach #7: 'MIRseq cHierClus subtypes' versus Clinical Feature #2: 'AGE'
| nPatients | Mean (Std.Dev) | |
|---|---|---|
| ALL | 195 | 68.3 (8.3) |
| subtype1 | 93 | 68.1 (8.9) |
| subtype2 | 61 | 68.7 (7.8) |
| subtype3 | 41 | 68.1 (7.5) |
Figure S62. Get High-res Image Clustering Approach #7: 'MIRseq cHierClus subtypes' versus Clinical Feature #2: 'AGE'
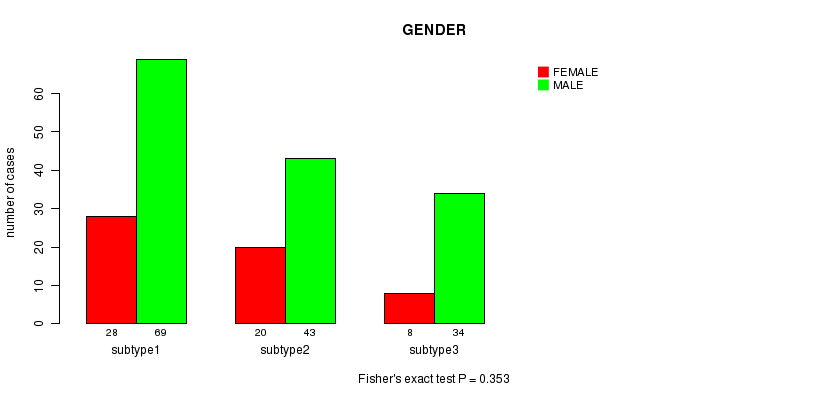
P value = 0.353 (Fisher's exact test)
Table S70. Clustering Approach #7: 'MIRseq cHierClus subtypes' versus Clinical Feature #3: 'GENDER'
| nPatients | FEMALE | MALE |
|---|---|---|
| ALL | 146 | 56 |
| subtype1 | 69 | 28 |
| subtype2 | 43 | 20 |
| subtype3 | 34 | 8 |
Figure S63. Get High-res Image Clustering Approach #7: 'MIRseq cHierClus subtypes' versus Clinical Feature #3: 'GENDER'
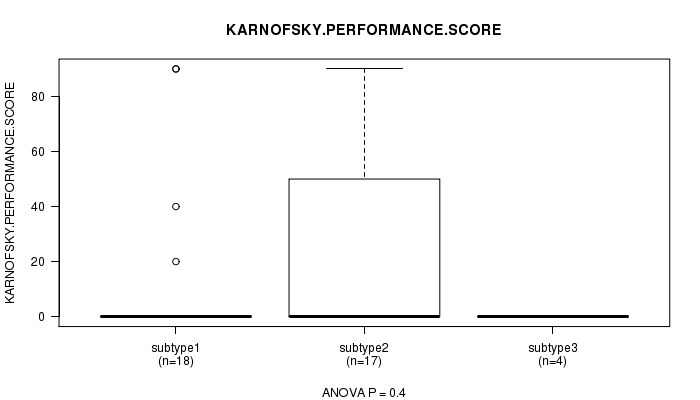
P value = 0.4 (ANOVA)
Table S71. Clustering Approach #7: 'MIRseq cHierClus subtypes' versus Clinical Feature #4: 'KARNOFSKY.PERFORMANCE.SCORE'
| nPatients | Mean (Std.Dev) | |
|---|---|---|
| ALL | 39 | 16.2 (32.3) |
| subtype1 | 18 | 13.3 (29.7) |
| subtype2 | 17 | 22.9 (37.7) |
| subtype3 | 4 | 0.0 (0.0) |
Figure S64. Get High-res Image Clustering Approach #7: 'MIRseq cHierClus subtypes' versus Clinical Feature #4: 'KARNOFSKY.PERFORMANCE.SCORE'
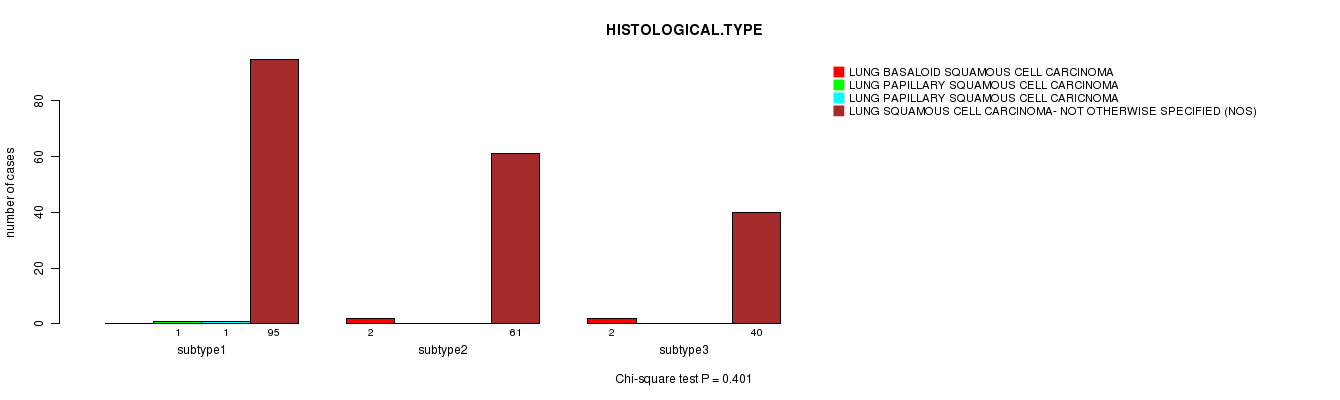
P value = 0.401 (Chi-square test)
Table S72. Clustering Approach #7: 'MIRseq cHierClus subtypes' versus Clinical Feature #5: 'HISTOLOGICAL.TYPE'
| nPatients | LUNG BASALOID SQUAMOUS CELL CARCINOMA | LUNG PAPILLARY SQUAMOUS CELL CARCINOMA | LUNG PAPILLARY SQUAMOUS CELL CARICNOMA | LUNG SQUAMOUS CELL CARCINOMA- NOT OTHERWISE SPECIFIED (NOS) |
|---|---|---|---|---|
| ALL | 4 | 1 | 1 | 196 |
| subtype1 | 0 | 1 | 1 | 95 |
| subtype2 | 2 | 0 | 0 | 61 |
| subtype3 | 2 | 0 | 0 | 40 |
Figure S65. Get High-res Image Clustering Approach #7: 'MIRseq cHierClus subtypes' versus Clinical Feature #5: 'HISTOLOGICAL.TYPE'
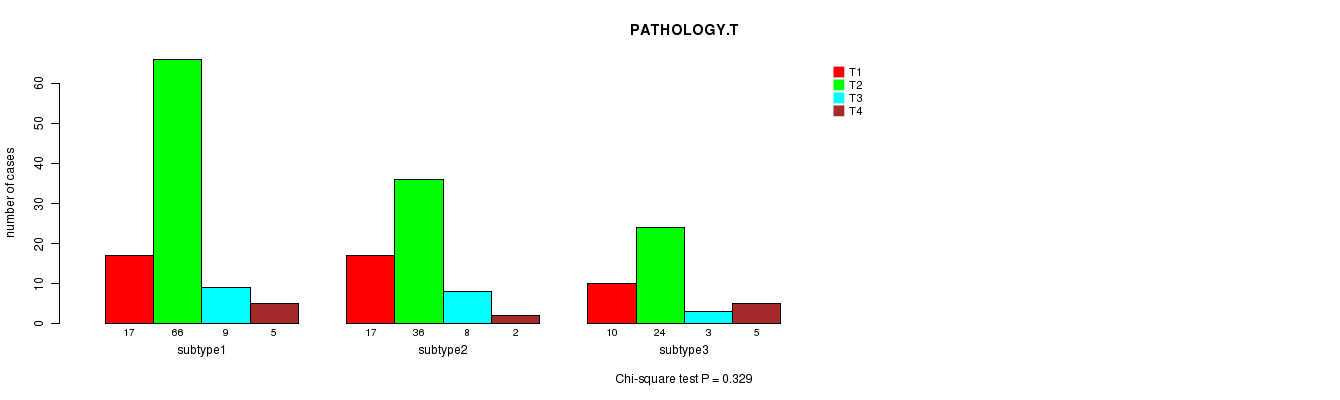
P value = 0.329 (Chi-square test)
Table S73. Clustering Approach #7: 'MIRseq cHierClus subtypes' versus Clinical Feature #6: 'PATHOLOGY.T'
| nPatients | T1 | T2 | T3 | T4 |
|---|---|---|---|---|
| ALL | 44 | 126 | 20 | 12 |
| subtype1 | 17 | 66 | 9 | 5 |
| subtype2 | 17 | 36 | 8 | 2 |
| subtype3 | 10 | 24 | 3 | 5 |
Figure S66. Get High-res Image Clustering Approach #7: 'MIRseq cHierClus subtypes' versus Clinical Feature #6: 'PATHOLOGY.T'
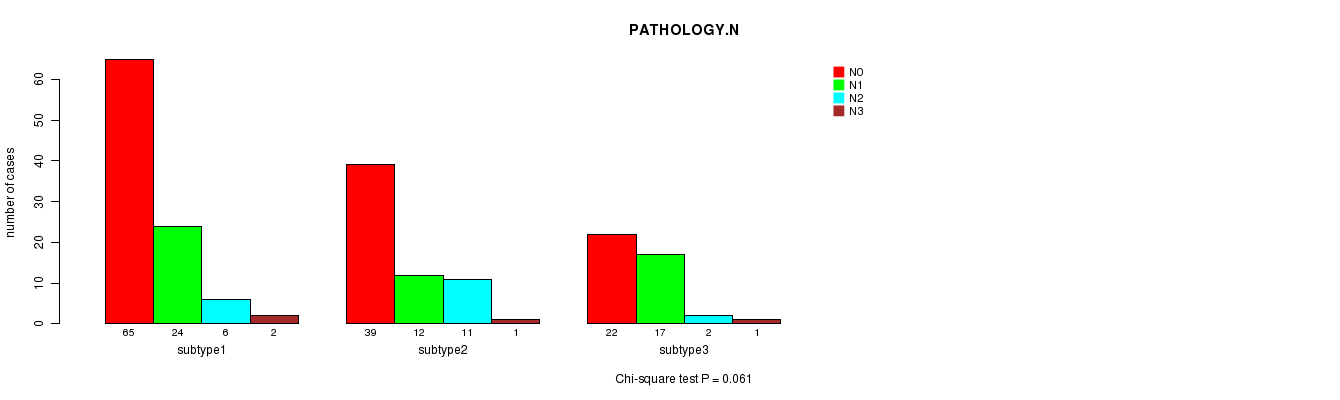
P value = 0.061 (Chi-square test)
Table S74. Clustering Approach #7: 'MIRseq cHierClus subtypes' versus Clinical Feature #7: 'PATHOLOGY.N'
| nPatients | N0 | N1 | N2 | N3 |
|---|---|---|---|---|
| ALL | 126 | 53 | 19 | 4 |
| subtype1 | 65 | 24 | 6 | 2 |
| subtype2 | 39 | 12 | 11 | 1 |
| subtype3 | 22 | 17 | 2 | 1 |
Figure S67. Get High-res Image Clustering Approach #7: 'MIRseq cHierClus subtypes' versus Clinical Feature #7: 'PATHOLOGY.N'
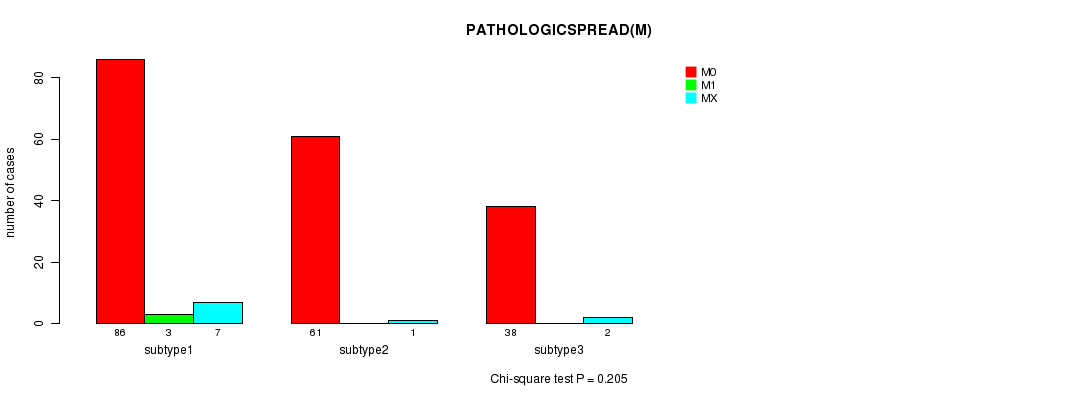
P value = 0.205 (Chi-square test)
Table S75. Clustering Approach #7: 'MIRseq cHierClus subtypes' versus Clinical Feature #8: 'PATHOLOGICSPREAD(M)'
| nPatients | M0 | M1 | MX |
|---|---|---|---|
| ALL | 185 | 3 | 10 |
| subtype1 | 86 | 3 | 7 |
| subtype2 | 61 | 0 | 1 |
| subtype3 | 38 | 0 | 2 |
Figure S68. Get High-res Image Clustering Approach #7: 'MIRseq cHierClus subtypes' versus Clinical Feature #8: 'PATHOLOGICSPREAD(M)'
P value = 0.0193 (Fisher's exact test)
Table S76. Clustering Approach #7: 'MIRseq cHierClus subtypes' versus Clinical Feature #9: 'RADIATIONS.RADIATION.REGIMENINDICATION'
| nPatients | NO | YES |
|---|---|---|
| ALL | 196 | 6 |
| subtype1 | 97 | 0 |
| subtype2 | 59 | 4 |
| subtype3 | 40 | 2 |
Figure S69. Get High-res Image Clustering Approach #7: 'MIRseq cHierClus subtypes' versus Clinical Feature #9: 'RADIATIONS.RADIATION.REGIMENINDICATION'
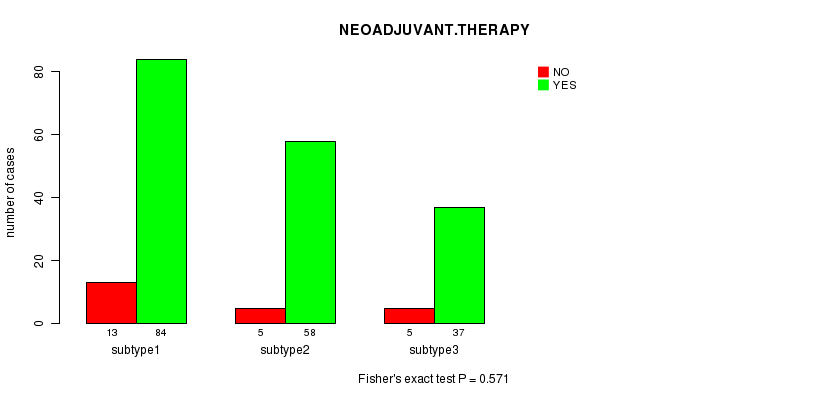
P value = 0.571 (Fisher's exact test)
Table S77. Clustering Approach #7: 'MIRseq cHierClus subtypes' versus Clinical Feature #10: 'NEOADJUVANT.THERAPY'
| nPatients | NO | YES |
|---|---|---|
| ALL | 179 | 23 |
| subtype1 | 84 | 13 |
| subtype2 | 58 | 5 |
| subtype3 | 37 | 5 |
Figure S70. Get High-res Image Clustering Approach #7: 'MIRseq cHierClus subtypes' versus Clinical Feature #10: 'NEOADJUVANT.THERAPY'
-
Cluster data file = LUSC.mergedcluster.txt
-
Clinical data file = LUSC.clin.merged.picked.txt
-
Number of patients = 278
-
Number of clustering approaches = 7
-
Number of selected clinical features = 10
-
Exclude small clusters that include fewer than K patients, K = 3
consensus non-negative matrix factorization clustering approach (Brunet et al. 2004)
Resampling-based clustering method (Monti et al. 2003)
For survival clinical features, the Kaplan-Meier survival curves of tumors with and without gene mutations were plotted and the statistical significance P values were estimated by logrank test (Bland and Altman 2004) using the 'survdiff' function in R
For continuous numerical clinical features, one-way analysis of variance (Howell 2002) was applied to compare the clinical values between tumor subtypes using 'anova' function in R
For binary clinical features, two-tailed Fisher's exact tests (Fisher 1922) were used to estimate the P values using the 'fisher.test' function in R
For multi-class clinical features (nominal or ordinal), Chi-square tests (Greenwood and Nikulin 1996) were used to estimate the P values using the 'chisq.test' function in R
This is an experimental feature. The full results of the analysis summarized in this report can be downloaded from the TCGA Data Coordination Center.