This pipeline uses various statistical tests to identify mRNAs whose expression levels correlated to selected clinical features.
Testing the association between 18632 genes and 6 clinical features across 564 samples, statistically thresholded by Q value < 0.05, 5 clinical features related to at least one genes.
-
1 gene correlated to 'Time to Death'.
-
ZFHX4
-
178 genes correlated to 'AGE'.
-
STS , GREB1 , GNPNAT1 , DEPDC6 , EIF4E3 , ...
-
3 genes correlated to 'PRIMARY.SITE.OF.DISEASE'.
-
SPINK8 , PTBP1 , EBI3
-
1 gene correlated to 'KARNOFSKY.PERFORMANCE.SCORE'.
-
WDR60
-
25 genes correlated to 'RADIATIONS.RADIATION.REGIMENINDICATION'.
-
RAPGEF1 , SNX9 , EIF4G2 , PRRX1 , ZNF507 , ...
-
No genes correlated to 'NEOADJUVANT.THERAPY'
Complete statistical result table is provided in Supplement Table 1
Table 1. Get Full Table This table shows the clinical features, statistical methods used, and the number of genes that are significantly associated with each clinical feature at Q value < 0.05.
| Clinical feature | Statistical test | Significant genes | Associated with | Associated with | ||
|---|---|---|---|---|---|---|
| Time to Death | Cox regression test | N=1 | shorter survival | N=1 | longer survival | N=0 |
| AGE | Spearman correlation test | N=178 | older | N=72 | younger | N=106 |
| PRIMARY SITE OF DISEASE | ANOVA test | N=3 | ||||
| KARNOFSKY PERFORMANCE SCORE | Spearman correlation test | N=1 | higher score | N=1 | lower score | N=0 |
| RADIATIONS RADIATION REGIMENINDICATION | t test | N=25 | yes | N=18 | no | N=7 |
| NEOADJUVANT THERAPY | t test | N=0 |
Table S1. Basic characteristics of clinical feature: 'Time to Death'
| Time to Death | Duration (Months) | 0.3-180.2 (median=28.3) |
| censored | N = 267 | |
| death | N = 292 | |
| Significant markers | N = 1 | |
| associated with shorter survival | 1 | |
| associated with longer survival | 0 |
Table S2. Get Full Table List of one gene significantly associated with 'Time to Death' by Cox regression test
| HazardRatio | Wald_P | Q | C_index | |
|---|---|---|---|---|
| ZFHX4 | 1.64 | 1.27e-06 | 0.024 | 0.574 |
Figure S1. Get High-res Image As an example, this figure shows the association of ZFHX4 to 'Time to Death'. four curves present the cumulative survival rates of 4 quartile subsets of patients. P value = 1.27e-06 with univariate Cox regression analysis using continuous log-2 expression values.
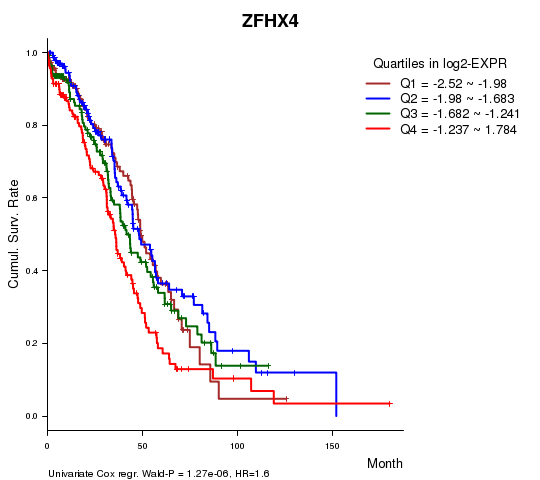
Table S3. Basic characteristics of clinical feature: 'AGE'
| AGE | Mean (SD) | 59.69 (12) |
| Significant markers | N = 178 | |
| pos. correlated | 72 | |
| neg. correlated | 106 |
Table S4. Get Full Table List of top 10 genes significantly correlated to 'AGE' by Spearman correlation test
| SpearmanCorr | corrP | Q | |
|---|---|---|---|
| STS | -0.3021 | 3.889e-13 | 7.25e-09 |
| GREB1 | -0.2914 | 2.762e-12 | 5.15e-08 |
| GNPNAT1 | -0.2909 | 3.005e-12 | 5.6e-08 |
| DEPDC6 | -0.2908 | 3.077e-12 | 5.73e-08 |
| EIF4E3 | -0.284 | 1.02e-11 | 1.9e-07 |
| SLCO1A2 | 0.2838 | 1.06e-11 | 1.97e-07 |
| GEMIN8 | -0.2729 | 6.715e-11 | 1.25e-06 |
| NPAL2 | -0.2697 | 1.136e-10 | 2.12e-06 |
| CCDC91 | 0.269 | 1.268e-10 | 2.36e-06 |
| PRPS2 | -0.2678 | 1.554e-10 | 2.89e-06 |
Figure S2. Get High-res Image As an example, this figure shows the association of STS to 'AGE'. P value = 3.89e-13 with Spearman correlation analysis. The straight line presents the best linear regression.
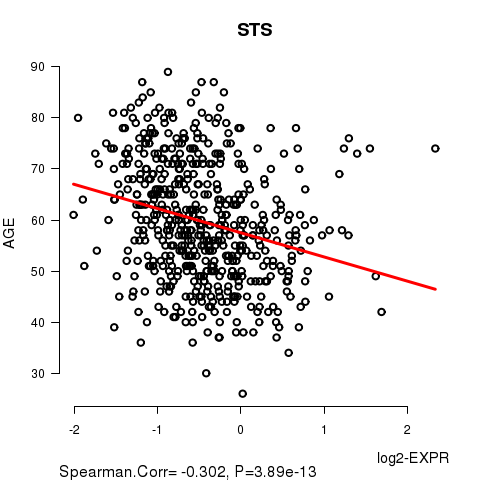
Table S5. Basic characteristics of clinical feature: 'PRIMARY.SITE.OF.DISEASE'
| PRIMARY.SITE.OF.DISEASE | Labels | N |
| OMENTUM | 2 | |
| OVARY | 560 | |
| PERITONEUM (OVARY) | 2 | |
| Significant markers | N = 3 |
Table S6. Get Full Table List of 3 genes differentially expressed by 'PRIMARY.SITE.OF.DISEASE'
| ANOVA_P | Q | |
|---|---|---|
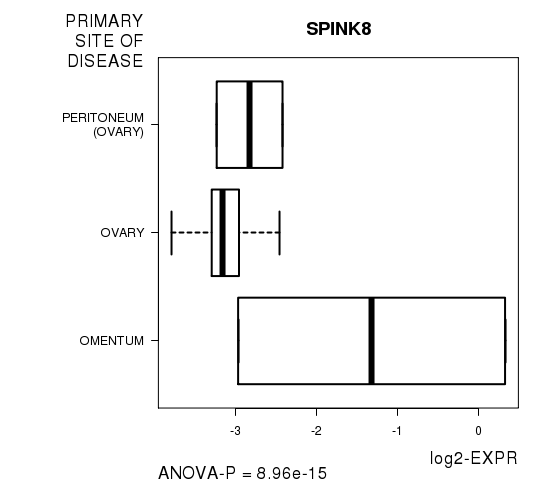
| SPINK8 | 8.956e-15 | 1.67e-10 |
| PTBP1 | 1.585e-08 | 0.000295 |
| EBI3 | 4.421e-07 | 0.00824 |
Figure S3. Get High-res Image As an example, this figure shows the association of SPINK8 to 'PRIMARY.SITE.OF.DISEASE'. P value = 8.96e-15 with ANOVA analysis.
One gene related to 'KARNOFSKY.PERFORMANCE.SCORE'.
Table S7. Basic characteristics of clinical feature: 'KARNOFSKY.PERFORMANCE.SCORE'
| KARNOFSKY.PERFORMANCE.SCORE | Mean (SD) | 75.64 (13) |
| Score | N | |
| 40 | 2 | |
| 60 | 20 | |
| 80 | 49 | |
| 100 | 7 | |
| Significant markers | N = 1 | |
| pos. correlated | 1 | |
| neg. correlated | 0 |
Table S8. Get Full Table List of one gene significantly correlated to 'KARNOFSKY.PERFORMANCE.SCORE' by Spearman correlation test
| SpearmanCorr | corrP | Q | |
|---|---|---|---|
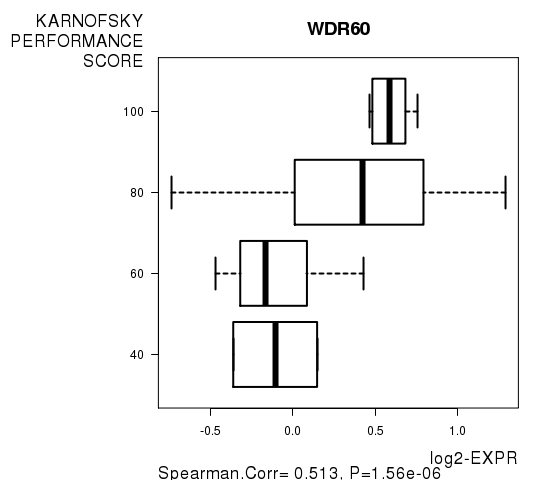
| WDR60 | 0.5131 | 1.561e-06 | 0.0291 |
Figure S4. Get High-res Image As an example, this figure shows the association of WDR60 to 'KARNOFSKY.PERFORMANCE.SCORE'. P value = 1.56e-06 with Spearman correlation analysis.
25 genes related to 'RADIATIONS.RADIATION.REGIMENINDICATION'.
Table S9. Basic characteristics of clinical feature: 'RADIATIONS.RADIATION.REGIMENINDICATION'
| RADIATIONS.RADIATION.REGIMENINDICATION | Labels | N |
| NO | 3 | |
| YES | 561 | |
| Significant markers | N = 25 | |
| Higher in YES | 18 | |
| Higher in NO | 7 |
Table S10. Get Full Table List of top 10 genes differentially expressed by 'RADIATIONS.RADIATION.REGIMENINDICATION'
| T(pos if higher in 'YES') | ttestP | Q | AUC | |
|---|---|---|---|---|
| RAPGEF1 | 21.48 | 9.569e-49 | 1.78e-44 | 0.8378 |
| SNX9 | -15.62 | 4.157e-33 | 7.74e-29 | 0.7623 |
| EIF4G2 | 14.29 | 1.684e-23 | 3.14e-19 | 0.7629 |
| PRRX1 | 13.58 | 9.302e-20 | 1.73e-15 | 0.6542 |
| ZNF507 | -23.25 | 5.634e-15 | 1.05e-10 | 0.9002 |
| ACTL7B | -11.43 | 8.136e-15 | 1.52e-10 | 0.7094 |
| CNKSR2 | -8.76 | 1.192e-14 | 2.22e-10 | 0.7249 |
| AKAP9 | 16.8 | 2.418e-14 | 4.5e-10 | 0.7903 |
| CRIP2 | 9.78 | 3.517e-14 | 6.55e-10 | 0.694 |
| NF2 | 17.14 | 3.701e-13 | 6.89e-09 | 0.8491 |
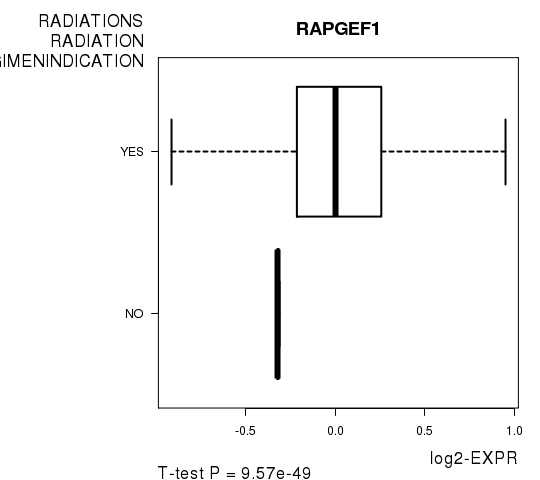
Figure S5. Get High-res Image As an example, this figure shows the association of RAPGEF1 to 'RADIATIONS.RADIATION.REGIMENINDICATION'. P value = 9.57e-49 with T-test analysis.
-
Expresson data file = OV.medianexp.txt
-
Clinical data file = OV.clin.merged.picked.txt
-
Number of patients = 564
-
Number of genes = 18632
-
Number of clinical features = 6
For survival clinical features, Wald's test in univariate Cox regression analysis with proportional hazards model (Andersen and Gill 1982) was used to estimate the P values using the 'coxph' function in R. Kaplan-Meier survival curves were plot using the four quartile subgroups of patients based on expression levels
For continuous numerical clinical features, Spearman's rank correlation coefficients (Spearman 1904) and two-tailed P values were estimated using 'cor.test' function in R
For multi-class clinical features (ordinal or nominal), one-way analysis of variance (Howell 2002) was applied to compare the log2-expression levels between different clinical classes using 'anova' function in R
For two-class clinical features, two-tailed Student's t test with unequal variance (Lehmann and Romano 2005) was applied to compare the log2-expression levels between the two clinical classes using 't.test' function in R
For multiple hypothesis correction, Q value is the False Discovery Rate (FDR) analogue of the P value (Benjamini and Hochberg 1995), defined as the minimum FDR at which the test may be called significant. We used the 'Benjamini and Hochberg' method of 'p.adjust' function in R to convert P values into Q values.
This is an experimental feature. The full results of the analysis summarized in this report can be downloaded from the TCGA Data Coordination Center.