This pipeline computes the correlation between cancer subtypes identified by different molecular patterns and selected clinical features.
Testing the association between subtypes identified by 9 different clustering approaches and 6 clinical features across 566 patients, 11 significant findings detected with P value < 0.05.
-
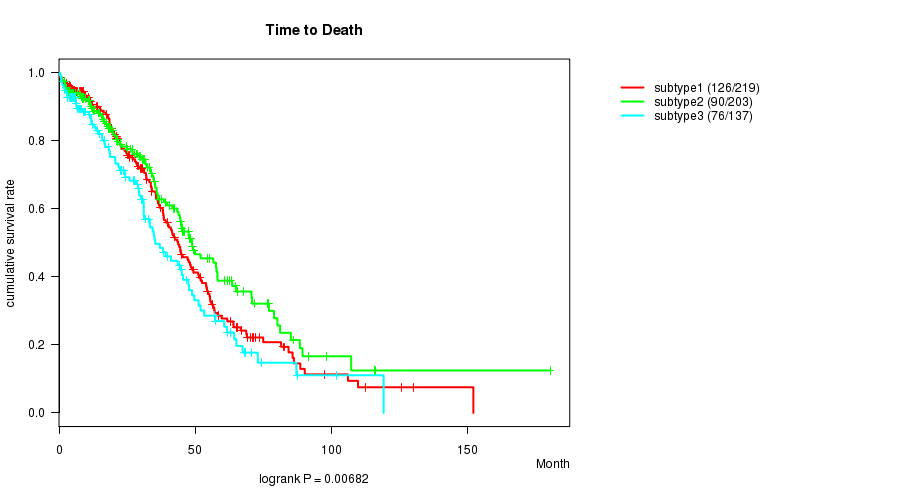
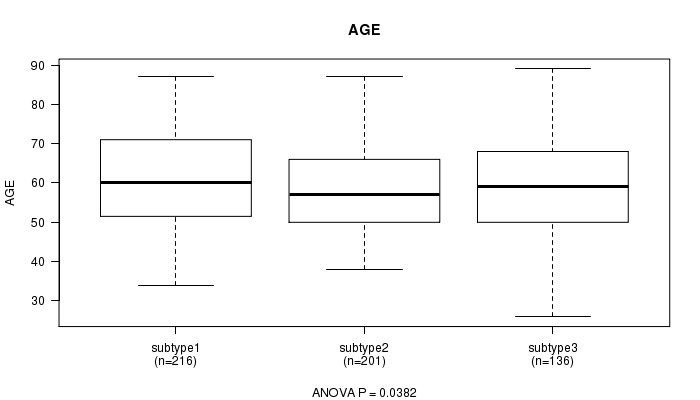
CNMF clustering analysis on array-based mRNA expression data identified 3 subtypes that correlate to 'Time to Death' and 'AGE'.
-
Consensus hierarchical clustering analysis on array-based mRNA expression data identified 3 subtypes that correlate to 'Time to Death' and 'AGE'.
-
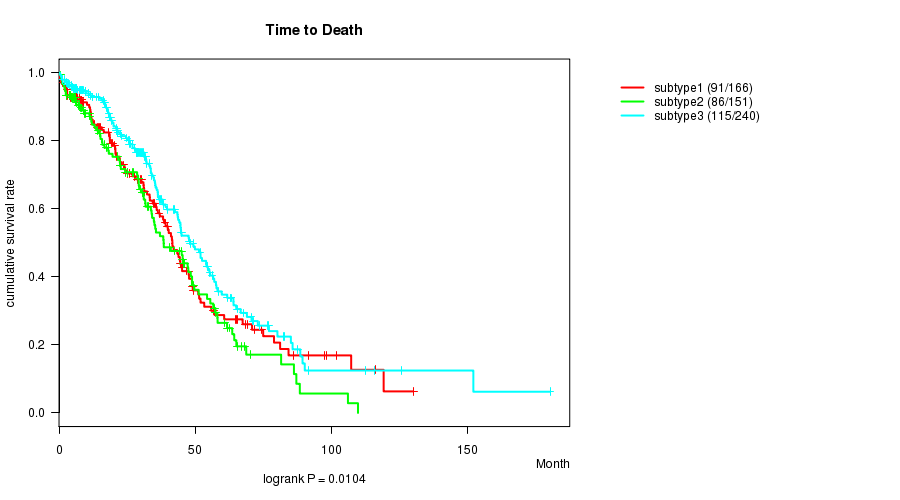
CNMF clustering analysis on array-based miR expression data identified 3 subtypes that correlate to 'Time to Death'.
-
Consensus hierarchical clustering analysis on array-based miR expression data identified 3 subtypes that do not correlate to any clinical features.
-
3 subtypes identified in current cancer cohort by 'METHLYATION CNMF'. These subtypes correlate to 'Time to Death' and 'AGE'.
-
CNMF clustering analysis on sequencing-based mRNA expression data identified 3 subtypes that correlate to 'AGE'.
-
Consensus hierarchical clustering analysis on sequencing-based mRNA expression data identified 3 subtypes that correlate to 'AGE'.
-
CNMF clustering analysis on sequencing-based miR expression data identified 3 subtypes that correlate to 'Time to Death'.
-
Consensus hierarchical clustering analysis on sequencing-based miR expression data identified 3 subtypes that correlate to 'Time to Death'.
Table 1. Get Full Table Overview of the association between subtypes identified by 9 different clustering approaches and 6 clinical features. Shown in the table are P values from statistical tests. Thresholded by P value < 0.05, 11 significant findings detected.
|
Clinical Features |
Time to Death |
AGE |
PRIMARY SITE OF DISEASE |
KARNOFSKY PERFORMANCE SCORE |
RADIATIONS RADIATION REGIMENINDICATION |
NEOADJUVANT THERAPY |
| Statistical Tests | logrank test | ANOVA | Chi-square test | ANOVA | Fisher's exact test | Fisher's exact test |
| mRNA CNMF subtypes | 0.00682 | 0.0382 | 0.577 | 0.0882 | 0.79 | 0.385 |
| mRNA cHierClus subtypes | 0.000224 | 0.012 | 0.608 | 0.205 | 0.609 | 0.486 |
| miR CNMF subtypes | 0.0104 | 0.757 | 0.22 | 0.677 | 0.264 | 0.437 |
| miR cHierClus subtypes | 0.271 | 0.707 | 0.512 | 0.995 | 1 | 0.314 |
| METHLYATION CNMF | 0.0475 | 2.19e-09 | 0.739 | 0.368 | 0.321 | 0.671 |
| RNAseq CNMF subtypes | 0.274 | 0.00136 | 1 | 0.173 | 0.565 | |
| RNAseq cHierClus subtypes | 0.58 | 0.00134 | 1 | 0.453 | 0.691 | |
| MIRseq CNMF subtypes | 0.0208 | 0.53 | 0.385 | 0.113 | 0.476 | 0.704 |
| MIRseq cHierClus subtypes | 0.0354 | 0.353 | 0.809 | 0.382 | 0.284 | 0.461 |
Table S1. Get Full Table Description of clustering approach #1: 'mRNA CNMF subtypes'
| Cluster Labels | 1 | 2 | 3 |
|---|---|---|---|
| Number of samples | 222 | 205 | 137 |
P value = 0.00682 (logrank test)
Table S2. Clustering Approach #1: 'mRNA CNMF subtypes' versus Clinical Feature #1: 'Time to Death'
| nPatients | nDeath | Duration Range (Median), Month | |
|---|---|---|---|
| ALL | 559 | 292 | 0.3 - 180.2 (28.3) |
| subtype1 | 219 | 126 | 0.3 - 152.0 (29.2) |
| subtype2 | 203 | 90 | 0.4 - 180.2 (28.6) |
| subtype3 | 137 | 76 | 0.3 - 119.1 (24.3) |
Figure S1. Get High-res Image Clustering Approach #1: 'mRNA CNMF subtypes' versus Clinical Feature #1: 'Time to Death'
P value = 0.0382 (ANOVA)
Table S3. Clustering Approach #1: 'mRNA CNMF subtypes' versus Clinical Feature #2: 'AGE'
| nPatients | Mean (Std.Dev) | |
|---|---|---|
| ALL | 553 | 59.7 (11.6) |
| subtype1 | 216 | 61.2 (11.6) |
| subtype2 | 201 | 58.4 (10.9) |
| subtype3 | 136 | 59.2 (12.4) |
Figure S2. Get High-res Image Clustering Approach #1: 'mRNA CNMF subtypes' versus Clinical Feature #2: 'AGE'
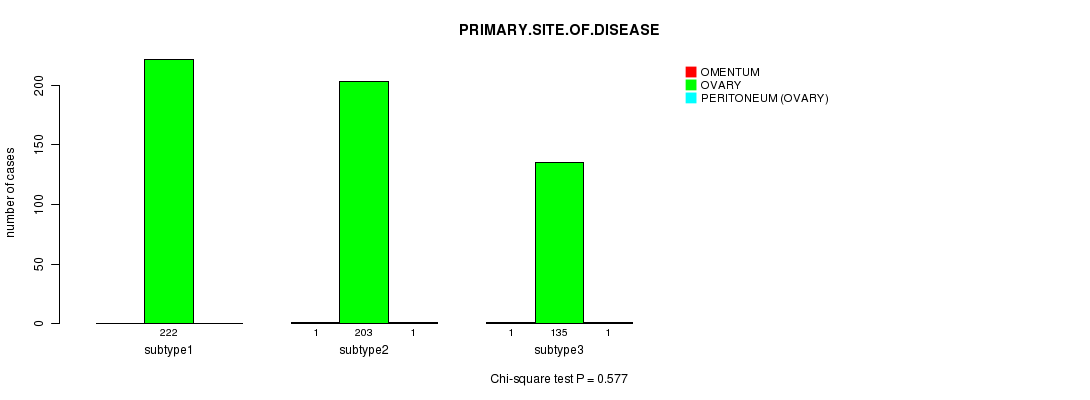
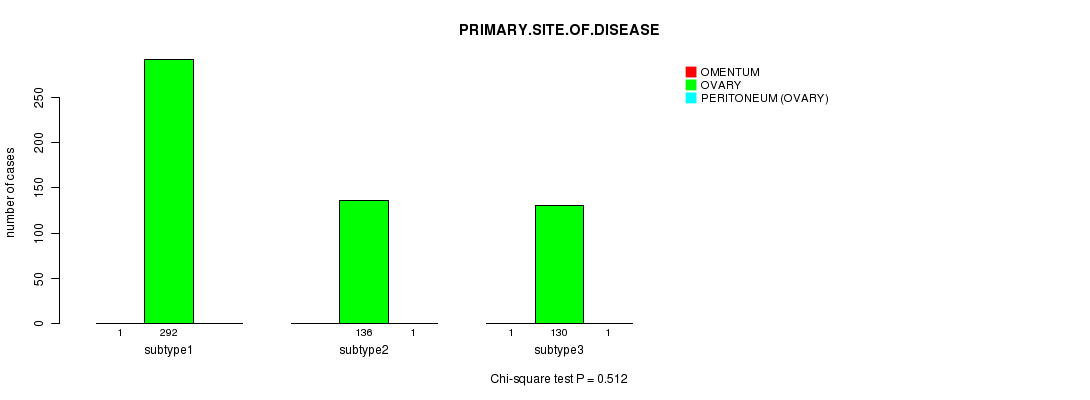
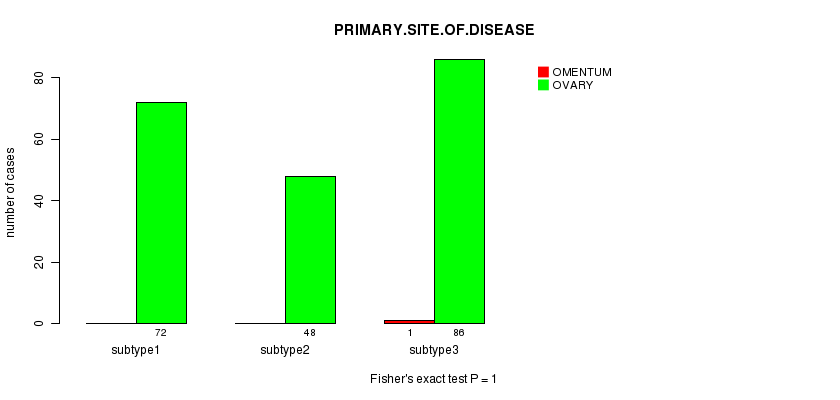
P value = 0.577 (Chi-square test)
Table S4. Clustering Approach #1: 'mRNA CNMF subtypes' versus Clinical Feature #3: 'PRIMARY.SITE.OF.DISEASE'
| nPatients | OMENTUM | OVARY | PERITONEUM (OVARY) |
|---|---|---|---|
| ALL | 2 | 560 | 2 |
| subtype1 | 0 | 222 | 0 |
| subtype2 | 1 | 203 | 1 |
| subtype3 | 1 | 135 | 1 |
Figure S3. Get High-res Image Clustering Approach #1: 'mRNA CNMF subtypes' versus Clinical Feature #3: 'PRIMARY.SITE.OF.DISEASE'
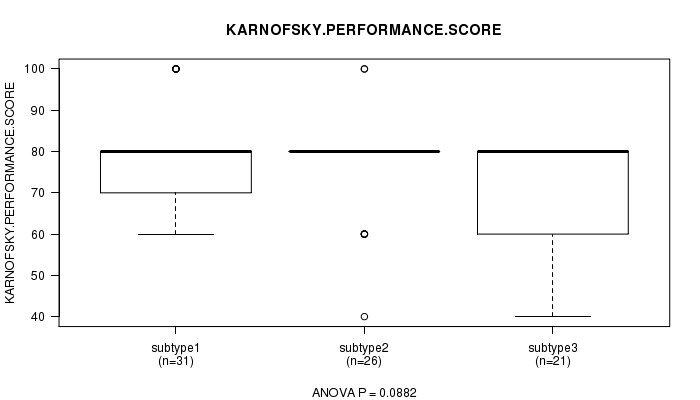
P value = 0.0882 (ANOVA)
Table S5. Clustering Approach #1: 'mRNA CNMF subtypes' versus Clinical Feature #4: 'KARNOFSKY.PERFORMANCE.SCORE'
| nPatients | Mean (Std.Dev) | |
|---|---|---|
| ALL | 78 | 75.6 (12.8) |
| subtype1 | 31 | 78.1 (13.0) |
| subtype2 | 26 | 76.9 (12.3) |
| subtype3 | 21 | 70.5 (12.0) |
Figure S4. Get High-res Image Clustering Approach #1: 'mRNA CNMF subtypes' versus Clinical Feature #4: 'KARNOFSKY.PERFORMANCE.SCORE'
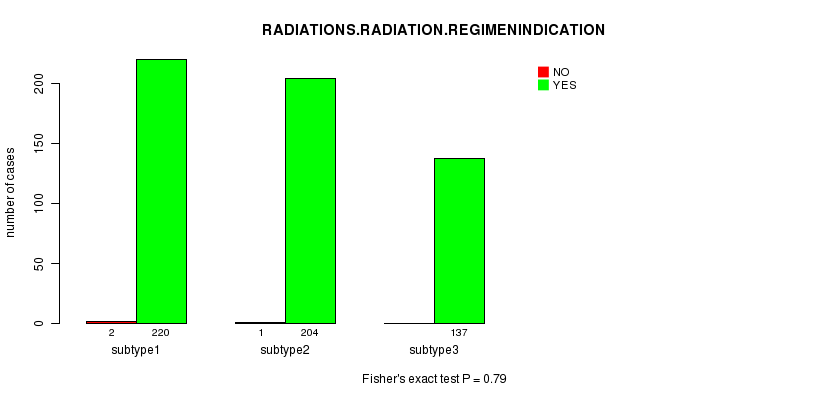
P value = 0.79 (Fisher's exact test)
Table S6. Clustering Approach #1: 'mRNA CNMF subtypes' versus Clinical Feature #5: 'RADIATIONS.RADIATION.REGIMENINDICATION'
| nPatients | NO | YES |
|---|---|---|
| ALL | 561 | 3 |
| subtype1 | 220 | 2 |
| subtype2 | 204 | 1 |
| subtype3 | 137 | 0 |
Figure S5. Get High-res Image Clustering Approach #1: 'mRNA CNMF subtypes' versus Clinical Feature #5: 'RADIATIONS.RADIATION.REGIMENINDICATION'
P value = 0.385 (Fisher's exact test)
Table S7. Clustering Approach #1: 'mRNA CNMF subtypes' versus Clinical Feature #6: 'NEOADJUVANT.THERAPY'
| nPatients | NO | YES |
|---|---|---|
| ALL | 456 | 108 |
| subtype1 | 173 | 49 |
| subtype2 | 170 | 35 |
| subtype3 | 113 | 24 |
Figure S6. Get High-res Image Clustering Approach #1: 'mRNA CNMF subtypes' versus Clinical Feature #6: 'NEOADJUVANT.THERAPY'
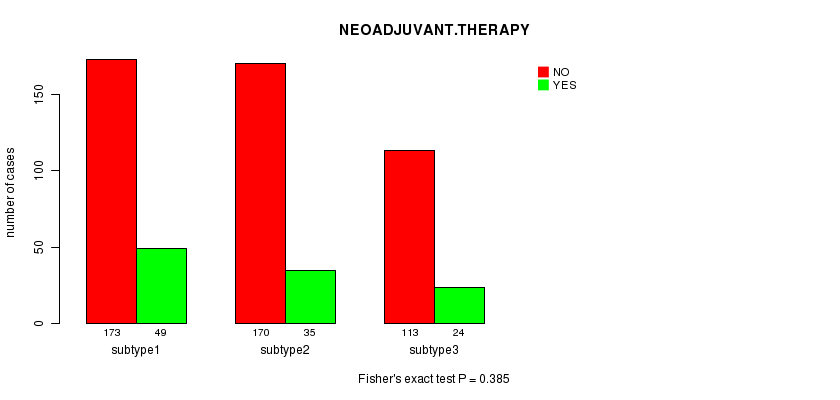
Table S8. Get Full Table Description of clustering approach #2: 'mRNA cHierClus subtypes'
| Cluster Labels | 1 | 2 | 3 |
|---|---|---|---|
| Number of samples | 240 | 130 | 194 |
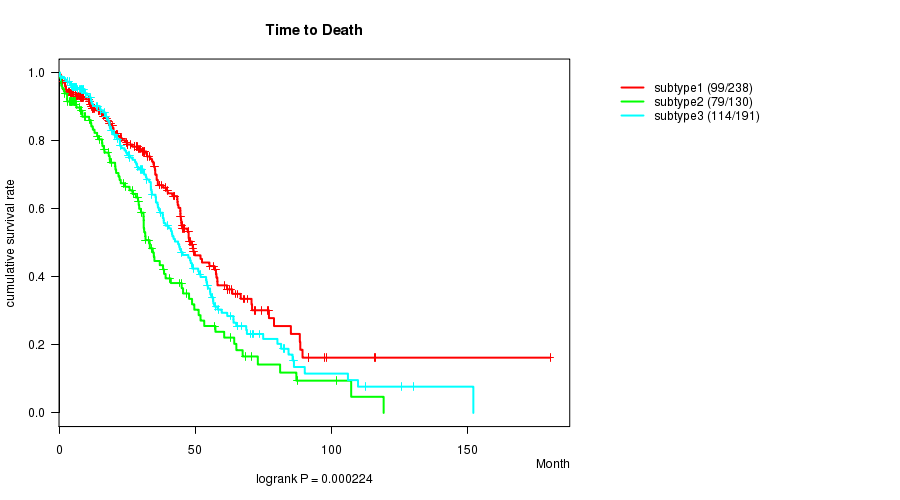
P value = 0.000224 (logrank test)
Table S9. Clustering Approach #2: 'mRNA cHierClus subtypes' versus Clinical Feature #1: 'Time to Death'
| nPatients | nDeath | Duration Range (Median), Month | |
|---|---|---|---|
| ALL | 559 | 292 | 0.3 - 180.2 (28.3) |
| subtype1 | 238 | 99 | 0.3 - 180.2 (27.3) |
| subtype2 | 130 | 79 | 0.3 - 119.1 (24.3) |
| subtype3 | 191 | 114 | 0.3 - 152.0 (31.2) |
Figure S7. Get High-res Image Clustering Approach #2: 'mRNA cHierClus subtypes' versus Clinical Feature #1: 'Time to Death'
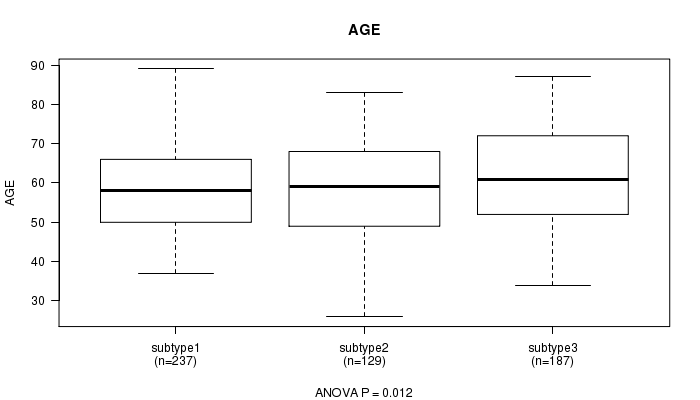
P value = 0.012 (ANOVA)
Table S10. Clustering Approach #2: 'mRNA cHierClus subtypes' versus Clinical Feature #2: 'AGE'
| nPatients | Mean (Std.Dev) | |
|---|---|---|
| ALL | 553 | 59.7 (11.6) |
| subtype1 | 237 | 58.7 (11.1) |
| subtype2 | 129 | 58.5 (12.2) |
| subtype3 | 187 | 61.7 (11.7) |
Figure S8. Get High-res Image Clustering Approach #2: 'mRNA cHierClus subtypes' versus Clinical Feature #2: 'AGE'
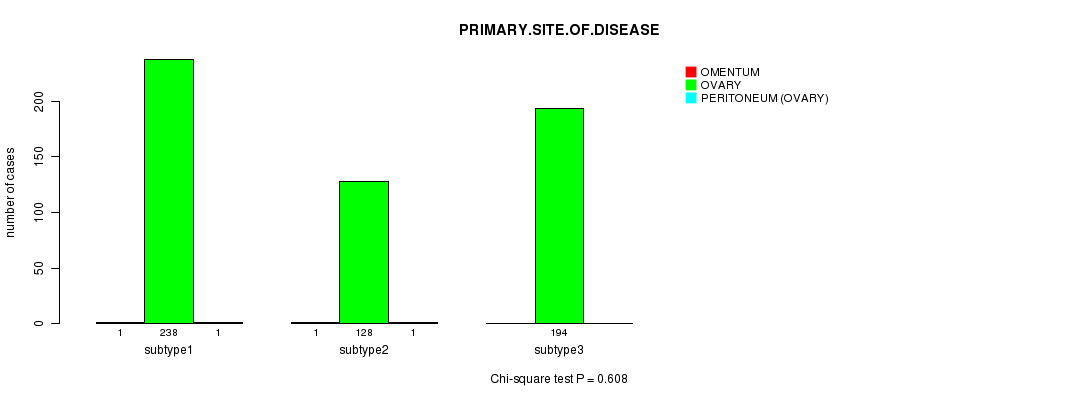
P value = 0.608 (Chi-square test)
Table S11. Clustering Approach #2: 'mRNA cHierClus subtypes' versus Clinical Feature #3: 'PRIMARY.SITE.OF.DISEASE'
| nPatients | OMENTUM | OVARY | PERITONEUM (OVARY) |
|---|---|---|---|
| ALL | 2 | 560 | 2 |
| subtype1 | 1 | 238 | 1 |
| subtype2 | 1 | 128 | 1 |
| subtype3 | 0 | 194 | 0 |
Figure S9. Get High-res Image Clustering Approach #2: 'mRNA cHierClus subtypes' versus Clinical Feature #3: 'PRIMARY.SITE.OF.DISEASE'
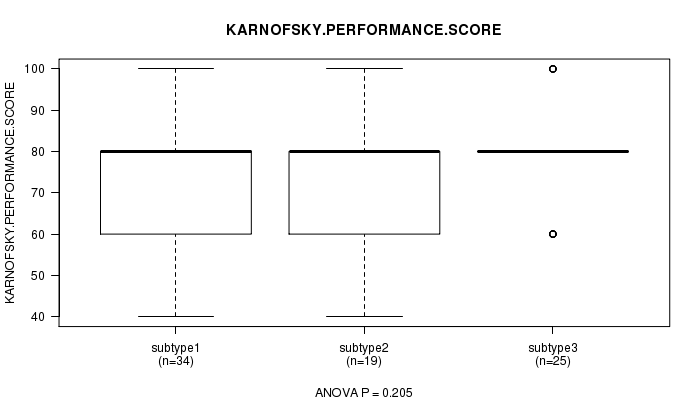
P value = 0.205 (ANOVA)
Table S12. Clustering Approach #2: 'mRNA cHierClus subtypes' versus Clinical Feature #4: 'KARNOFSKY.PERFORMANCE.SCORE'
| nPatients | Mean (Std.Dev) | |
|---|---|---|
| ALL | 78 | 75.6 (12.8) |
| subtype1 | 34 | 74.7 (11.3) |
| subtype2 | 19 | 72.6 (13.7) |
| subtype3 | 25 | 79.2 (13.5) |
Figure S10. Get High-res Image Clustering Approach #2: 'mRNA cHierClus subtypes' versus Clinical Feature #4: 'KARNOFSKY.PERFORMANCE.SCORE'
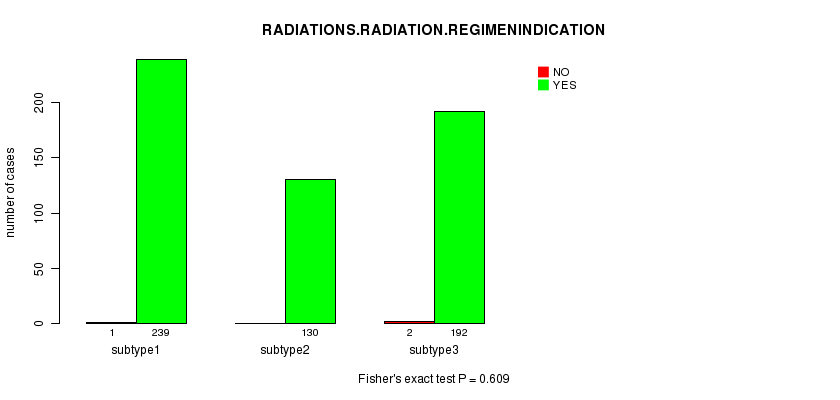
P value = 0.609 (Fisher's exact test)
Table S13. Clustering Approach #2: 'mRNA cHierClus subtypes' versus Clinical Feature #5: 'RADIATIONS.RADIATION.REGIMENINDICATION'
| nPatients | NO | YES |
|---|---|---|
| ALL | 561 | 3 |
| subtype1 | 239 | 1 |
| subtype2 | 130 | 0 |
| subtype3 | 192 | 2 |
Figure S11. Get High-res Image Clustering Approach #2: 'mRNA cHierClus subtypes' versus Clinical Feature #5: 'RADIATIONS.RADIATION.REGIMENINDICATION'
P value = 0.486 (Fisher's exact test)
Table S14. Clustering Approach #2: 'mRNA cHierClus subtypes' versus Clinical Feature #6: 'NEOADJUVANT.THERAPY'
| nPatients | NO | YES |
|---|---|---|
| ALL | 456 | 108 |
| subtype1 | 199 | 41 |
| subtype2 | 105 | 25 |
| subtype3 | 152 | 42 |
Figure S12. Get High-res Image Clustering Approach #2: 'mRNA cHierClus subtypes' versus Clinical Feature #6: 'NEOADJUVANT.THERAPY'
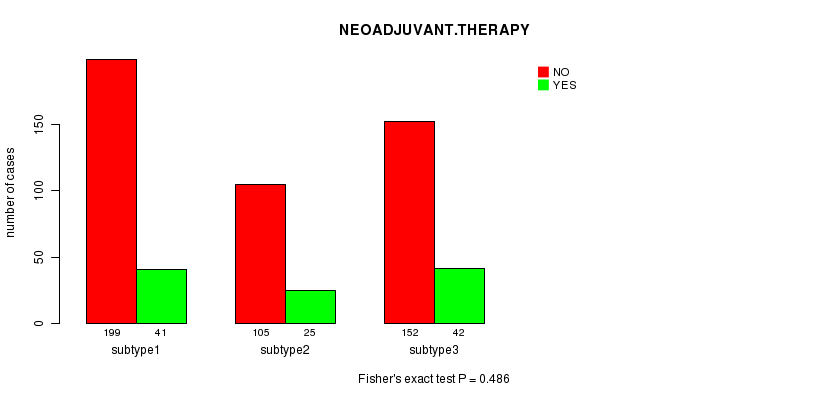
Table S15. Get Full Table Description of clustering approach #3: 'miR CNMF subtypes'
| Cluster Labels | 1 | 2 | 3 |
|---|---|---|---|
| Number of samples | 167 | 154 | 241 |
P value = 0.0104 (logrank test)
Table S16. Clustering Approach #3: 'miR CNMF subtypes' versus Clinical Feature #1: 'Time to Death'
| nPatients | nDeath | Duration Range (Median), Month | |
|---|---|---|---|
| ALL | 557 | 292 | 0.3 - 180.2 (28.2) |
| subtype1 | 166 | 91 | 0.3 - 130.0 (26.4) |
| subtype2 | 151 | 86 | 0.3 - 109.7 (25.1) |
| subtype3 | 240 | 115 | 0.3 - 180.2 (29.3) |
Figure S13. Get High-res Image Clustering Approach #3: 'miR CNMF subtypes' versus Clinical Feature #1: 'Time to Death'
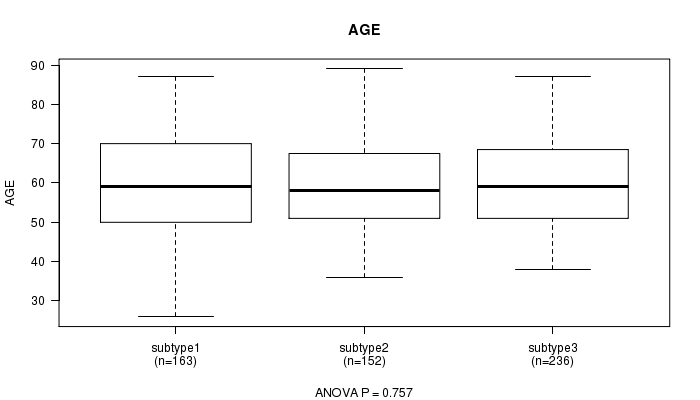
P value = 0.757 (ANOVA)
Table S17. Clustering Approach #3: 'miR CNMF subtypes' versus Clinical Feature #2: 'AGE'
| nPatients | Mean (Std.Dev) | |
|---|---|---|
| ALL | 551 | 59.7 (11.6) |
| subtype1 | 163 | 59.7 (12.4) |
| subtype2 | 152 | 59.1 (11.6) |
| subtype3 | 236 | 60.0 (11.1) |
Figure S14. Get High-res Image Clustering Approach #3: 'miR CNMF subtypes' versus Clinical Feature #2: 'AGE'
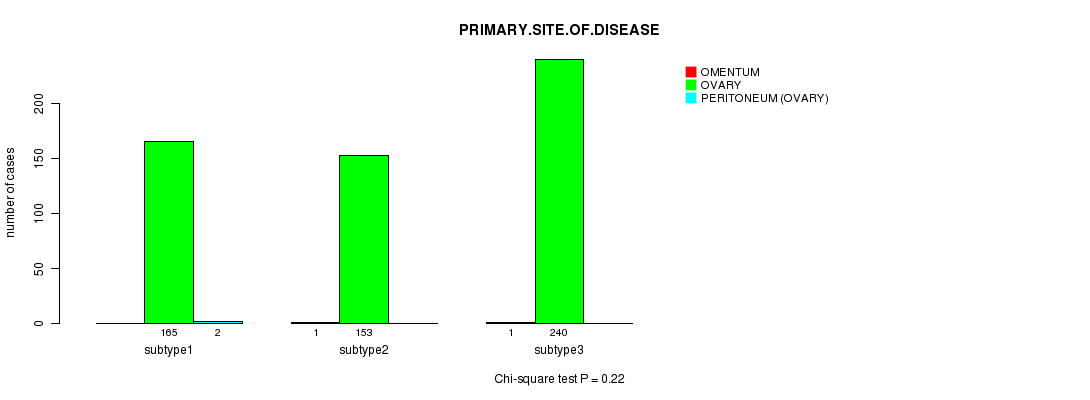
P value = 0.22 (Chi-square test)
Table S18. Clustering Approach #3: 'miR CNMF subtypes' versus Clinical Feature #3: 'PRIMARY.SITE.OF.DISEASE'
| nPatients | OMENTUM | OVARY | PERITONEUM (OVARY) |
|---|---|---|---|
| ALL | 2 | 558 | 2 |
| subtype1 | 0 | 165 | 2 |
| subtype2 | 1 | 153 | 0 |
| subtype3 | 1 | 240 | 0 |
Figure S15. Get High-res Image Clustering Approach #3: 'miR CNMF subtypes' versus Clinical Feature #3: 'PRIMARY.SITE.OF.DISEASE'
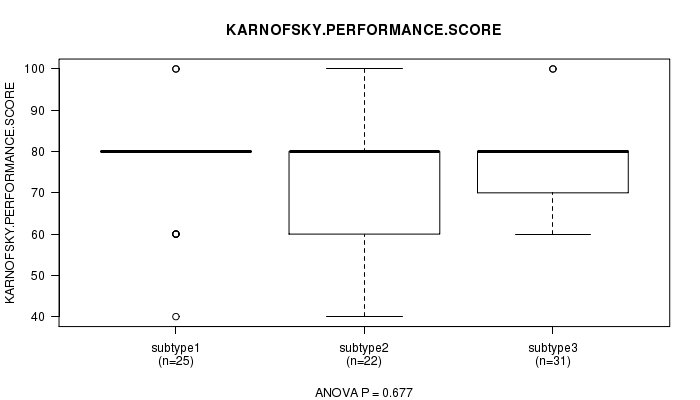
P value = 0.677 (ANOVA)
Table S19. Clustering Approach #3: 'miR CNMF subtypes' versus Clinical Feature #4: 'KARNOFSKY.PERFORMANCE.SCORE'
| nPatients | Mean (Std.Dev) | |
|---|---|---|
| ALL | 78 | 75.6 (12.8) |
| subtype1 | 25 | 76.8 (12.5) |
| subtype2 | 22 | 73.6 (15.6) |
| subtype3 | 31 | 76.1 (10.9) |
Figure S16. Get High-res Image Clustering Approach #3: 'miR CNMF subtypes' versus Clinical Feature #4: 'KARNOFSKY.PERFORMANCE.SCORE'
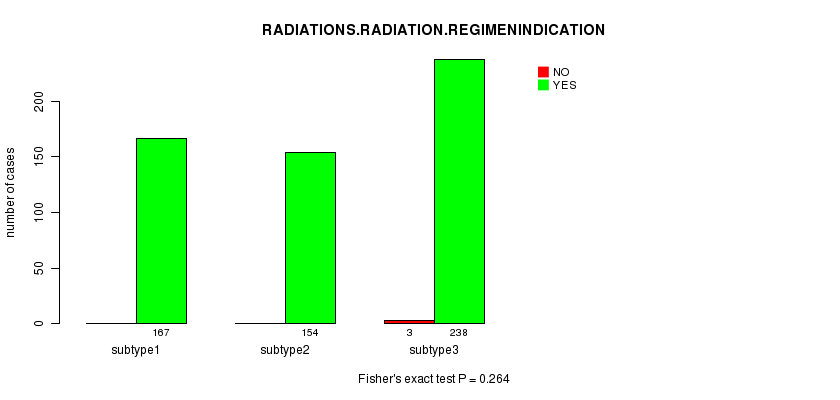
P value = 0.264 (Fisher's exact test)
Table S20. Clustering Approach #3: 'miR CNMF subtypes' versus Clinical Feature #5: 'RADIATIONS.RADIATION.REGIMENINDICATION'
| nPatients | NO | YES |
|---|---|---|
| ALL | 559 | 3 |
| subtype1 | 167 | 0 |
| subtype2 | 154 | 0 |
| subtype3 | 238 | 3 |
Figure S17. Get High-res Image Clustering Approach #3: 'miR CNMF subtypes' versus Clinical Feature #5: 'RADIATIONS.RADIATION.REGIMENINDICATION'
P value = 0.437 (Fisher's exact test)
Table S21. Clustering Approach #3: 'miR CNMF subtypes' versus Clinical Feature #6: 'NEOADJUVANT.THERAPY'
| nPatients | NO | YES |
|---|---|---|
| ALL | 454 | 108 |
| subtype1 | 137 | 30 |
| subtype2 | 119 | 35 |
| subtype3 | 198 | 43 |
Figure S18. Get High-res Image Clustering Approach #3: 'miR CNMF subtypes' versus Clinical Feature #6: 'NEOADJUVANT.THERAPY'
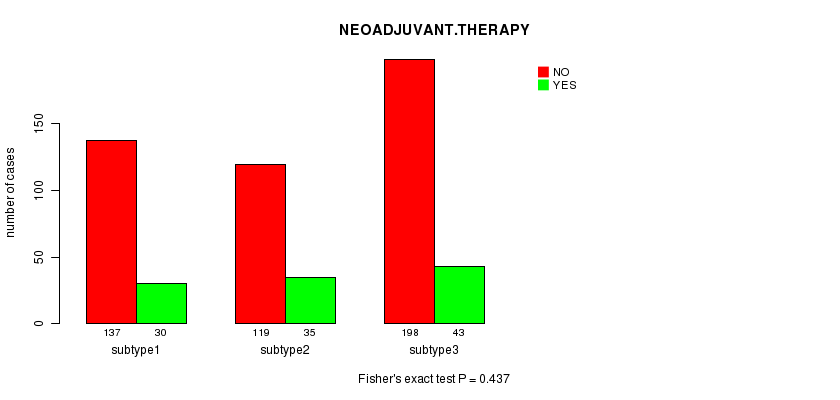
Table S22. Get Full Table Description of clustering approach #4: 'miR cHierClus subtypes'
| Cluster Labels | 1 | 2 | 3 |
|---|---|---|---|
| Number of samples | 293 | 137 | 132 |
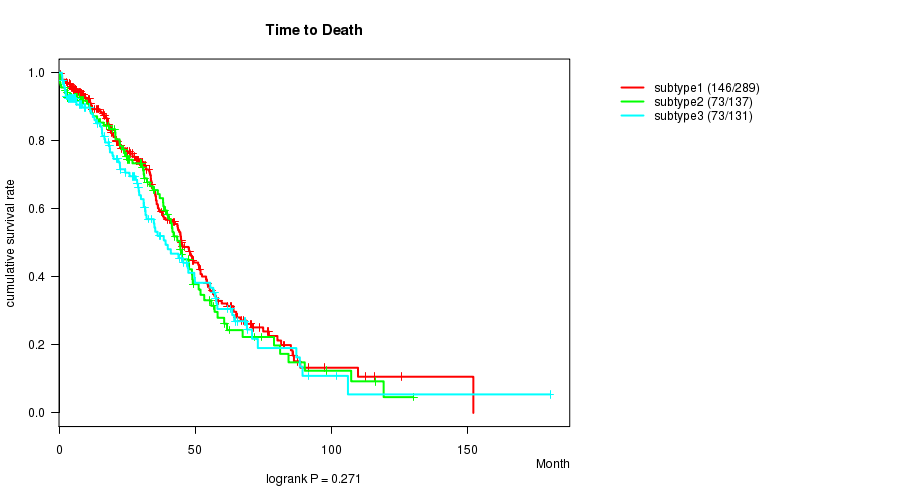
P value = 0.271 (logrank test)
Table S23. Clustering Approach #4: 'miR cHierClus subtypes' versus Clinical Feature #1: 'Time to Death'
| nPatients | nDeath | Duration Range (Median), Month | |
|---|---|---|---|
| ALL | 557 | 292 | 0.3 - 180.2 (28.2) |
| subtype1 | 289 | 146 | 0.3 - 152.0 (28.5) |
| subtype2 | 137 | 73 | 0.3 - 130.0 (29.8) |
| subtype3 | 131 | 73 | 1.0 - 180.2 (27.5) |
Figure S19. Get High-res Image Clustering Approach #4: 'miR cHierClus subtypes' versus Clinical Feature #1: 'Time to Death'
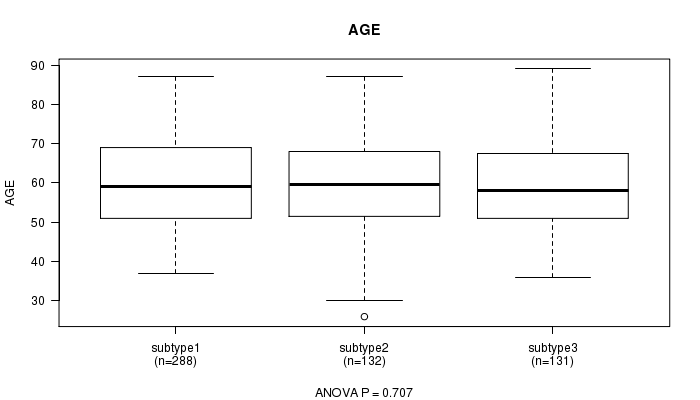
P value = 0.707 (ANOVA)
Table S24. Clustering Approach #4: 'miR cHierClus subtypes' versus Clinical Feature #2: 'AGE'
| nPatients | Mean (Std.Dev) | |
|---|---|---|
| ALL | 551 | 59.7 (11.6) |
| subtype1 | 288 | 60.1 (11.5) |
| subtype2 | 132 | 59.4 (12.0) |
| subtype3 | 131 | 59.1 (11.5) |
Figure S20. Get High-res Image Clustering Approach #4: 'miR cHierClus subtypes' versus Clinical Feature #2: 'AGE'
P value = 0.512 (Chi-square test)
Table S25. Clustering Approach #4: 'miR cHierClus subtypes' versus Clinical Feature #3: 'PRIMARY.SITE.OF.DISEASE'
| nPatients | OMENTUM | OVARY | PERITONEUM (OVARY) |
|---|---|---|---|
| ALL | 2 | 558 | 2 |
| subtype1 | 1 | 292 | 0 |
| subtype2 | 0 | 136 | 1 |
| subtype3 | 1 | 130 | 1 |
Figure S21. Get High-res Image Clustering Approach #4: 'miR cHierClus subtypes' versus Clinical Feature #3: 'PRIMARY.SITE.OF.DISEASE'
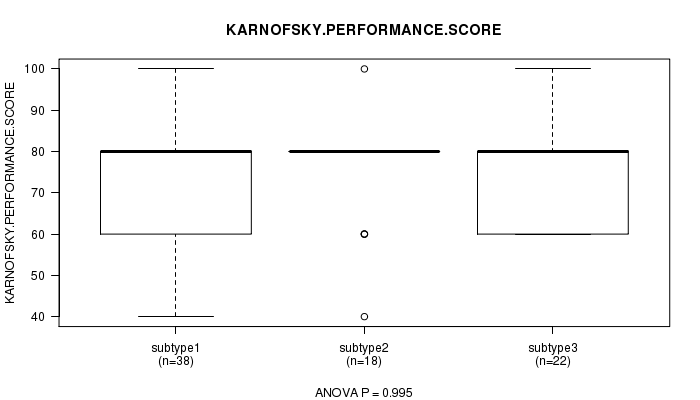
P value = 0.995 (ANOVA)
Table S26. Clustering Approach #4: 'miR cHierClus subtypes' versus Clinical Feature #4: 'KARNOFSKY.PERFORMANCE.SCORE'
| nPatients | Mean (Std.Dev) | |
|---|---|---|
| ALL | 78 | 75.6 (12.8) |
| subtype1 | 38 | 75.8 (13.3) |
| subtype2 | 18 | 75.6 (12.9) |
| subtype3 | 22 | 75.5 (12.2) |
Figure S22. Get High-res Image Clustering Approach #4: 'miR cHierClus subtypes' versus Clinical Feature #4: 'KARNOFSKY.PERFORMANCE.SCORE'
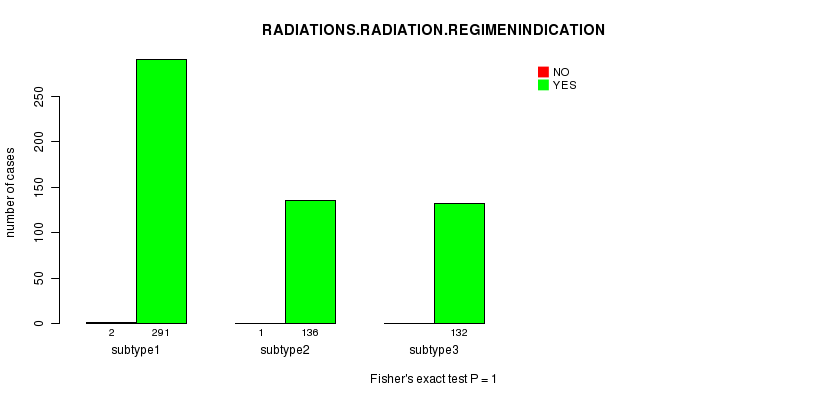
P value = 1 (Fisher's exact test)
Table S27. Clustering Approach #4: 'miR cHierClus subtypes' versus Clinical Feature #5: 'RADIATIONS.RADIATION.REGIMENINDICATION'
| nPatients | NO | YES |
|---|---|---|
| ALL | 559 | 3 |
| subtype1 | 291 | 2 |
| subtype2 | 136 | 1 |
| subtype3 | 132 | 0 |
Figure S23. Get High-res Image Clustering Approach #4: 'miR cHierClus subtypes' versus Clinical Feature #5: 'RADIATIONS.RADIATION.REGIMENINDICATION'
P value = 0.314 (Fisher's exact test)
Table S28. Clustering Approach #4: 'miR cHierClus subtypes' versus Clinical Feature #6: 'NEOADJUVANT.THERAPY'
| nPatients | NO | YES |
|---|---|---|
| ALL | 454 | 108 |
| subtype1 | 236 | 57 |
| subtype2 | 116 | 21 |
| subtype3 | 102 | 30 |
Figure S24. Get High-res Image Clustering Approach #4: 'miR cHierClus subtypes' versus Clinical Feature #6: 'NEOADJUVANT.THERAPY'
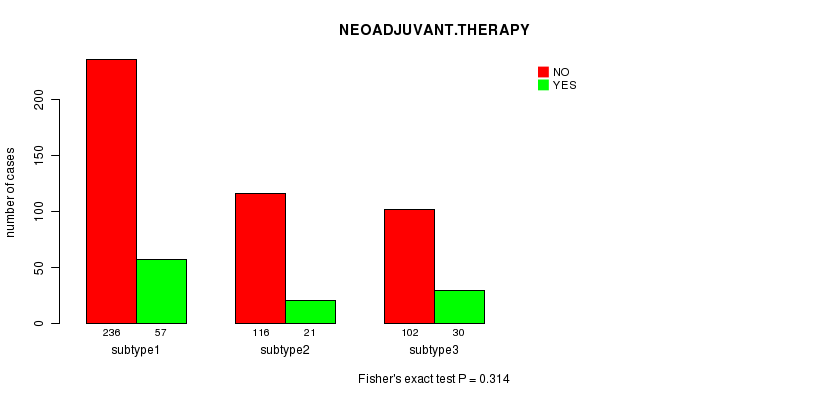
Table S29. Get Full Table Description of clustering approach #5: 'METHLYATION CNMF'
| Cluster Labels | 1 | 2 | 3 |
|---|---|---|---|
| Number of samples | 186 | 177 | 186 |
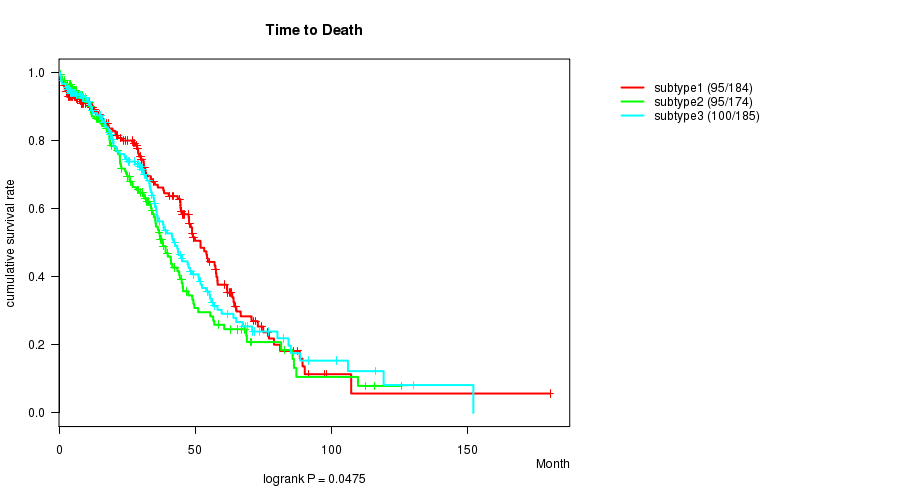
P value = 0.0475 (logrank test)
Table S30. Clustering Approach #5: 'METHLYATION CNMF' versus Clinical Feature #1: 'Time to Death'
| nPatients | nDeath | Duration Range (Median), Month | |
|---|---|---|---|
| ALL | 543 | 290 | 0.3 - 180.2 (29.0) |
| subtype1 | 184 | 95 | 0.3 - 180.2 (30.1) |
| subtype2 | 174 | 95 | 0.4 - 125.7 (25.9) |
| subtype3 | 185 | 100 | 0.4 - 152.0 (29.5) |
Figure S25. Get High-res Image Clustering Approach #5: 'METHLYATION CNMF' versus Clinical Feature #1: 'Time to Death'
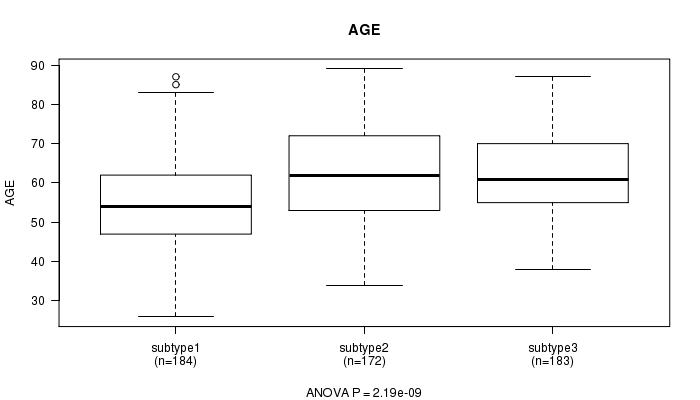
P value = 2.19e-09 (ANOVA)
Table S31. Clustering Approach #5: 'METHLYATION CNMF' versus Clinical Feature #2: 'AGE'
| nPatients | Mean (Std.Dev) | |
|---|---|---|
| ALL | 539 | 59.7 (11.7) |
| subtype1 | 184 | 55.4 (11.3) |
| subtype2 | 172 | 61.9 (12.1) |
| subtype3 | 183 | 62.1 (10.4) |
Figure S26. Get High-res Image Clustering Approach #5: 'METHLYATION CNMF' versus Clinical Feature #2: 'AGE'
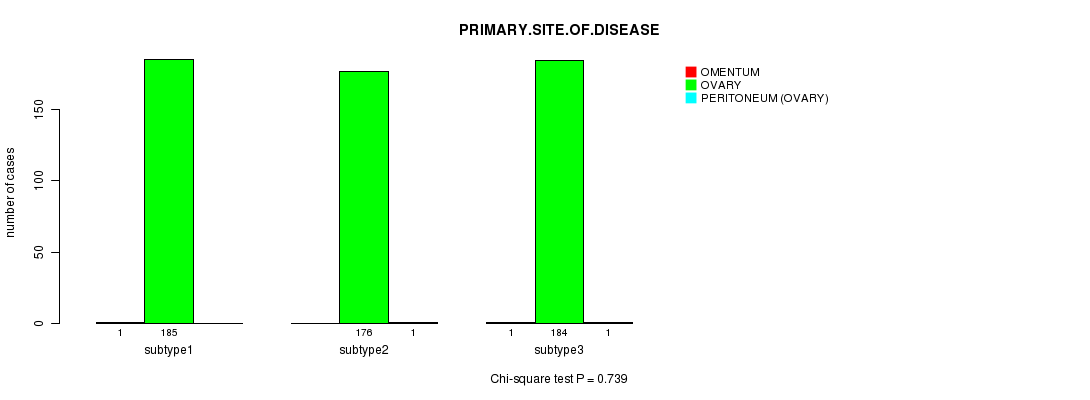
P value = 0.739 (Chi-square test)
Table S32. Clustering Approach #5: 'METHLYATION CNMF' versus Clinical Feature #3: 'PRIMARY.SITE.OF.DISEASE'
| nPatients | OMENTUM | OVARY | PERITONEUM (OVARY) |
|---|---|---|---|
| ALL | 2 | 545 | 2 |
| subtype1 | 1 | 185 | 0 |
| subtype2 | 0 | 176 | 1 |
| subtype3 | 1 | 184 | 1 |
Figure S27. Get High-res Image Clustering Approach #5: 'METHLYATION CNMF' versus Clinical Feature #3: 'PRIMARY.SITE.OF.DISEASE'
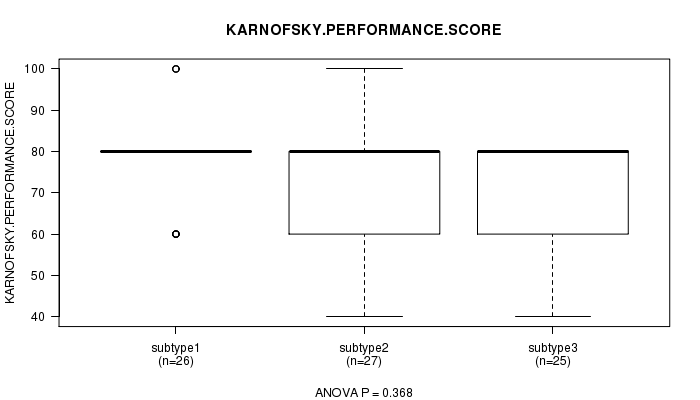
P value = 0.368 (ANOVA)
Table S33. Clustering Approach #5: 'METHLYATION CNMF' versus Clinical Feature #4: 'KARNOFSKY.PERFORMANCE.SCORE'
| nPatients | Mean (Std.Dev) | |
|---|---|---|
| ALL | 78 | 75.6 (12.8) |
| subtype1 | 26 | 78.5 (11.2) |
| subtype2 | 27 | 74.8 (15.3) |
| subtype3 | 25 | 73.6 (11.1) |
Figure S28. Get High-res Image Clustering Approach #5: 'METHLYATION CNMF' versus Clinical Feature #4: 'KARNOFSKY.PERFORMANCE.SCORE'
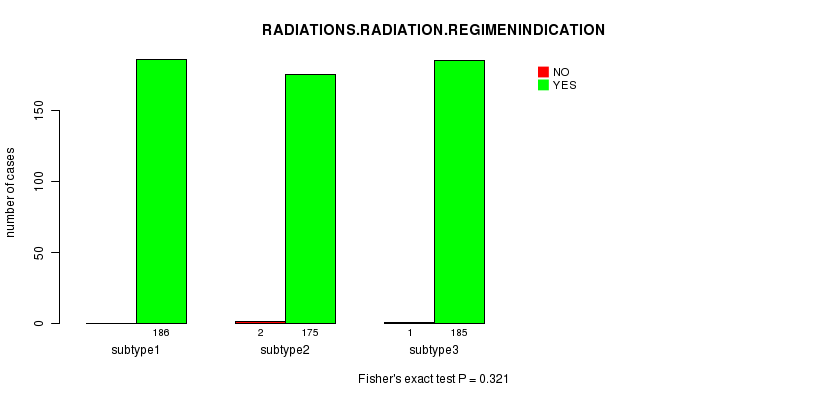
P value = 0.321 (Fisher's exact test)
Table S34. Clustering Approach #5: 'METHLYATION CNMF' versus Clinical Feature #5: 'RADIATIONS.RADIATION.REGIMENINDICATION'
| nPatients | NO | YES |
|---|---|---|
| ALL | 546 | 3 |
| subtype1 | 186 | 0 |
| subtype2 | 175 | 2 |
| subtype3 | 185 | 1 |
Figure S29. Get High-res Image Clustering Approach #5: 'METHLYATION CNMF' versus Clinical Feature #5: 'RADIATIONS.RADIATION.REGIMENINDICATION'
P value = 0.671 (Fisher's exact test)
Table S35. Clustering Approach #5: 'METHLYATION CNMF' versus Clinical Feature #6: 'NEOADJUVANT.THERAPY'
| nPatients | NO | YES |
|---|---|---|
| ALL | 441 | 108 |
| subtype1 | 149 | 37 |
| subtype2 | 139 | 38 |
| subtype3 | 153 | 33 |
Figure S30. Get High-res Image Clustering Approach #5: 'METHLYATION CNMF' versus Clinical Feature #6: 'NEOADJUVANT.THERAPY'
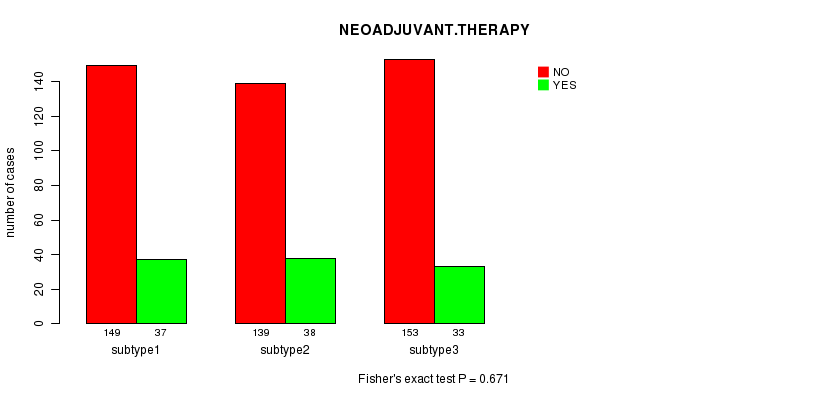
Table S36. Get Full Table Description of clustering approach #6: 'RNAseq CNMF subtypes'
| Cluster Labels | 1 | 2 | 3 |
|---|---|---|---|
| Number of samples | 72 | 48 | 87 |
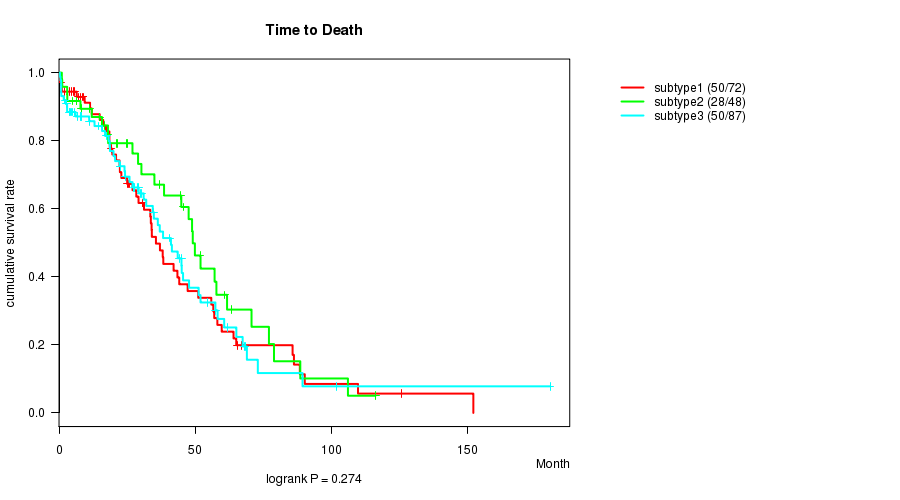
P value = 0.274 (logrank test)
Table S37. Clustering Approach #6: 'RNAseq CNMF subtypes' versus Clinical Feature #1: 'Time to Death'
| nPatients | nDeath | Duration Range (Median), Month | |
|---|---|---|---|
| ALL | 207 | 128 | 0.3 - 180.2 (27.0) |
| subtype1 | 72 | 50 | 0.3 - 152.0 (26.4) |
| subtype2 | 48 | 28 | 1.0 - 116.1 (29.6) |
| subtype3 | 87 | 50 | 0.4 - 180.2 (25.9) |
Figure S31. Get High-res Image Clustering Approach #6: 'RNAseq CNMF subtypes' versus Clinical Feature #1: 'Time to Death'
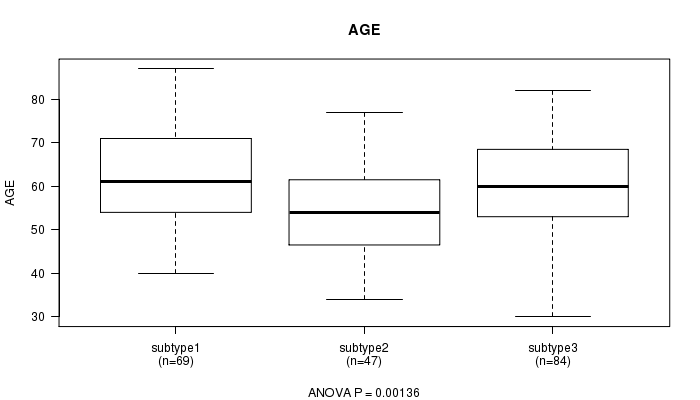
P value = 0.00136 (ANOVA)
Table S38. Clustering Approach #6: 'RNAseq CNMF subtypes' versus Clinical Feature #2: 'AGE'
| nPatients | Mean (Std.Dev) | |
|---|---|---|
| ALL | 200 | 59.7 (11.2) |
| subtype1 | 69 | 62.2 (11.2) |
| subtype2 | 47 | 54.8 (10.2) |
| subtype3 | 84 | 60.4 (10.9) |
Figure S32. Get High-res Image Clustering Approach #6: 'RNAseq CNMF subtypes' versus Clinical Feature #2: 'AGE'
P value = 1 (Fisher's exact test)
Table S39. Clustering Approach #6: 'RNAseq CNMF subtypes' versus Clinical Feature #3: 'PRIMARY.SITE.OF.DISEASE'
| nPatients | OMENTUM | OVARY |
|---|---|---|
| ALL | 1 | 206 |
| subtype1 | 0 | 72 |
| subtype2 | 0 | 48 |
| subtype3 | 1 | 86 |
Figure S33. Get High-res Image Clustering Approach #6: 'RNAseq CNMF subtypes' versus Clinical Feature #3: 'PRIMARY.SITE.OF.DISEASE'
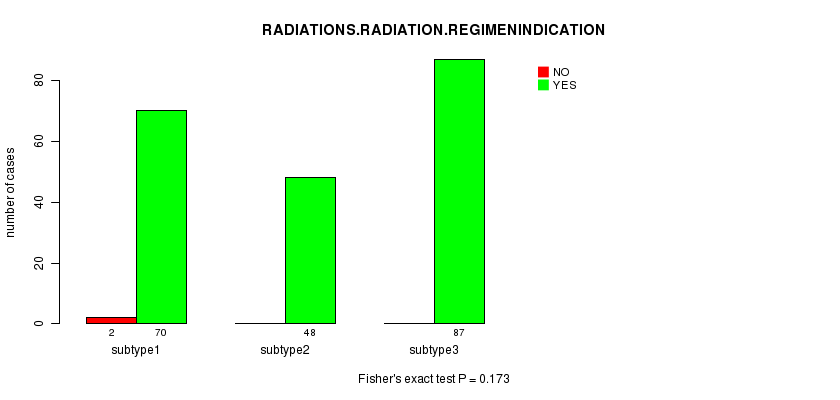
P value = 0.173 (Fisher's exact test)
Table S40. Clustering Approach #6: 'RNAseq CNMF subtypes' versus Clinical Feature #5: 'RADIATIONS.RADIATION.REGIMENINDICATION'
| nPatients | NO | YES |
|---|---|---|
| ALL | 205 | 2 |
| subtype1 | 70 | 2 |
| subtype2 | 48 | 0 |
| subtype3 | 87 | 0 |
Figure S34. Get High-res Image Clustering Approach #6: 'RNAseq CNMF subtypes' versus Clinical Feature #5: 'RADIATIONS.RADIATION.REGIMENINDICATION'
P value = 0.565 (Fisher's exact test)
Table S41. Clustering Approach #6: 'RNAseq CNMF subtypes' versus Clinical Feature #6: 'NEOADJUVANT.THERAPY'
| nPatients | NO | YES |
|---|---|---|
| ALL | 161 | 46 |
| subtype1 | 59 | 13 |
| subtype2 | 36 | 12 |
| subtype3 | 66 | 21 |
Figure S35. Get High-res Image Clustering Approach #6: 'RNAseq CNMF subtypes' versus Clinical Feature #6: 'NEOADJUVANT.THERAPY'
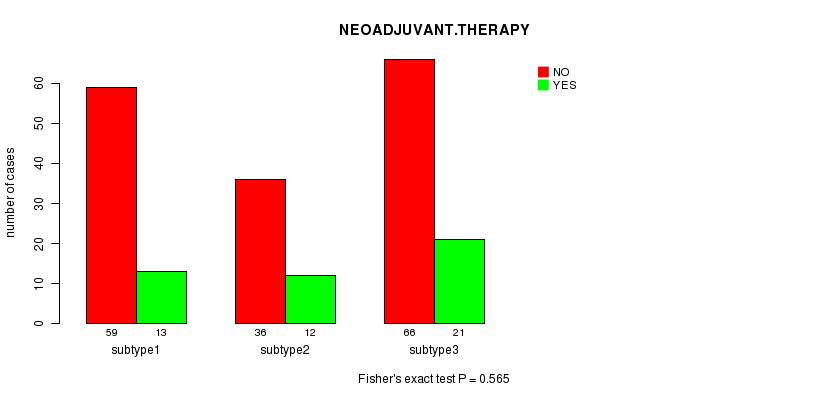
Table S42. Get Full Table Description of clustering approach #7: 'RNAseq cHierClus subtypes'
| Cluster Labels | 1 | 2 | 3 |
|---|---|---|---|
| Number of samples | 32 | 85 | 90 |
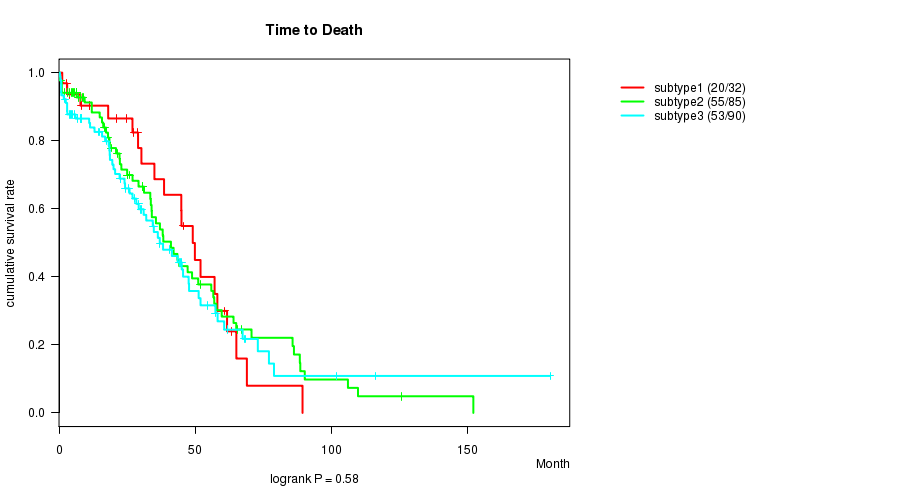
P value = 0.58 (logrank test)
Table S43. Clustering Approach #7: 'RNAseq cHierClus subtypes' versus Clinical Feature #1: 'Time to Death'
| nPatients | nDeath | Duration Range (Median), Month | |
|---|---|---|---|
| ALL | 207 | 128 | 0.3 - 180.2 (27.0) |
| subtype1 | 32 | 20 | 1.2 - 89.3 (32.6) |
| subtype2 | 85 | 55 | 0.3 - 152.0 (25.1) |
| subtype3 | 90 | 53 | 0.4 - 180.2 (24.9) |
Figure S36. Get High-res Image Clustering Approach #7: 'RNAseq cHierClus subtypes' versus Clinical Feature #1: 'Time to Death'
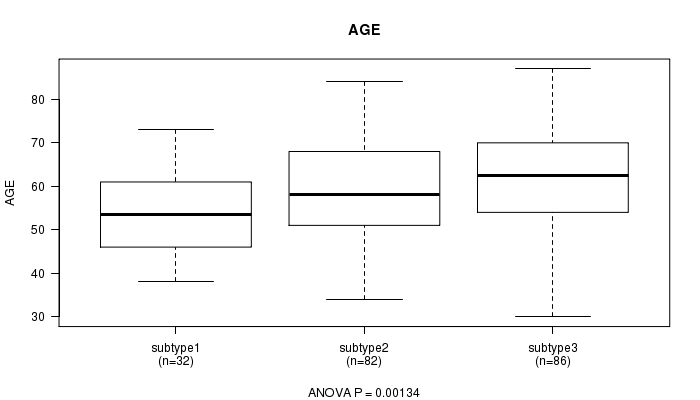
P value = 0.00134 (ANOVA)
Table S44. Clustering Approach #7: 'RNAseq cHierClus subtypes' versus Clinical Feature #2: 'AGE'
| nPatients | Mean (Std.Dev) | |
|---|---|---|
| ALL | 200 | 59.7 (11.2) |
| subtype1 | 32 | 53.7 (9.4) |
| subtype2 | 82 | 59.7 (11.3) |
| subtype3 | 86 | 62.0 (11.0) |
Figure S37. Get High-res Image Clustering Approach #7: 'RNAseq cHierClus subtypes' versus Clinical Feature #2: 'AGE'
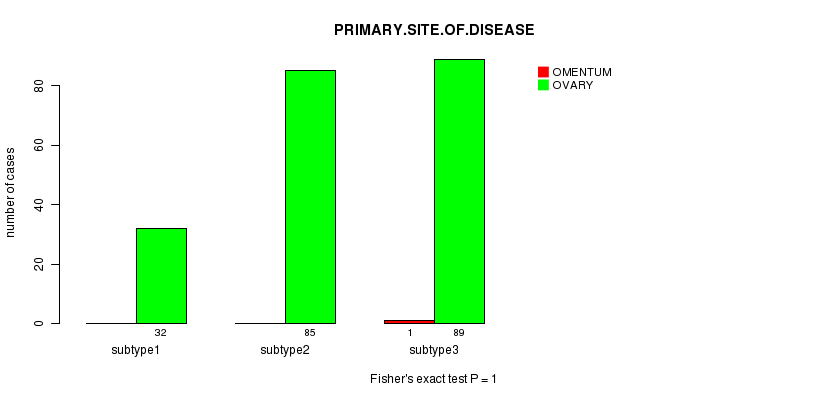
P value = 1 (Fisher's exact test)
Table S45. Clustering Approach #7: 'RNAseq cHierClus subtypes' versus Clinical Feature #3: 'PRIMARY.SITE.OF.DISEASE'
| nPatients | OMENTUM | OVARY |
|---|---|---|
| ALL | 1 | 206 |
| subtype1 | 0 | 32 |
| subtype2 | 0 | 85 |
| subtype3 | 1 | 89 |
Figure S38. Get High-res Image Clustering Approach #7: 'RNAseq cHierClus subtypes' versus Clinical Feature #3: 'PRIMARY.SITE.OF.DISEASE'
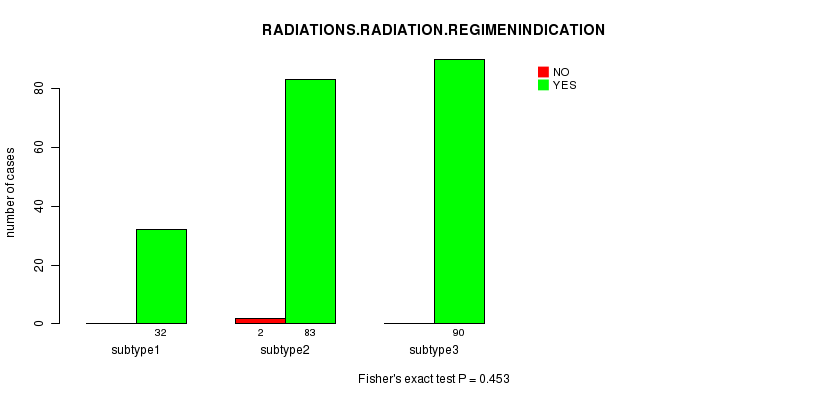
P value = 0.453 (Fisher's exact test)
Table S46. Clustering Approach #7: 'RNAseq cHierClus subtypes' versus Clinical Feature #5: 'RADIATIONS.RADIATION.REGIMENINDICATION'
| nPatients | NO | YES |
|---|---|---|
| ALL | 205 | 2 |
| subtype1 | 32 | 0 |
| subtype2 | 83 | 2 |
| subtype3 | 90 | 0 |
Figure S39. Get High-res Image Clustering Approach #7: 'RNAseq cHierClus subtypes' versus Clinical Feature #5: 'RADIATIONS.RADIATION.REGIMENINDICATION'
P value = 0.691 (Fisher's exact test)
Table S47. Clustering Approach #7: 'RNAseq cHierClus subtypes' versus Clinical Feature #6: 'NEOADJUVANT.THERAPY'
| nPatients | NO | YES |
|---|---|---|
| ALL | 161 | 46 |
| subtype1 | 27 | 5 |
| subtype2 | 65 | 20 |
| subtype3 | 69 | 21 |
Figure S40. Get High-res Image Clustering Approach #7: 'RNAseq cHierClus subtypes' versus Clinical Feature #6: 'NEOADJUVANT.THERAPY'
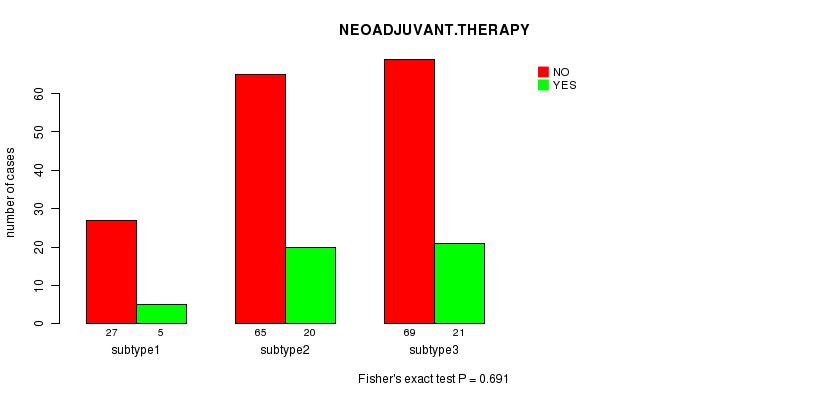
Table S48. Get Full Table Description of clustering approach #8: 'MIRseq CNMF subtypes'
| Cluster Labels | 1 | 2 | 3 |
|---|---|---|---|
| Number of samples | 114 | 195 | 145 |
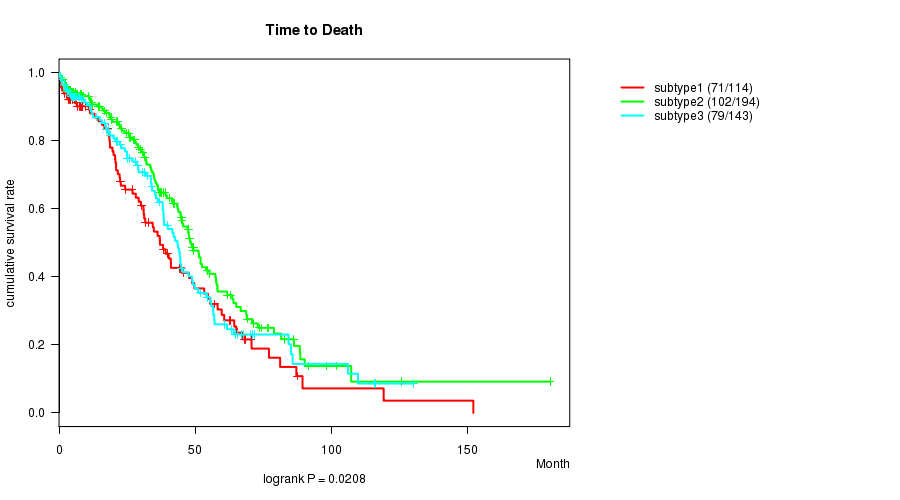
P value = 0.0208 (logrank test)
Table S49. Clustering Approach #8: 'MIRseq CNMF subtypes' versus Clinical Feature #1: 'Time to Death'
| nPatients | nDeath | Duration Range (Median), Month | |
|---|---|---|---|
| ALL | 451 | 252 | 0.3 - 180.2 (30.1) |
| subtype1 | 114 | 71 | 0.3 - 152.0 (24.3) |
| subtype2 | 194 | 102 | 0.3 - 180.2 (33.6) |
| subtype3 | 143 | 79 | 0.3 - 130.0 (28.6) |
Figure S41. Get High-res Image Clustering Approach #8: 'MIRseq CNMF subtypes' versus Clinical Feature #1: 'Time to Death'
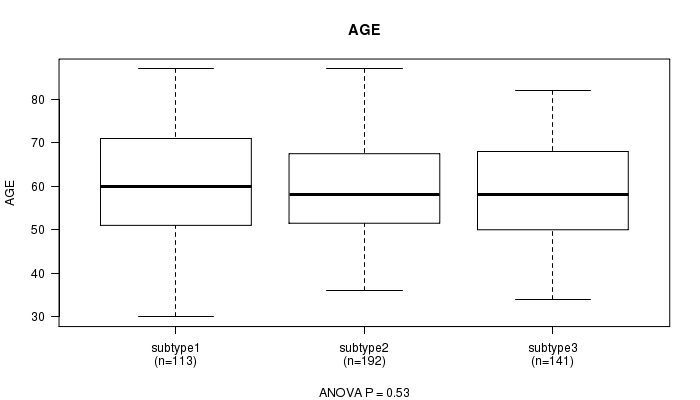
P value = 0.53 (ANOVA)
Table S50. Clustering Approach #8: 'MIRseq CNMF subtypes' versus Clinical Feature #2: 'AGE'
| nPatients | Mean (Std.Dev) | |
|---|---|---|
| ALL | 446 | 59.8 (11.5) |
| subtype1 | 113 | 60.8 (11.8) |
| subtype2 | 192 | 59.5 (11.2) |
| subtype3 | 141 | 59.4 (11.8) |
Figure S42. Get High-res Image Clustering Approach #8: 'MIRseq CNMF subtypes' versus Clinical Feature #2: 'AGE'
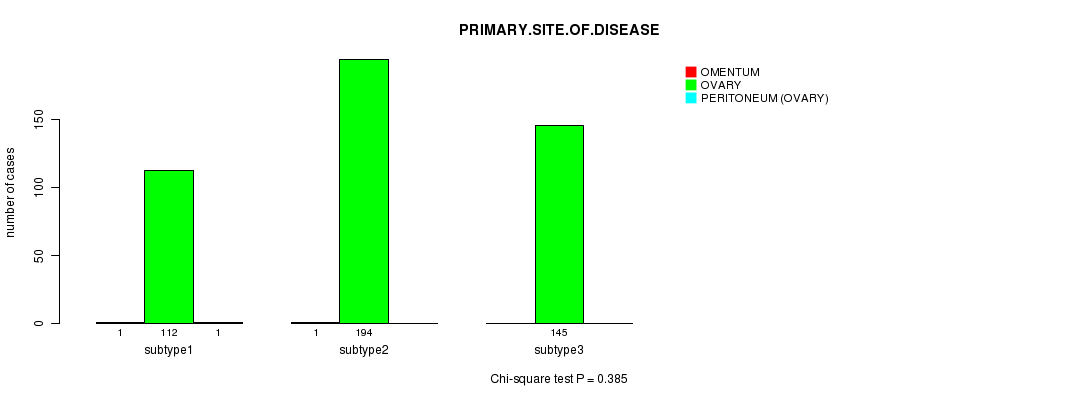
P value = 0.385 (Chi-square test)
Table S51. Clustering Approach #8: 'MIRseq CNMF subtypes' versus Clinical Feature #3: 'PRIMARY.SITE.OF.DISEASE'
| nPatients | OMENTUM | OVARY | PERITONEUM (OVARY) |
|---|---|---|---|
| ALL | 2 | 451 | 1 |
| subtype1 | 1 | 112 | 1 |
| subtype2 | 1 | 194 | 0 |
| subtype3 | 0 | 145 | 0 |
Figure S43. Get High-res Image Clustering Approach #8: 'MIRseq CNMF subtypes' versus Clinical Feature #3: 'PRIMARY.SITE.OF.DISEASE'
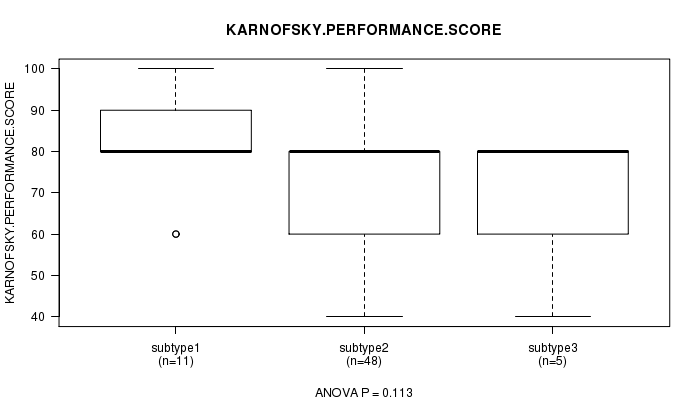
P value = 0.113 (ANOVA)
Table S52. Clustering Approach #8: 'MIRseq CNMF subtypes' versus Clinical Feature #4: 'KARNOFSKY.PERFORMANCE.SCORE'
| nPatients | Mean (Std.Dev) | |
|---|---|---|
| ALL | 64 | 75.3 (13.2) |
| subtype1 | 11 | 81.8 (14.0) |
| subtype2 | 48 | 74.6 (12.2) |
| subtype3 | 5 | 68.0 (17.9) |
Figure S44. Get High-res Image Clustering Approach #8: 'MIRseq CNMF subtypes' versus Clinical Feature #4: 'KARNOFSKY.PERFORMANCE.SCORE'
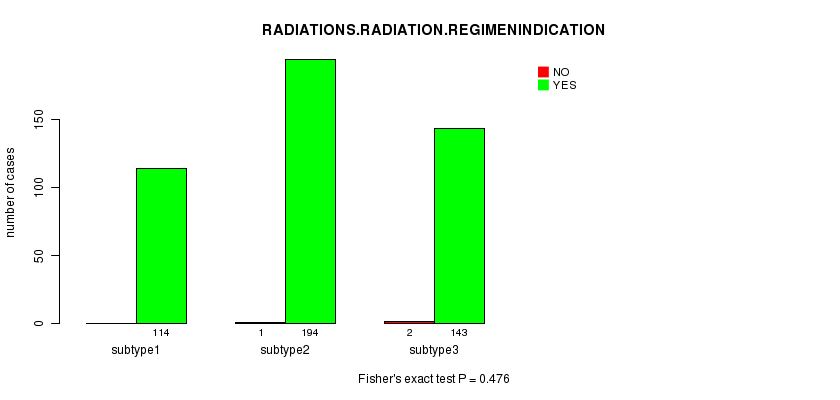
P value = 0.476 (Fisher's exact test)
Table S53. Clustering Approach #8: 'MIRseq CNMF subtypes' versus Clinical Feature #5: 'RADIATIONS.RADIATION.REGIMENINDICATION'
| nPatients | NO | YES |
|---|---|---|
| ALL | 451 | 3 |
| subtype1 | 114 | 0 |
| subtype2 | 194 | 1 |
| subtype3 | 143 | 2 |
Figure S45. Get High-res Image Clustering Approach #8: 'MIRseq CNMF subtypes' versus Clinical Feature #5: 'RADIATIONS.RADIATION.REGIMENINDICATION'
P value = 0.704 (Fisher's exact test)
Table S54. Clustering Approach #8: 'MIRseq CNMF subtypes' versus Clinical Feature #6: 'NEOADJUVANT.THERAPY'
| nPatients | NO | YES |
|---|---|---|
| ALL | 367 | 87 |
| subtype1 | 91 | 23 |
| subtype2 | 161 | 34 |
| subtype3 | 115 | 30 |
Figure S46. Get High-res Image Clustering Approach #8: 'MIRseq CNMF subtypes' versus Clinical Feature #6: 'NEOADJUVANT.THERAPY'
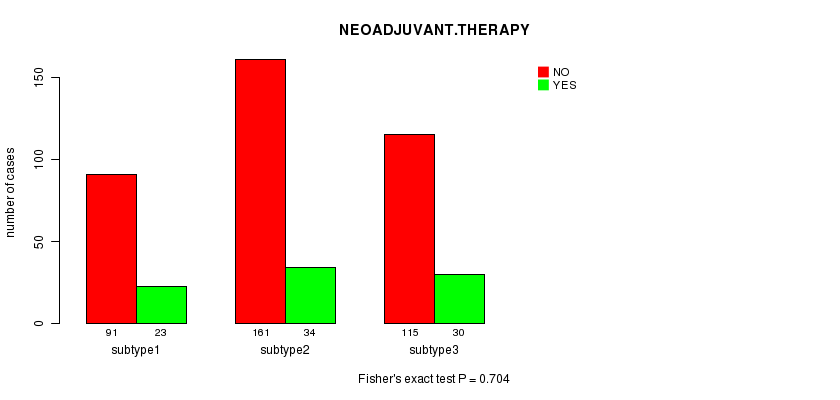
Table S55. Get Full Table Description of clustering approach #9: 'MIRseq cHierClus subtypes'
| Cluster Labels | 1 | 2 | 3 |
|---|---|---|---|
| Number of samples | 3 | 297 | 154 |
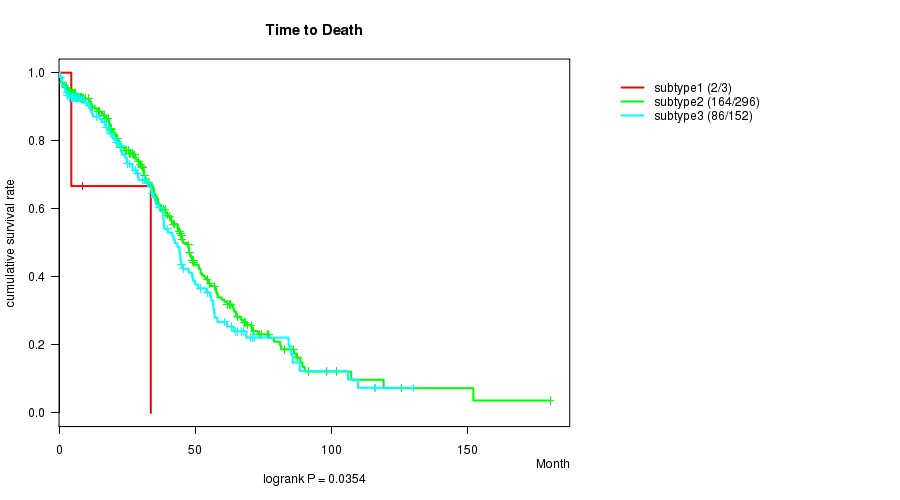
P value = 0.0354 (logrank test)
Table S56. Clustering Approach #9: 'MIRseq cHierClus subtypes' versus Clinical Feature #1: 'Time to Death'
| nPatients | nDeath | Duration Range (Median), Month | |
|---|---|---|---|
| ALL | 451 | 252 | 0.3 - 180.2 (30.1) |
| subtype1 | 3 | 2 | 4.5 - 33.7 (8.6) |
| subtype2 | 296 | 164 | 0.3 - 180.2 (31.0) |
| subtype3 | 152 | 86 | 0.3 - 130.0 (27.4) |
Figure S47. Get High-res Image Clustering Approach #9: 'MIRseq cHierClus subtypes' versus Clinical Feature #1: 'Time to Death'
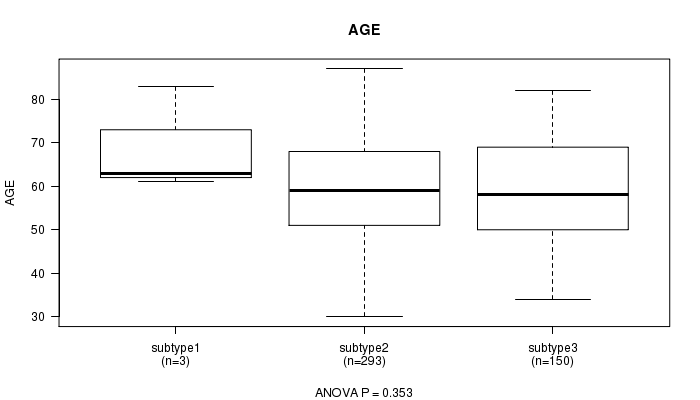
P value = 0.353 (ANOVA)
Table S57. Clustering Approach #9: 'MIRseq cHierClus subtypes' versus Clinical Feature #2: 'AGE'
| nPatients | Mean (Std.Dev) | |
|---|---|---|
| ALL | 446 | 59.8 (11.5) |
| subtype1 | 3 | 69.0 (12.2) |
| subtype2 | 293 | 59.9 (11.4) |
| subtype3 | 150 | 59.4 (11.8) |
Figure S48. Get High-res Image Clustering Approach #9: 'MIRseq cHierClus subtypes' versus Clinical Feature #2: 'AGE'
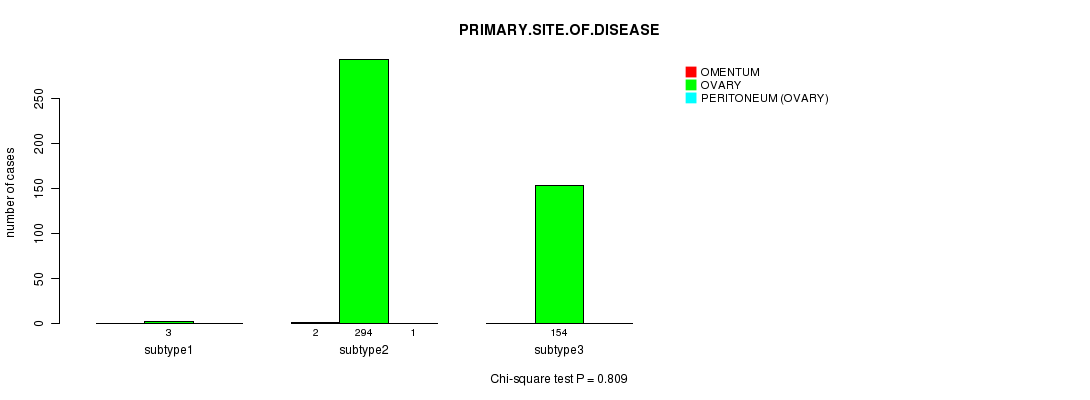
P value = 0.809 (Chi-square test)
Table S58. Clustering Approach #9: 'MIRseq cHierClus subtypes' versus Clinical Feature #3: 'PRIMARY.SITE.OF.DISEASE'
| nPatients | OMENTUM | OVARY | PERITONEUM (OVARY) |
|---|---|---|---|
| ALL | 2 | 451 | 1 |
| subtype1 | 0 | 3 | 0 |
| subtype2 | 2 | 294 | 1 |
| subtype3 | 0 | 154 | 0 |
Figure S49. Get High-res Image Clustering Approach #9: 'MIRseq cHierClus subtypes' versus Clinical Feature #3: 'PRIMARY.SITE.OF.DISEASE'
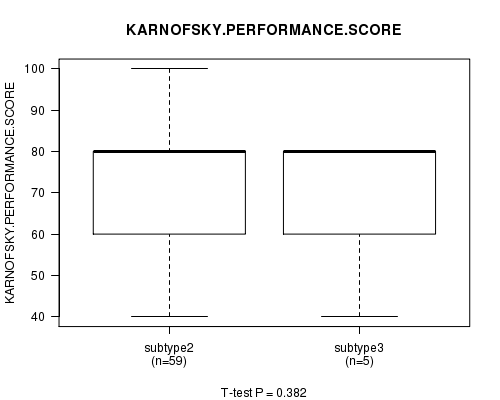
P value = 0.382 (ANOVA)
Table S59. Clustering Approach #9: 'MIRseq cHierClus subtypes' versus Clinical Feature #4: 'KARNOFSKY.PERFORMANCE.SCORE'
| nPatients | Mean (Std.Dev) | |
|---|---|---|
| ALL | 64 | 75.3 (13.2) |
| subtype2 | 59 | 75.9 (12.7) |
| subtype3 | 5 | 68.0 (17.9) |
Figure S50. Get High-res Image Clustering Approach #9: 'MIRseq cHierClus subtypes' versus Clinical Feature #4: 'KARNOFSKY.PERFORMANCE.SCORE'
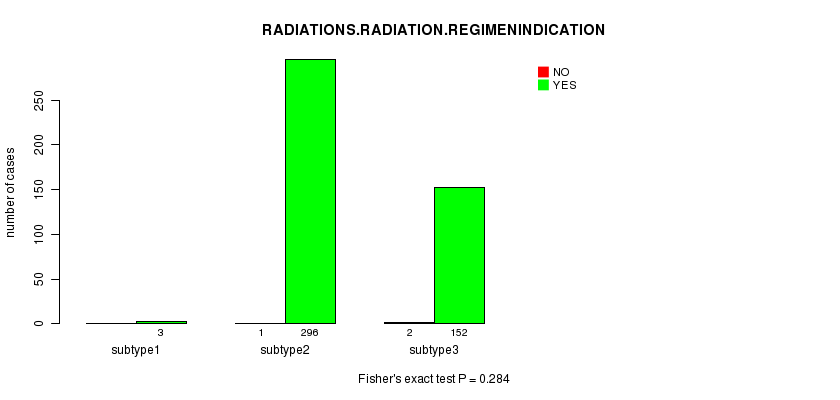
P value = 0.284 (Fisher's exact test)
Table S60. Clustering Approach #9: 'MIRseq cHierClus subtypes' versus Clinical Feature #5: 'RADIATIONS.RADIATION.REGIMENINDICATION'
| nPatients | NO | YES |
|---|---|---|
| ALL | 451 | 3 |
| subtype1 | 3 | 0 |
| subtype2 | 296 | 1 |
| subtype3 | 152 | 2 |
Figure S51. Get High-res Image Clustering Approach #9: 'MIRseq cHierClus subtypes' versus Clinical Feature #5: 'RADIATIONS.RADIATION.REGIMENINDICATION'
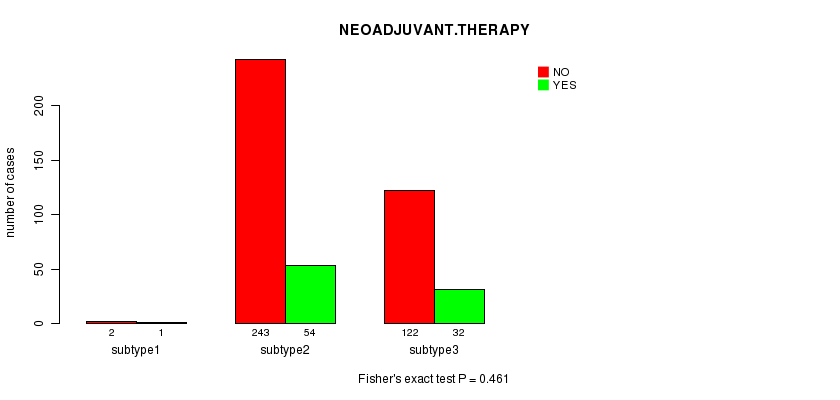
P value = 0.461 (Fisher's exact test)
Table S61. Clustering Approach #9: 'MIRseq cHierClus subtypes' versus Clinical Feature #6: 'NEOADJUVANT.THERAPY'
| nPatients | NO | YES |
|---|---|---|
| ALL | 367 | 87 |
| subtype1 | 2 | 1 |
| subtype2 | 243 | 54 |
| subtype3 | 122 | 32 |
Figure S52. Get High-res Image Clustering Approach #9: 'MIRseq cHierClus subtypes' versus Clinical Feature #6: 'NEOADJUVANT.THERAPY'
-
Cluster data file = OV.mergedcluster.txt
-
Clinical data file = OV.clin.merged.picked.txt
-
Number of patients = 566
-
Number of clustering approaches = 9
-
Number of selected clinical features = 6
-
Exclude small clusters that include fewer than K patients, K = 3
consensus non-negative matrix factorization clustering approach (Brunet et al. 2004)
Resampling-based clustering method (Monti et al. 2003)
For survival clinical features, the Kaplan-Meier survival curves of tumors with and without gene mutations were plotted and the statistical significance P values were estimated by logrank test (Bland and Altman 2004) using the 'survdiff' function in R
For continuous numerical clinical features, one-way analysis of variance (Howell 2002) was applied to compare the clinical values between tumor subtypes using 'anova' function in R
For multi-class clinical features (nominal or ordinal), Chi-square tests (Greenwood and Nikulin 1996) were used to estimate the P values using the 'chisq.test' function in R
For binary clinical features, two-tailed Fisher's exact tests (Fisher 1922) were used to estimate the P values using the 'fisher.test' function in R
This is an experimental feature. The full results of the analysis summarized in this report can be downloaded from the TCGA Data Coordination Center.