This pipeline computes the correlation between significantly recurrent gene mutations and selected clinical features.
Testing the association between mutation status of 37 genes and 8 clinical features across 132 patients, one significant finding detected with Q value < 0.25.
-
GPR146 mutation correlated to 'AGE'.
Table 1. Get Full Table Overview of the association between mutation status of 37 genes and 8 clinical features. Shown in the table are P values (Q values). Thresholded by Q value < 0.25, one significant finding detected.
|
Clinical Features |
Time to Death |
AGE | GENDER |
HISTOLOGICAL TYPE |
PATHOLOGY T |
PATHOLOGY N |
PATHOLOGICSPREAD(M) |
NEOADJUVANT THERAPY |
||
| nMutated (%) | nWild-Type | logrank test | t-test | Fisher's exact test | Chi-square test | Fisher's exact test | Fisher's exact test | Fisher's exact test | Fisher's exact test | |
| GPR146 | 4 (3%) | 128 |
0.748 (1.00) |
1.09e-14 (2.82e-12) |
1 (1.00) |
0.805 (1.00) |
0.821 (1.00) |
0.136 (1.00) |
1 (1.00) |
1 (1.00) |
| CIC | 11 (8%) | 121 |
0.142 (1.00) |
0.00885 (1.00) |
0.116 (1.00) |
0.619 (1.00) |
0.429 (1.00) |
0.398 (1.00) |
0.00152 (0.393) |
1 (1.00) |
| HIST1H2AD | 3 (2%) | 129 |
0.841 (1.00) |
0.564 (1.00) |
0.953 (1.00) |
0.428 (1.00) |
0.0196 (1.00) |
1 (1.00) |
||
| MXRA5 | 17 (13%) | 115 |
0.645 (1.00) |
0.0262 (1.00) |
0.294 (1.00) |
0.433 (1.00) |
0.506 (1.00) |
0.396 (1.00) |
0.25 (1.00) |
0.594 (1.00) |
| OCEL1 | 4 (3%) | 128 |
0.614 (1.00) |
0.648 (1.00) |
0.302 (1.00) |
0.937 (1.00) |
0.0317 (1.00) |
0.79 (1.00) |
0.0381 (1.00) |
1 (1.00) |
| OR10J1 | 4 (3%) | 128 |
0.361 (1.00) |
0.413 (1.00) |
0.649 (1.00) |
0.239 (1.00) |
0.097 (1.00) |
0.395 (1.00) |
0.162 (1.00) |
0.198 (1.00) |
| BACH2 | 10 (8%) | 122 |
0.364 (1.00) |
0.295 (1.00) |
0.522 (1.00) |
0.4 (1.00) |
0.429 (1.00) |
0.213 (1.00) |
0.222 (1.00) |
1 (1.00) |
| NPFF | 3 (2%) | 129 |
0.386 (1.00) |
0.248 (1.00) |
1 (1.00) |
0.599 (1.00) |
0.288 (1.00) |
0.296 (1.00) |
1 (1.00) |
1 (1.00) |
| OR6C70 | 4 (3%) | 128 |
0.541 (1.00) |
0.00322 (0.829) |
0.649 (1.00) |
0.805 (1.00) |
0.151 (1.00) |
0.263 (1.00) |
0.162 (1.00) |
1 (1.00) |
| CCS | 3 (2%) | 129 |
0.588 (1.00) |
1 (1.00) |
0.447 (1.00) |
0.706 (1.00) |
1 (1.00) |
1 (1.00) |
||
| TNNI2 | 5 (4%) | 127 |
0.216 (1.00) |
0.648 (1.00) |
0.89 (1.00) |
0.349 (1.00) |
0.553 (1.00) |
0.504 (1.00) |
1 (1.00) |
|
| PRKRA | 3 (2%) | 129 |
0.114 (1.00) |
1 (1.00) |
0.81 (1.00) |
0.114 (1.00) |
1 (1.00) |
|||
| MS4A6A | 3 (2%) | 129 |
0.757 (1.00) |
0.564 (1.00) |
0.81 (1.00) |
0.428 (1.00) |
0.843 (1.00) |
1 (1.00) |
1 (1.00) |
|
| CCDC97 | 3 (2%) | 129 |
0.0562 (1.00) |
0.0625 (1.00) |
0.953 (1.00) |
0.151 (1.00) |
1 (1.00) |
1 (1.00) |
||
| ZNF223 | 4 (3%) | 128 |
0.532 (1.00) |
0.252 (1.00) |
0.302 (1.00) |
0.937 (1.00) |
0.428 (1.00) |
0.79 (1.00) |
0.428 (1.00) |
1 (1.00) |
| ZNF284 | 3 (2%) | 129 |
0.103 (1.00) |
0.274 (1.00) |
0.81 (1.00) |
1 (1.00) |
0.114 (1.00) |
1 (1.00) |
||
| PCDHA6 | 14 (11%) | 118 |
0.255 (1.00) |
0.29 (1.00) |
0.0188 (1.00) |
0.775 (1.00) |
0.704 (1.00) |
1 (1.00) |
0.768 (1.00) |
0.553 (1.00) |
| ZDHHC23 | 3 (2%) | 129 |
0.274 (1.00) |
0.81 (1.00) |
0.288 (1.00) |
0.418 (1.00) |
0.114 (1.00) |
1 (1.00) |
||
| DSCR4 | 3 (2%) | 129 |
0.252 (1.00) |
0.564 (1.00) |
0.81 (1.00) |
0.428 (1.00) |
0.706 (1.00) |
1 (1.00) |
1 (1.00) |
|
| GLT6D1 | 3 (2%) | 129 |
0.343 (1.00) |
0.564 (1.00) |
0.81 (1.00) |
0.706 (1.00) |
1 (1.00) |
1 (1.00) |
||
| MAML1 | 4 (3%) | 128 |
0.916 (1.00) |
0.257 (1.00) |
0.302 (1.00) |
0.68 (1.00) |
1 (1.00) |
0.296 (1.00) |
0.162 (1.00) |
1 (1.00) |
| NME5 | 3 (2%) | 129 |
0.898 (1.00) |
1 (1.00) |
0.953 (1.00) |
0.428 (1.00) |
1 (1.00) |
0.114 (1.00) |
1 (1.00) |
|
| RRAS | 3 (2%) | 129 |
0.512 (1.00) |
1 (1.00) |
0.81 (1.00) |
1 (1.00) |
1 (1.00) |
1 (1.00) |
||
| USP48 | 5 (4%) | 127 |
0.528 (1.00) |
0.648 (1.00) |
0.89 (1.00) |
1 (1.00) |
0.466 (1.00) |
0.0616 (1.00) |
1 (1.00) |
|
| LRRC55 | 3 (2%) | 129 |
0.712 (1.00) |
0.564 (1.00) |
0.113 (1.00) |
0.706 (1.00) |
1 (1.00) |
1 (1.00) |
||
| MAPK15 | 5 (4%) | 127 |
0.0304 (1.00) |
1 (1.00) |
0.89 (1.00) |
1 (1.00) |
1 (1.00) |
0.504 (1.00) |
1 (1.00) |
|
| RNF167 | 4 (3%) | 128 |
0.549 (1.00) |
0.302 (1.00) |
0.937 (1.00) |
0.571 (1.00) |
1 (1.00) |
0.428 (1.00) |
1 (1.00) |
|
| MOSC1 | 3 (2%) | 129 |
0.41 (1.00) |
0.274 (1.00) |
0.953 (1.00) |
0.0691 (1.00) |
1 (1.00) |
0.00366 (0.936) |
1 (1.00) |
|
| HOMEZ | 4 (3%) | 128 |
0.419 (1.00) |
0.302 (1.00) |
0.691 (1.00) |
0.04 (1.00) |
0.843 (1.00) |
0.428 (1.00) |
1 (1.00) |
|
| MSH5 | 5 (4%) | 127 |
0.697 (1.00) |
0.39 (1.00) |
0.571 (1.00) |
0.173 (1.00) |
0.912 (1.00) |
0.213 (1.00) |
1 (1.00) |
|
| FBXO24 | 5 (4%) | 127 |
0.436 (1.00) |
0.62 (1.00) |
1 (1.00) |
0.782 (1.00) |
0.466 (1.00) |
1 (1.00) |
1 (1.00) |
1 (1.00) |
| UBE2Q1 | 3 (2%) | 129 |
0.264 (1.00) |
0.274 (1.00) |
0.447 (1.00) |
0.113 (1.00) |
0.59 (1.00) |
0.114 (1.00) |
1 (1.00) |
|
| WNT10A | 3 (2%) | 129 |
0.938 (1.00) |
0.564 (1.00) |
0.447 (1.00) |
0.00686 (1.00) |
0.59 (1.00) |
0.341 (1.00) |
1 (1.00) |
|
| PRSS1 | 3 (2%) | 129 |
0.241 (1.00) |
0.564 (1.00) |
0.0431 (1.00) |
0.341 (1.00) |
1 (1.00) |
|||
| PCDHB9 | 10 (8%) | 122 |
0.487 (1.00) |
0.0765 (1.00) |
0.739 (1.00) |
0.613 (1.00) |
0.446 (1.00) |
0.825 (1.00) |
0.32 (1.00) |
1 (1.00) |
| EDF1 | 3 (2%) | 129 |
0.0471 (1.00) |
1 (1.00) |
0.81 (1.00) |
0.843 (1.00) |
0.341 (1.00) |
1 (1.00) |
||
| CLEC4F | 4 (3%) | 128 |
0.128 (1.00) |
1 (1.00) |
0.671 (1.00) |
0.236 (1.00) |
1 (1.00) |
0.162 (1.00) |
1 (1.00) |
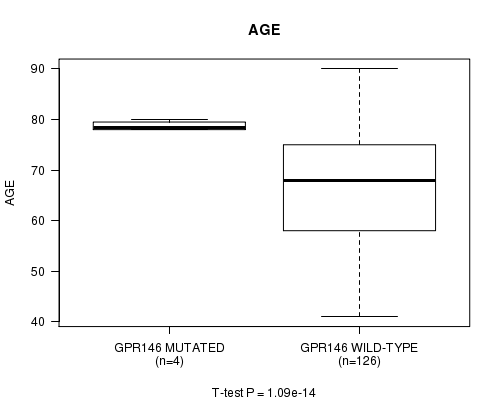
P value = 1.09e-14 (t-test), Q value = 2.8e-12
Table S1. Gene #37: 'GPR146 MUTATION STATUS' versus Clinical Feature #2: 'AGE'
| nPatients | Mean (Std.Dev) | |
|---|---|---|
| ALL | 130 | 67.8 (10.8) |
| GPR146 MUTATED | 4 | 78.8 (1.0) |
| GPR146 WILD-TYPE | 126 | 67.5 (10.8) |
Figure S1. Get High-res Image Gene #37: 'GPR146 MUTATION STATUS' versus Clinical Feature #2: 'AGE'
-
Mutation data file = STAD.mutsig.cluster.txt
-
Clinical data file = STAD.clin.merged.picked.txt
-
Number of patients = 132
-
Number of significantly mutated genes = 37
-
Number of selected clinical features = 8
-
Exclude genes that fewer than K tumors have mutations, K = 3
For survival clinical features, the Kaplan-Meier survival curves of tumors with and without gene mutations were plotted and the statistical significance P values were estimated by logrank test (Bland and Altman 2004) using the 'survdiff' function in R
For continuous numerical clinical features, two-tailed Student's t test with unequal variance (Lehmann and Romano 2005) was applied to compare the clinical values between tumors with and without gene mutations using 't.test' function in R
For binary or multi-class clinical features (nominal or ordinal), two-tailed Fisher's exact tests (Fisher 1922) were used to estimate the P values using the 'fisher.test' function in R
For multi-class clinical features (nominal or ordinal), Chi-square tests (Greenwood and Nikulin 1996) were used to estimate the P values using the 'chisq.test' function in R
For multiple hypothesis correction, Q value is the False Discovery Rate (FDR) analogue of the P value (Benjamini and Hochberg 1995), defined as the minimum FDR at which the test may be called significant. We used the 'Benjamini and Hochberg' method of 'p.adjust' function in R to convert P values into Q values.
This is an experimental feature. The full results of the analysis summarized in this report can be downloaded from the TCGA Data Coordination Center.