This report serves to describe the mutational landscape and properties of a given individual set, as well as rank genes and genesets according to mutational significance. MutSig v1.5 was used to generate the results found in this report.
Working with individual set: UCEC.
Number of patients in set: 248
The input for this pipeline is a set of individuals with the following files associated for each:
1. An annotated .maf file describing the mutations called for the respective individual, and their properties.
2. A .wig file that contains information about the coverage of the sample.
Significantly mutated genes (q ≤ 0.1): 37
Mutations seen in COSMIC: 9
Significantly mutated genes in COSMIC territory: 1
Genes with clustered mutations (&le 3 aa apart): 183
Significantly mutated genesets: 4
Significantly mutated genesets: (excluding sig. mutated genes): 0
Table 1. Get Full Table Table representing breakdown of mutations by type.
| type | count |
|---|---|
| Frame_Shift_Del | 35 |
| Frame_Shift_Ins | 11 |
| In_Frame_Del | 25 |
| In_Frame_Ins | 11 |
| Missense_Mutation | 3923 |
| Nonsense_Mutation | 315 |
| Nonstop_Mutation | 4 |
| Silent | 1554 |
| Splice_Site | 68 |
| Total | 5946 |
Table 2. Get Full Table A breakdown of mutation rates per category discovered for this individual set.
| category | n | N | rate | rate_per_mb | relative_rate | exp_ns_s_ratio |
|---|---|---|---|---|---|---|
| *CpG->T | 1489 | 9493936 | 0.00016 | 160 | 4.3 | 2 |
| *Cp(A/C/T)->mut | 1682 | 58966712 | 0.000029 | 29 | 0.79 | 2.8 |
| A->mut | 704 | 53165248 | 0.000013 | 13 | 0.37 | 4.2 |
| *CpG->(G/A) | 48 | 9493936 | 5.1e-06 | 5.1 | 0.14 | 2.6 |
| indel+null | 462 | 121625896 | 3.8e-06 | 3.8 | 0.11 | NaN |
| double_null | 7 | 121625896 | 5.8e-08 | 0.058 | 0.0016 | NaN |
| Total | 4392 | 121625896 | 0.000036 | 36 | 1 | 3.3 |
The x axis represents the samples. The y axis represents the exons, one row per exon, and they are sorted by average coverage across samples. For exons with exactly the same average coverage, they are sorted next by the %GC of the exon. (The secondary sort is especially useful for the zero-coverage exons at the bottom).
Figure 1.

Figure 2.
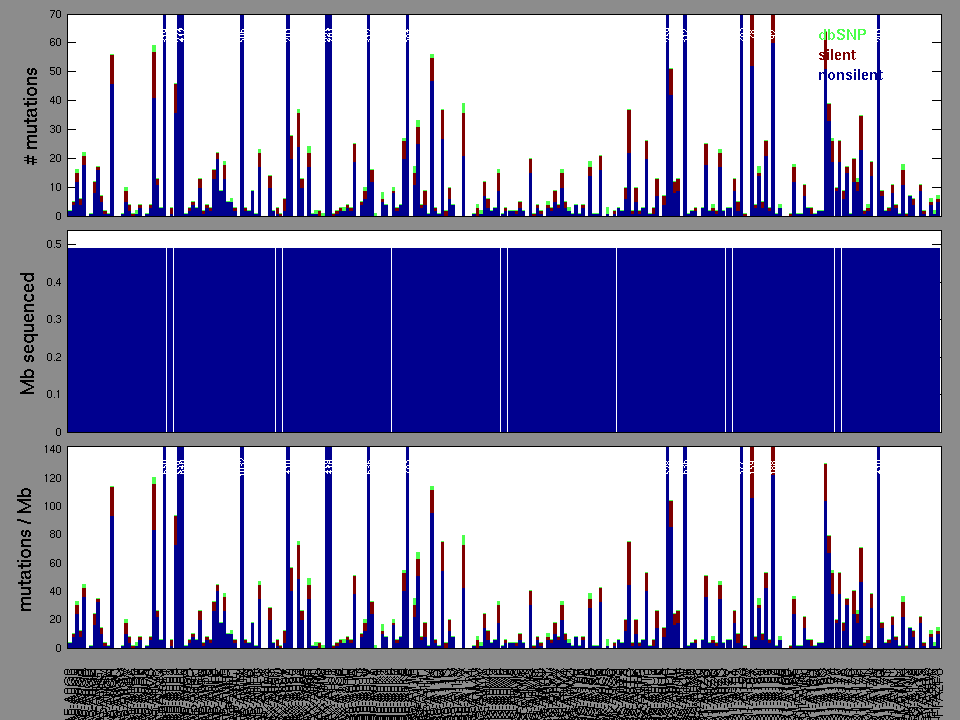
Figure 3. Get High-res Image The matrix in the center of the figure represents individual mutations in patient samples, color-coded by type of mutation, for the significantly mutated genes. The rate of synonymous and non-synonymous mutations is displayed at the top of the matrix. The barplot on the left of the matrix shows the number of mutations in each gene. The percentages represent the fraction of tumors with at least one mutation in the specified gene. The barplot to the right of the matrix displays the q-values for the most significantly mutated genes. The purple boxplots below the matrix (only displayed if required columns are present in the provided MAF) represent the distributions of allelic fractions observed in each sample. The plot at the bottom represents the base substitution distribution of individual samples, using the same categories that were used to calculate significance.
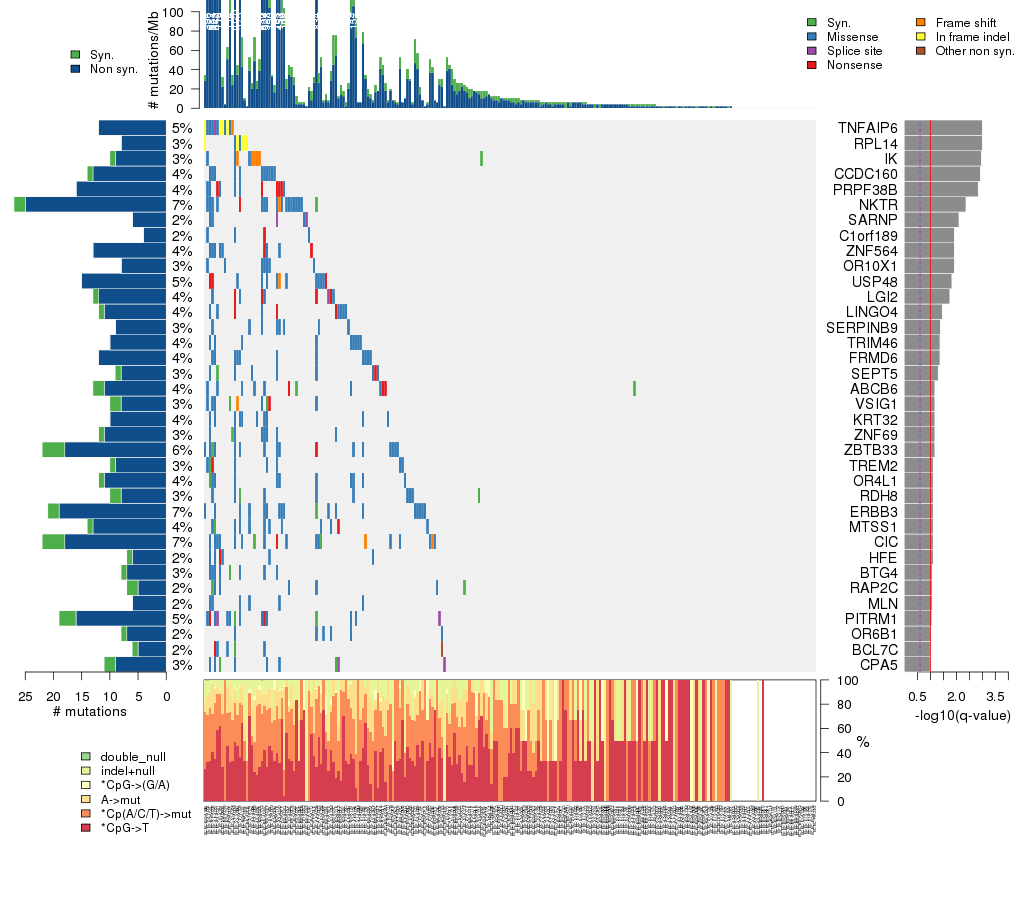
Table 3. Get Full Table A Ranked List of Significantly Mutated Genes. Number of significant genes found: 37. Number of genes displayed: 35
| rank | gene | description | N | n | npat | nsite | nsil | n1 | n2 | n3 | n4 | n5 | n6 | p_ns_s | p | q |
|---|---|---|---|---|---|---|---|---|---|---|---|---|---|---|---|---|
| 1 | TNFAIP6 | tumor necrosis factor, alpha-induced protein 6 | 106640 | 12 | 12 | 8 | 0 | 2 | 4 | 0 | 0 | 6 | 0 | 0.18 | 3.2e-13 | 2.8e-10 |
| 2 | RPL14 | ribosomal protein L14 | 73904 | 8 | 7 | 4 | 0 | 0 | 1 | 0 | 2 | 5 | 0 | 0.22 | 1.9e-10 | 8.1e-08 |
| 3 | IK | IK cytokine, down-regulator of HLA II | 112592 | 9 | 8 | 6 | 1 | 2 | 1 | 1 | 0 | 5 | 0 | 0.74 | 2.7e-07 | 0.000079 |
| 4 | CCDC160 | 67456 | 13 | 11 | 12 | 1 | 1 | 7 | 5 | 0 | 0 | 0 | 0.27 | 8.9e-07 | 0.00019 | |
| 5 | PRPF38B | PRP38 pre-mRNA processing factor 38 (yeast) domain containing B | 136152 | 16 | 11 | 15 | 0 | 4 | 5 | 2 | 0 | 4 | 1 | 0.25 | 2.5e-06 | 0.00044 |
| 6 | NKTR | natural killer-tumor recognition sequence | 289416 | 25 | 18 | 23 | 2 | 13 | 6 | 4 | 0 | 2 | 0 | 0.04 | 0.000023 | 0.0033 |
| 7 | SARNP | 63240 | 6 | 5 | 6 | 0 | 1 | 1 | 1 | 1 | 2 | 0 | 0.29 | 0.000057 | 0.007 | |
| 8 | C1orf189 | chromosome 1 open reading frame 189 | 20336 | 4 | 4 | 4 | 0 | 0 | 2 | 1 | 0 | 1 | 0 | 0.55 | 0.00011 | 0.011 |
| 9 | ZNF564 | zinc finger protein 564 | 115072 | 13 | 9 | 13 | 0 | 3 | 7 | 1 | 0 | 2 | 0 | 0.027 | 0.00012 | 0.011 |
| 10 | OR10X1 | olfactory receptor, family 10, subfamily X, member 1 | 71176 | 8 | 7 | 8 | 0 | 0 | 7 | 1 | 0 | 0 | 0 | 0.087 | 0.00012 | 0.011 |
| 11 | USP48 | ubiquitin specific peptidase 48 | 316200 | 15 | 13 | 15 | 0 | 5 | 5 | 1 | 0 | 4 | 0 | 0.034 | 0.00017 | 0.014 |
| 12 | LGI2 | leucine-rich repeat LGI family, member 2 | 158472 | 12 | 9 | 11 | 1 | 3 | 1 | 3 | 0 | 5 | 0 | 0.093 | 0.00023 | 0.017 |
| 13 | LINGO4 | leucine rich repeat and Ig domain containing 4 | 168888 | 11 | 10 | 11 | 1 | 2 | 4 | 2 | 0 | 3 | 0 | 0.15 | 0.0005 | 0.034 |
| 14 | SERPINB9 | serpin peptidase inhibitor, clade B (ovalbumin), member 9 | 79112 | 9 | 8 | 9 | 0 | 0 | 7 | 2 | 0 | 0 | 0 | 0.12 | 0.00065 | 0.04 |
| 15 | TRIM46 | tripartite motif-containing 46 | 153512 | 10 | 9 | 10 | 0 | 2 | 2 | 4 | 2 | 0 | 0 | 0.1 | 0.00073 | 0.042 |
| 16 | FRMD6 | FERM domain containing 6 | 145576 | 12 | 11 | 12 | 0 | 5 | 4 | 3 | 0 | 0 | 0 | 0.078 | 0.00077 | 0.042 |
| 17 | SEPT5 | septin 5 | 98208 | 8 | 8 | 8 | 1 | 3 | 4 | 0 | 0 | 1 | 0 | 0.17 | 0.00096 | 0.049 |
| 18 | ABCB6 | ATP-binding cassette, sub-family B (MDR/TAP), member 6 | 225184 | 11 | 10 | 11 | 2 | 4 | 3 | 1 | 0 | 3 | 0 | 0.2 | 0.0015 | 0.067 |
| 19 | VSIG1 | V-set and immunoglobulin domain containing 1 | 109368 | 8 | 7 | 8 | 2 | 3 | 2 | 1 | 0 | 2 | 0 | 0.42 | 0.0016 | 0.067 |
| 20 | KRT32 | keratin 32 | 132680 | 10 | 10 | 10 | 0 | 3 | 5 | 2 | 0 | 0 | 0 | 0.037 | 0.0016 | 0.067 |
| 21 | ZNF69 | zinc finger protein 69 | 45880 | 11 | 7 | 10 | 1 | 4 | 4 | 3 | 0 | 0 | 0 | 0.076 | 0.0016 | 0.067 |
| 22 | ZBTB33 | zinc finger and BTB domain containing 33 | 159216 | 18 | 15 | 18 | 4 | 3 | 7 | 7 | 0 | 1 | 0 | 0.49 | 0.0017 | 0.067 |
| 23 | TREM2 | triggering receptor expressed on myeloid cells 2 | 74152 | 9 | 7 | 9 | 1 | 1 | 5 | 2 | 0 | 1 | 0 | 0.21 | 0.0021 | 0.077 |
| 24 | OR4L1 | olfactory receptor, family 4, subfamily L, member 1 | 123504 | 11 | 10 | 11 | 1 | 3 | 4 | 4 | 0 | 0 | 0 | 0.12 | 0.0023 | 0.077 |
| 25 | RDH8 | retinol dehydrogenase 8 (all-trans) | 63736 | 8 | 8 | 8 | 2 | 1 | 4 | 3 | 0 | 0 | 0 | 0.39 | 0.0023 | 0.077 |
| 26 | ERBB3 | v-erb-b2 erythroblastic leukemia viral oncogene homolog 3 (avian) | 275528 | 19 | 17 | 17 | 2 | 5 | 10 | 3 | 0 | 1 | 0 | 0.21 | 0.0025 | 0.077 |
| 27 | MTSS1 | metastasis suppressor 1 | 177072 | 13 | 11 | 13 | 1 | 8 | 3 | 1 | 0 | 1 | 0 | 0.067 | 0.0025 | 0.077 |
| 28 | CIC | capicua homolog (Drosophila) | 354640 | 18 | 17 | 18 | 4 | 9 | 6 | 0 | 0 | 3 | 0 | 0.17 | 0.0025 | 0.077 |
| 29 | HFE | hemochromatosis | 85808 | 6 | 6 | 6 | 1 | 1 | 4 | 0 | 0 | 1 | 0 | 0.47 | 0.0026 | 0.077 |
| 30 | BTG4 | B-cell translocation gene 4 | 62496 | 7 | 7 | 7 | 1 | 0 | 5 | 2 | 0 | 0 | 0 | 0.57 | 0.0029 | 0.084 |
| 31 | RAP2C | RAP2C, member of RAS oncogene family | 51832 | 5 | 5 | 5 | 2 | 2 | 3 | 0 | 0 | 0 | 0 | 0.59 | 0.0031 | 0.084 |
| 32 | MLN | motilin | 47864 | 6 | 6 | 6 | 0 | 2 | 3 | 1 | 0 | 0 | 0 | 0.092 | 0.0031 | 0.084 |
| 33 | PITRM1 | pitrilysin metallopeptidase 1 | 209312 | 16 | 13 | 16 | 3 | 5 | 4 | 3 | 0 | 4 | 0 | 0.13 | 0.0034 | 0.088 |
| 34 | OR6B1 | olfactory receptor, family 6, subfamily B, member 1 | 72912 | 7 | 6 | 7 | 1 | 3 | 3 | 1 | 0 | 0 | 0 | 0.36 | 0.0038 | 0.097 |
| 35 | BCL7C | B-cell CLL/lymphoma 7C | 56792 | 5 | 5 | 5 | 1 | 3 | 0 | 0 | 0 | 2 | 0 | 0.55 | 0.0041 | 0.1 |
Note:
N - number of sequenced bases in this gene across the individual set.
n - number of (nonsilent) mutations in this gene across the individual set.
npat - number of patients (individuals) with at least one nonsilent mutation.
nsite - number of unique sites having a non-silent mutation.
nsil - number of silent mutations in this gene across the individual set.
n1 - number of nonsilent mutations of type: *CpG->T .
n2 - number of nonsilent mutations of type: *Cp(A/C/T)->mut .
n3 - number of nonsilent mutations of type: A->mut .
n4 - number of nonsilent mutations of type: *CpG->(G/A) .
n5 - number of nonsilent mutations of type: indel+null .
null - mutation category that includes nonsense, frameshift, splice-site mutations
p_classic = p-value for the observed amount of nonsilent mutations being elevated in this gene
p_ns_s = p-value for the observed nonsilent/silent ratio being elevated in this gene
p = p-value (overall)
q = q-value, False Discovery Rate (Benjamini-Hochberg procedure)
In this analysis, COSMIC is used as a filter to increase power by restricting the territory of each gene. Cosmic version: v48.
Table 4. Get Full Table Significantly mutated genes (COSMIC territory only). To access the database please go to: COSMIC. Number of significant genes found: 1. Number of genes displayed: 10
| rank | gene | description | n | cos | n_cos | N_cos | cos_ev | p | q |
|---|---|---|---|---|---|---|---|---|---|
| 1 | ERBB2 | v-erb-b2 erythroblastic leukemia viral oncogene homolog 2, neuro/glioblastoma derived oncogene homolog (avian) | 10 | 41 | 4 | 10168 | 13 | 0.00057 | 0.085 |
| 2 | ERBB3 | v-erb-b2 erythroblastic leukemia viral oncogene homolog 3 (avian) | 19 | 6 | 2 | 1488 | 2 | 0.0014 | 0.11 |
| 3 | CAPN3 | calpain 3, (p94) | 11 | 1 | 1 | 248 | 1 | 0.0089 | 0.45 |
| 4 | RRP9 | ribosomal RNA processing 9, small subunit (SSU) processome component, homolog (yeast) | 4 | 2 | 1 | 496 | 1 | 0.018 | 0.67 |
| 5 | MAML1 | mastermind-like 1 (Drosophila) | 6 | 3 | 1 | 744 | 1 | 0.027 | 0.8 |
| 6 | ABCC10 | ATP-binding cassette, sub-family C (CFTR/MRP), member 10 | 10 | 0 | 0 | 0 | 0 | 1 | 1 |
| 7 | AGPAT1 | 1-acylglycerol-3-phosphate O-acyltransferase 1 (lysophosphatidic acid acyltransferase, alpha) | 0 | 0 | 0 | 0 | 0 | 1 | 1 |
| 8 | BACH2 | BTB and CNC homology 1, basic leucine zipper transcription factor 2 | 9 | 0 | 0 | 0 | 0 | 1 | 1 |
| 9 | BSN | bassoon (presynaptic cytomatrix protein) | 35 | 0 | 0 | 0 | 0 | 1 | 1 |
| 10 | C12orf68 | 3 | 0 | 0 | 0 | 0 | 1 | 1 |
Note:
n - number of (nonsilent) mutations in this gene across the individual set.
cos = number of unique mutated sites in this gene in COSMIC
n_cos = overlap between n and cos.
N_cos = number of individuals times cos.
cos_ev = total evidence: number of reports in COSMIC for mutations seen in this gene.
p = p-value for seeing the observed amount of overlap in this gene)
q = q-value, False Discovery Rate (Benjamini-Hochberg procedure)
Table 5. Get Full Table Genes with Clustered Mutations
| num | gene | desc | n | mindist | nmuts0 | nmuts3 | nmuts12 | npairs0 | npairs3 | npairs12 |
|---|---|---|---|---|---|---|---|---|---|---|
| 474 | PCDHA9 | protocadherin alpha 9 | 26 | 0 | 3 | 7 | 13 | 3 | 7 | 13 |
| 416 | NONO | non-POU domain containing, octamer-binding | 18 | 0 | 3 | 6 | 10 | 3 | 6 | 10 |
| 473 | PCDHA6 | protocadherin alpha 6 | 26 | 0 | 3 | 5 | 14 | 3 | 5 | 14 |
| 745 | ZNF546 | zinc finger protein 546 | 17 | 0 | 3 | 5 | 8 | 3 | 5 | 8 |
| 482 | PCDHGA5 | protocadherin gamma subfamily A, 5 | 20 | 0 | 3 | 5 | 7 | 3 | 5 | 7 |
| 345 | LGI2 | leucine-rich repeat LGI family, member 2 | 12 | 0 | 3 | 4 | 5 | 3 | 4 | 5 |
| 456 | OSBPL6 | oxysterol binding protein-like 6 | 20 | 0 | 3 | 4 | 5 | 3 | 4 | 5 |
| 399 | NCR1 | natural cytotoxicity triggering receptor 1 | 6 | 0 | 3 | 3 | 6 | 3 | 3 | 6 |
| 695 | USF1 | upstream transcription factor 1 | 7 | 0 | 3 | 3 | 6 | 3 | 3 | 6 |
| 105 | CCDC160 | 13 | 0 | 3 | 3 | 5 | 3 | 3 | 5 |
Note:
n - number of mutations in this gene in the individual set.
mindist - distance (in aa) between closest pair of mutations in this gene
npairs3 - how many pairs of mutations are within 3 aa of each other.
npairs12 - how many pairs of mutations are within 12 aa of each other.
Table 6. Get Full Table A Ranked List of Significantly Mutated Genesets. (Source: MSigDB GSEA Cannonical Pathway Set).Number of significant genesets found: 4. Number of genesets displayed: 10
| rank | geneset | description | genes | N_genes | mut_tally | N | n | npat | nsite | nsil | n1 | n2 | n3 | n4 | n5 | n6 | p_ns_s | p | q |
|---|---|---|---|---|---|---|---|---|---|---|---|---|---|---|---|---|---|---|---|
| 1 | HSA03010_RIBOSOME | Genes involved in ribosome | C15orf15, FAU, hCG_1644323, hCG_1984468, hCG_2041321, hCG_21078, hCG_26523, LOC283412, LOC284064, LOC284230, LOC284288, LOC284393, LOC285053, LOC342994, LOC347292, LOC388720, LOC389342, LOC390876, LOC391656, LOC400652, LOC402057, LOC439992, LOC440055, LOC440589, LOC440733, LOC440737, LOC441377, LOC441876, LOC441907, MRPL13, MRPS7, RPL10A, RPL10L, RPL11, RPL12, RPL13, RPL13A, RPL14, RPL18, RPL18A, RPL19, RPL21, RPL22L1, RPL23A, RPL23AP2, RPL24, RPL26, RPL27, RPL27A, RPL28, RPL29, RPL3, RPL30, RPL31, RPL32, RPL34, RPL35, RPL35A, RPL36A, RPL36AL, RPL37, RPL37A, RPL38, RPL39, RPL3L, RPL41, RPL6, RPL7, RPL8, RPL9, RPS10, RPS11, RPS12, RPS13, RPS15A, RPS16, RPS18, RPS2, RPS20, RPS21, RPS23, RPS24, RPS25, RPS26, RPS26P10, RPS27, RPS28, RPS29, RPS3, RPS3A, RPS4Y1, RPS5, RPS6, RPS7, RPS8, RPS9, RPSA, tcag7.23 | 6 | RPL14(8), RPL28(3), RPS16(1), RPS18(3), RPS27(1), RPS8(2) | 379936 | 18 | 12 | 14 | 2 | 2 | 7 | 2 | 2 | 5 | 0 | 0.29 | 0.00013 | 0.045 |
| 2 | IL17PATHWAY | Activated T cells secrete IL-17, which stimulates fibroblasts and other cells to secrete inflammatory and hematopoietic cytokines. | CD2, CD34, CD3D, CD3E, CD3G, CD3Z, CD4, CD58, CD8A, CSF3, IL17, IL3, IL6, IL8, KITLG, TRA@, TRB@ | 2 | CD2(4), CD4(6) | 183520 | 10 | 10 | 10 | 3 | 1 | 5 | 1 | 0 | 3 | 0 | 0.73 | 0.0011 | 0.096 |
| 3 | NO2IL12PATHWAY | Macrophages activate NK cells by releasing IL-12, which induces NK cytotoxic activity in coordination with NO produced by inducible nitric oxide synthase II. | CCR5, CD2, CD3D, CD3E, CD3G, CD3Z, CD4, CXCR3, IFNG, IL12A, IL12B, IL12RB1, IL12RB2, JAK2, NOS2A, STAT4, TYK2 | 2 | CD2(4), CD4(6) | 183520 | 10 | 10 | 10 | 3 | 1 | 5 | 1 | 0 | 3 | 0 | 0.73 | 0.0011 | 0.096 |
| 4 | THELPERPATHWAY | Helper T cells coordinate the actions of B cells, macrophages, and other immune cells via surface molecules such as T cell receptor/CD3 and their characteristic marker CD4. | CD2, CD28, CD3D, CD3E, CD3G, CD3Z, CD4, ICAM1, ITGAL, ITGB2, PTPRC, THY1, TRA@, TRB@ | 2 | CD2(4), CD4(6) | 183520 | 10 | 10 | 10 | 3 | 1 | 5 | 1 | 0 | 3 | 0 | 0.73 | 0.0011 | 0.096 |
| 5 | ERBB3PATHWAY | Neuregulins bind to the receptor tyrosine kinases ErbB3 and ErbB4, surface-localized receptors whose overexpression induces tumor formation. | EGF, EGFR, ERBB3, NRG1, UBE2D1 | 1 | ERBB3(19) | 275528 | 19 | 17 | 17 | 2 | 5 | 10 | 3 | 0 | 1 | 0 | 0.21 | 0.0025 | 0.17 |
| 6 | RIBOSOMAL_PROTEINS | ANK2, APG10L, RPS23, B3GALT4, CDR1, DGKI, FAU, IL6ST, KIAA1394, LOC133957, MRPL19, NET_5, PIGK, RPL10, RPL11, RPL12, RPL13, RPL13, LOC388344, RPL13A, RPL13A, LOC283340, LOC387930, RPL14, RPL14, RPL14L, RPL15, RPL15, LOC136321, LOC402694, RPL17, RPL17, dJ612B15.1, RPL18, RPL18A, LOC285053, LOC347544, LOC390354, RPL18A, LOC390354, RPL19, RPL21, RPL21, LOC387753, LOC388143, LOC388532, LOC388621, LOC389156, LOC390488, LOC402336, LOC440487, LOC440575, RPL21, LOC387753, LOC388143, LOC388532, LOC388621, LOC389156, LOC390488, LOC440487, LOC440575, RPL22, RPL23, RPL24, RPL24, SLC36A2, RPL26, LOC391126, LOC392501, LOC400055, LOC441073, LOC441533, RPL27, RPL27A, RPL27A, LOC389435, RPL28, RPL29, RPL29, LOC283412, LOC284064, LOC389655, LOC391738, LOC401911, RPL3, RPL30, RPL31, RPL32, RPL34, LOC342994, RPL35, RPL35A, RPL36, RPL37, RPL38, RPL39, RPL3L, RPL4, RPL41, RPL5, RPL5, LOC388907, RPL5, RNU66, LOC388907, RPL6, RPL7, RPL7, LOC389305, RPL7, LOC90193, LOC388401, LOC389305, LOC392550, LOC439954, RPL7A, RPL7A, LOC133748, LOC388474, RPL7A, RNU36B, LOC133748, LOC388474, RPL8, RPL9, RPLP0, RPLP0, RPLP0_like, RPLP1, RPLP2, RPS10, RPS10, LOC158104, LOC388885, LOC389127, LOC390842, LOC401817, RPS10, LOC388885, RPS11, RPS12, RPS13, RPS14, RPS15, RPS16, RPS16, LOC441876, RPS17, RPS17, LOC402057, RPS18, RPS19, RPS2, RPS2, LOC91561, LOC148430, LOC286444, LOC400963, LOC440589, RPS20, RPS21, RPS23, RPS24, RPS25, RPS26, RPS26L, LOC440440, RPS27, RPS27A, RPS27A, LOC388720, LOC389425, RPS28, RPS29, RPS3, RPS3A, RPS3A, LOC146053, LOC400652, LOC401016, LOC439992, RPS4X, RPS4Y1, RPS5, RPS6, RPS6KA1, RPS6KA2, RPS6KA3, RPS6KA6, RPS6KB1, RPS6KB2, RPS7, RPS8, RPS9, RPSA, LOC388524, LOC388654, SCDR10, TBC1D10C, TSPAN9, UBA52, UBB, UBC | 10 | B3GALT4(3), RPL14(8), RPL28(3), RPS16(1), RPS18(3), RPS27(1), RPS8(2), UBB(2) | 786160 | 23 | 14 | 19 | 2 | 3 | 9 | 2 | 2 | 7 | 0 | 0.1 | 0.0033 | 0.19 | |
| 7 | NKTPATHWAY | T cell differentiation into Th1 and Th2 cells occurs by differential chemokine receptor expression, which mediates tissue localization and immune response. | CCL3, CCL4, CCR1, CCR2, CCR3, CCR4, CCR5, CCR7, CD28, CD4, CSF2, CXCR3, CXCR4, IFNG, IFNGR1, IFNGR2, IL12A, IL12B, IL12RB1, IL12RB2, IL18R1, IL2, IL4, IL4R, IL5, TGFB1, TGFB2, TGFB3, TNFSF5 | 1 | CD4(6) | 103168 | 6 | 6 | 6 | 3 | 1 | 3 | 0 | 0 | 2 | 0 | 0.81 | 0.006 | 0.19 |
| 8 | TCAPOPTOSISPATHWAY | HIV infection upregulates Fas ligand in macrophages and CD4 in helper T cells, leading to widespread Fas-induced T cell apoptosis. | CCR5, CD28, CD3D, CD3E, CD3G, CD3Z, CD4, TNFRSF6, TNFSF6, TRA@, TRB@ | 1 | CD4(6) | 103168 | 6 | 6 | 6 | 3 | 1 | 3 | 0 | 0 | 2 | 0 | 0.81 | 0.006 | 0.19 |
| 9 | ATP_SYNTHESIS | ATP5E, ATP5O, ATP6AP1, ATP6V0A1, ATP6V0A4, ATP6V0B, ATP6V0C, ATP6V0C, SHMT1, ATP6V0D1, ATP6V0E, ATP6V1A, ATP6V1B1, ATP6V1B2, ATP6V1C1, ATP6V1C2, ATP6V1D, ATP6V1E1, ATP6V1F, ATP6V1G1, ATP6V1G2, ATP6V1G3, ATP6V1H | 1 | ATP6AP1(8) | 95976 | 8 | 8 | 8 | 3 | 0 | 6 | 0 | 0 | 2 | 0 | 0.65 | 0.0092 | 0.19 | |
| 10 | FLAGELLAR_ASSEMBLY | ATP5E, ATP5O, ATP6AP1, ATP6V0A1, ATP6V0A4, ATP6V0B, ATP6V0C, ATP6V0C, SHMT1, ATP6V0D1, ATP6V0E, ATP6V1A, ATP6V1B1, ATP6V1B2, ATP6V1C1, ATP6V1C2, ATP6V1D, ATP6V1E1, ATP6V1F, ATP6V1G1, ATP6V1G2, ATP6V1G3, ATP6V1H | 1 | ATP6AP1(8) | 95976 | 8 | 8 | 8 | 3 | 0 | 6 | 0 | 0 | 2 | 0 | 0.65 | 0.0092 | 0.19 |
Table 7. Get Full Table A Ranked List of Significantly Mutated Genesets (Excluding Significantly Mutated Genes). Number of significant genesets found: 0. Number of genesets displayed: 10
| rank | geneset | description | genes | N_genes | mut_tally | N | n | npat | nsite | nsil | n1 | n2 | n3 | n4 | n5 | n6 | p_ns_s | p | q |
|---|---|---|---|---|---|---|---|---|---|---|---|---|---|---|---|---|---|---|---|
| 1 | IL17PATHWAY | Activated T cells secrete IL-17, which stimulates fibroblasts and other cells to secrete inflammatory and hematopoietic cytokines. | CD2, CD34, CD3D, CD3E, CD3G, CD3Z, CD4, CD58, CD8A, CSF3, IL17, IL3, IL6, IL8, KITLG, TRA@, TRB@ | 2 | CD2(4), CD4(6) | 183520 | 10 | 10 | 10 | 3 | 1 | 5 | 1 | 0 | 3 | 0 | 0.73 | 0.0011 | 0.13 |
| 2 | NO2IL12PATHWAY | Macrophages activate NK cells by releasing IL-12, which induces NK cytotoxic activity in coordination with NO produced by inducible nitric oxide synthase II. | CCR5, CD2, CD3D, CD3E, CD3G, CD3Z, CD4, CXCR3, IFNG, IL12A, IL12B, IL12RB1, IL12RB2, JAK2, NOS2A, STAT4, TYK2 | 2 | CD2(4), CD4(6) | 183520 | 10 | 10 | 10 | 3 | 1 | 5 | 1 | 0 | 3 | 0 | 0.73 | 0.0011 | 0.13 |
| 3 | THELPERPATHWAY | Helper T cells coordinate the actions of B cells, macrophages, and other immune cells via surface molecules such as T cell receptor/CD3 and their characteristic marker CD4. | CD2, CD28, CD3D, CD3E, CD3G, CD3Z, CD4, ICAM1, ITGAL, ITGB2, PTPRC, THY1, TRA@, TRB@ | 2 | CD2(4), CD4(6) | 183520 | 10 | 10 | 10 | 3 | 1 | 5 | 1 | 0 | 3 | 0 | 0.73 | 0.0011 | 0.13 |
| 4 | NKTPATHWAY | T cell differentiation into Th1 and Th2 cells occurs by differential chemokine receptor expression, which mediates tissue localization and immune response. | CCL3, CCL4, CCR1, CCR2, CCR3, CCR4, CCR5, CCR7, CD28, CD4, CSF2, CXCR3, CXCR4, IFNG, IFNGR1, IFNGR2, IL12A, IL12B, IL12RB1, IL12RB2, IL18R1, IL2, IL4, IL4R, IL5, TGFB1, TGFB2, TGFB3, TNFSF5 | 1 | CD4(6) | 103168 | 6 | 6 | 6 | 3 | 1 | 3 | 0 | 0 | 2 | 0 | 0.81 | 0.006 | 0.22 |
| 5 | TCAPOPTOSISPATHWAY | HIV infection upregulates Fas ligand in macrophages and CD4 in helper T cells, leading to widespread Fas-induced T cell apoptosis. | CCR5, CD28, CD3D, CD3E, CD3G, CD3Z, CD4, TNFRSF6, TNFSF6, TRA@, TRB@ | 1 | CD4(6) | 103168 | 6 | 6 | 6 | 3 | 1 | 3 | 0 | 0 | 2 | 0 | 0.81 | 0.006 | 0.22 |
| 6 | ATP_SYNTHESIS | ATP5E, ATP5O, ATP6AP1, ATP6V0A1, ATP6V0A4, ATP6V0B, ATP6V0C, ATP6V0C, SHMT1, ATP6V0D1, ATP6V0E, ATP6V1A, ATP6V1B1, ATP6V1B2, ATP6V1C1, ATP6V1C2, ATP6V1D, ATP6V1E1, ATP6V1F, ATP6V1G1, ATP6V1G2, ATP6V1G3, ATP6V1H | 1 | ATP6AP1(8) | 95976 | 8 | 8 | 8 | 3 | 0 | 6 | 0 | 0 | 2 | 0 | 0.65 | 0.0092 | 0.22 | |
| 7 | FLAGELLAR_ASSEMBLY | ATP5E, ATP5O, ATP6AP1, ATP6V0A1, ATP6V0A4, ATP6V0B, ATP6V0C, ATP6V0C, SHMT1, ATP6V0D1, ATP6V0E, ATP6V1A, ATP6V1B1, ATP6V1B2, ATP6V1C1, ATP6V1C2, ATP6V1D, ATP6V1E1, ATP6V1F, ATP6V1G1, ATP6V1G2, ATP6V1G3, ATP6V1H | 1 | ATP6AP1(8) | 95976 | 8 | 8 | 8 | 3 | 0 | 6 | 0 | 0 | 2 | 0 | 0.65 | 0.0092 | 0.22 | |
| 8 | PHOTOSYNTHESIS | ATP5E, ATP5O, ATP6AP1, ATP6V0A1, ATP6V0A4, ATP6V0B, ATP6V0C, ATP6V0C, SHMT1, ATP6V0D1, ATP6V0E, ATP6V1A, ATP6V1B1, ATP6V1B2, ATP6V1C1, ATP6V1C2, ATP6V1D, ATP6V1E1, ATP6V1F, ATP6V1G1, ATP6V1G2, ATP6V1G3, ATP6V1H, FDXR | 1 | ATP6AP1(8) | 95976 | 8 | 8 | 8 | 3 | 0 | 6 | 0 | 0 | 2 | 0 | 0.65 | 0.0092 | 0.22 | |
| 9 | TYPE_III_SECRETION_SYSTEM | ATP5E, ATP5O, ATP6AP1, ATP6V0A1, ATP6V0A4, ATP6V0B, ATP6V0C, ATP6V0C, SHMT1, ATP6V0D1, ATP6V0E, ATP6V1A, ATP6V1B1, ATP6V1B2, ATP6V1C1, ATP6V1C2, ATP6V1D, ATP6V1E1, ATP6V1F, ATP6V1G1, ATP6V1G2, ATP6V1G3, ATP6V1H | 1 | ATP6AP1(8) | 95976 | 8 | 8 | 8 | 3 | 0 | 6 | 0 | 0 | 2 | 0 | 0.65 | 0.0092 | 0.22 | |
| 10 | UBIQUINONE_BIOSYNTHESIS | NDUFA1, NDUFA10, NDUFA11, NDUFA4, NDUFA5, NDUFA8, NDUFB2, NDUFB4, NDUFB5, NDUFB6, NDUFB7, NDUFS1, NDUFS2, NDUFV1, NDUFV2 | 1 | NDUFB7(3) | 33976 | 3 | 3 | 3 | 0 | 0 | 1 | 1 | 1 | 0 | 0 | 0.44 | 0.012 | 0.22 |
In brief, we tabulate the number of mutations and the number of covered bases for each gene. The counts are broken down by mutation context category: four context categories that are discovered by MutSig, and one for indel and 'null' mutations, which include indels, nonsense mutations, splice-site mutations, and non-stop (read-through) mutations. For each gene, we calculate the probability of seeing the observed constellation of mutations, i.e. the product P1 x P2 x ... x Pm, or a more extreme one, given the background mutation rates calculated across the dataset. [1]
This is an experimental feature. The full results of the analysis summarized in this report can be downloaded from the TCGA Data Coordination Center.