This pipeline computes the correlation between significant arm-level copy number variations (cnvs) and selected clinical features.
Testing the association between copy number variation 78 arm-level results and 5 clinical features across 820 patients, 4 significant findings detected with Q value < 0.25.
-
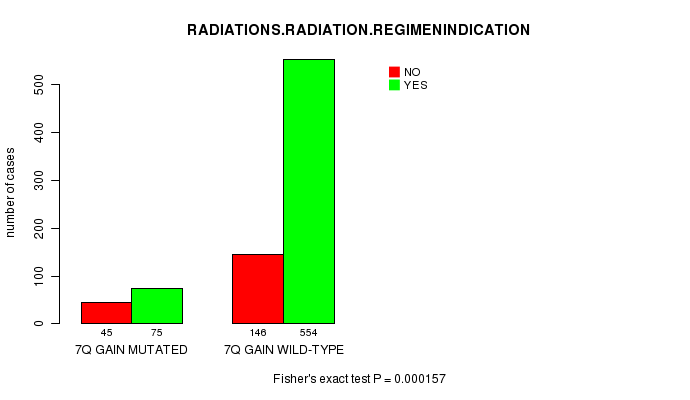
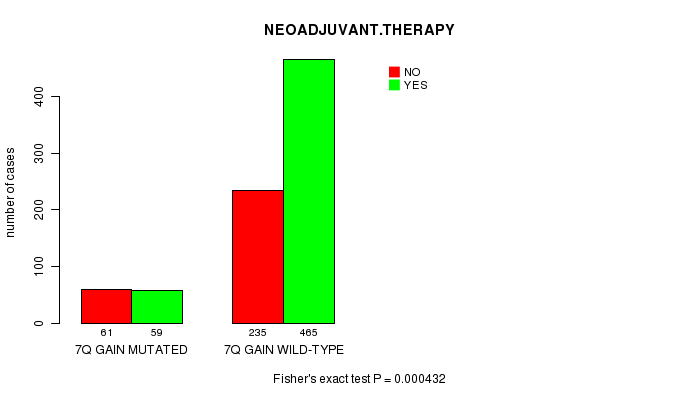
7q gain cnv correlated to 'RADIATIONS.RADIATION.REGIMENINDICATION' and 'NEOADJUVANT.THERAPY'.
-
1p loss cnv correlated to 'AGE'.
-
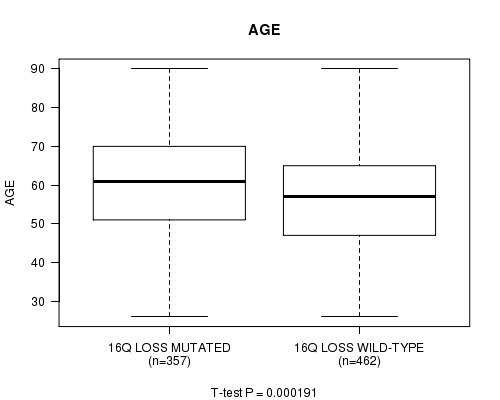
16q loss cnv correlated to 'AGE'.
Table 1. Get Full Table Overview of the association between significant copy number variation of 78 arm-level results and 5 clinical features. Shown in the table are P values (Q values). Thresholded by Q value < 0.25, 4 significant findings detected.
|
Clinical Features |
Time to Death |
AGE | GENDER |
RADIATIONS RADIATION REGIMENINDICATION |
NEOADJUVANT THERAPY |
||
| nCNV (%) | nWild-Type | logrank test | t-test | Fisher's exact test | Fisher's exact test | Fisher's exact test | |
| 7q gain | 120 (15%) | 700 |
0.366 (1.00) |
0.964 (1.00) |
0.0304 (1.00) |
0.000157 (0.061) |
0.000432 (0.167) |
| 1p loss | 120 (15%) | 700 |
0.13 (1.00) |
3.17e-05 (0.0124) |
1 (1.00) |
0.198 (1.00) |
0.0639 (1.00) |
| 16q loss | 357 (44%) | 463 |
0.326 (1.00) |
0.000191 (0.0742) |
0.513 (1.00) |
0.0671 (1.00) |
0.884 (1.00) |
| 1p gain | 102 (12%) | 718 |
0.446 (1.00) |
0.187 (1.00) |
1 (1.00) |
0.316 (1.00) |
0.509 (1.00) |
| 1q gain | 470 (57%) | 350 |
0.0147 (1.00) |
0.989 (1.00) |
0.74 (1.00) |
0.212 (1.00) |
1 (1.00) |
| 2p gain | 56 (7%) | 764 |
0.893 (1.00) |
0.788 (1.00) |
1 (1.00) |
0.329 (1.00) |
0.666 (1.00) |
| 2q gain | 30 (4%) | 790 |
0.396 (1.00) |
0.27 (1.00) |
1 (1.00) |
0.0443 (1.00) |
0.44 (1.00) |
| 3p gain | 43 (5%) | 777 |
0.116 (1.00) |
0.101 (1.00) |
1 (1.00) |
0.269 (1.00) |
0.872 (1.00) |
| 3q gain | 107 (13%) | 713 |
0.467 (1.00) |
0.811 (1.00) |
1 (1.00) |
0.713 (1.00) |
0.334 (1.00) |
| 4p gain | 33 (4%) | 787 |
0.114 (1.00) |
0.55 (1.00) |
1 (1.00) |
1 (1.00) |
0.356 (1.00) |
| 4q gain | 29 (4%) | 791 |
0.0321 (1.00) |
0.515 (1.00) |
1 (1.00) |
1 (1.00) |
0.846 (1.00) |
| 5p gain | 168 (20%) | 652 |
0.55 (1.00) |
0.05 (1.00) |
1 (1.00) |
0.0184 (1.00) |
0.207 (1.00) |
| 5q gain | 96 (12%) | 724 |
0.785 (1.00) |
0.00473 (1.00) |
1 (1.00) |
0.0097 (1.00) |
0.175 (1.00) |
| 6p gain | 108 (13%) | 712 |
0.903 (1.00) |
0.645 (1.00) |
1 (1.00) |
0.178 (1.00) |
0.914 (1.00) |
| 6q gain | 66 (8%) | 754 |
0.059 (1.00) |
0.19 (1.00) |
0.532 (1.00) |
0.448 (1.00) |
0.505 (1.00) |
| 7p gain | 155 (19%) | 665 |
0.777 (1.00) |
0.169 (1.00) |
0.0149 (1.00) |
0.00145 (0.559) |
0.00694 (1.00) |
| 8p gain | 177 (22%) | 643 |
0.876 (1.00) |
0.0343 (1.00) |
1 (1.00) |
0.366 (1.00) |
0.724 (1.00) |
| 8q gain | 385 (47%) | 435 |
0.35 (1.00) |
0.0471 (1.00) |
0.319 (1.00) |
0.0313 (1.00) |
0.0811 (1.00) |
| 9p gain | 64 (8%) | 756 |
0.135 (1.00) |
0.514 (1.00) |
1 (1.00) |
0.0656 (1.00) |
0.222 (1.00) |
| 9q gain | 49 (6%) | 771 |
0.927 (1.00) |
0.501 (1.00) |
0.427 (1.00) |
0.223 (1.00) |
0.358 (1.00) |
| 10p gain | 118 (14%) | 702 |
0.73 (1.00) |
0.686 (1.00) |
0.372 (1.00) |
0.197 (1.00) |
0.679 (1.00) |
| 10q gain | 35 (4%) | 785 |
0.778 (1.00) |
0.302 (1.00) |
1 (1.00) |
0.421 (1.00) |
0.28 (1.00) |
| 11p gain | 46 (6%) | 774 |
0.687 (1.00) |
0.755 (1.00) |
0.407 (1.00) |
0.859 (1.00) |
1 (1.00) |
| 11q gain | 40 (5%) | 780 |
0.0056 (1.00) |
0.0787 (1.00) |
1 (1.00) |
0.447 (1.00) |
0.501 (1.00) |
| 12p gain | 106 (13%) | 714 |
0.483 (1.00) |
0.133 (1.00) |
0.328 (1.00) |
0.0842 (1.00) |
0.449 (1.00) |
| 12q gain | 89 (11%) | 731 |
0.614 (1.00) |
0.0171 (1.00) |
0.0107 (1.00) |
0.288 (1.00) |
0.726 (1.00) |
| 13q gain | 45 (5%) | 775 |
0.0254 (1.00) |
0.884 (1.00) |
1 (1.00) |
0.276 (1.00) |
0.203 (1.00) |
| 14q gain | 70 (9%) | 750 |
0.406 (1.00) |
0.902 (1.00) |
1 (1.00) |
0.882 (1.00) |
0.796 (1.00) |
| 15q gain | 40 (5%) | 780 |
0.782 (1.00) |
0.687 (1.00) |
0.364 (1.00) |
0.337 (1.00) |
0.24 (1.00) |
| 16p gain | 247 (30%) | 573 |
0.139 (1.00) |
0.0235 (1.00) |
0.731 (1.00) |
0.53 (1.00) |
0.635 (1.00) |
| 16q gain | 61 (7%) | 759 |
0.0644 (1.00) |
0.325 (1.00) |
0.503 (1.00) |
0.637 (1.00) |
0.212 (1.00) |
| 17p gain | 50 (6%) | 770 |
0.369 (1.00) |
0.23 (1.00) |
0.0997 (1.00) |
0.393 (1.00) |
0.879 (1.00) |
| 17q gain | 146 (18%) | 674 |
0.715 (1.00) |
0.794 (1.00) |
0.0115 (1.00) |
0.589 (1.00) |
0.107 (1.00) |
| 18p gain | 74 (9%) | 746 |
0.0838 (1.00) |
0.0487 (1.00) |
0.575 (1.00) |
0.00879 (1.00) |
0.8 (1.00) |
| 18q gain | 68 (8%) | 752 |
0.249 (1.00) |
0.424 (1.00) |
0.543 (1.00) |
0.0235 (1.00) |
0.792 (1.00) |
| 19p gain | 67 (8%) | 753 |
0.108 (1.00) |
0.934 (1.00) |
0.163 (1.00) |
0.295 (1.00) |
0.598 (1.00) |
| 19q gain | 86 (10%) | 734 |
0.218 (1.00) |
0.809 (1.00) |
0.242 (1.00) |
0.137 (1.00) |
0.637 (1.00) |
| 20p gain | 204 (25%) | 616 |
0.0931 (1.00) |
0.284 (1.00) |
0.237 (1.00) |
0.924 (1.00) |
0.801 (1.00) |
| 20q gain | 256 (31%) | 564 |
0.158 (1.00) |
0.801 (1.00) |
0.147 (1.00) |
0.929 (1.00) |
0.638 (1.00) |
| 21q gain | 102 (12%) | 718 |
0.0915 (1.00) |
0.122 (1.00) |
1 (1.00) |
0.133 (1.00) |
0.509 (1.00) |
| 22q gain | 34 (4%) | 786 |
0.551 (1.00) |
0.102 (1.00) |
1 (1.00) |
0.301 (1.00) |
0.469 (1.00) |
| 1q loss | 20 (2%) | 800 |
0.313 (1.00) |
0.032 (1.00) |
1 (1.00) |
0.591 (1.00) |
1 (1.00) |
| 2p loss | 66 (8%) | 754 |
0.776 (1.00) |
0.343 (1.00) |
1 (1.00) |
0.879 (1.00) |
0.69 (1.00) |
| 2q loss | 80 (10%) | 740 |
0.559 (1.00) |
0.857 (1.00) |
1 (1.00) |
0.489 (1.00) |
0.903 (1.00) |
| 3p loss | 132 (16%) | 688 |
0.0786 (1.00) |
0.0276 (1.00) |
1 (1.00) |
1 (1.00) |
0.768 (1.00) |
| 3q loss | 47 (6%) | 773 |
0.0108 (1.00) |
0.182 (1.00) |
1 (1.00) |
0.723 (1.00) |
0.64 (1.00) |
| 4p loss | 181 (22%) | 639 |
0.53 (1.00) |
0.125 (1.00) |
1 (1.00) |
0.921 (1.00) |
0.599 (1.00) |
| 4q loss | 146 (18%) | 674 |
0.755 (1.00) |
0.633 (1.00) |
0.374 (1.00) |
0.45 (1.00) |
0.394 (1.00) |
| 5p loss | 73 (9%) | 747 |
0.369 (1.00) |
0.652 (1.00) |
0.57 (1.00) |
0.664 (1.00) |
0.0733 (1.00) |
| 5q loss | 127 (15%) | 693 |
0.595 (1.00) |
0.0327 (1.00) |
1 (1.00) |
0.648 (1.00) |
0.0874 (1.00) |
| 6p loss | 119 (15%) | 701 |
0.778 (1.00) |
0.0349 (1.00) |
0.372 (1.00) |
0.482 (1.00) |
1 (1.00) |
| 6q loss | 178 (22%) | 642 |
0.901 (1.00) |
0.0134 (1.00) |
0.218 (1.00) |
0.617 (1.00) |
0.86 (1.00) |
| 7p loss | 57 (7%) | 763 |
0.694 (1.00) |
0.244 (1.00) |
1 (1.00) |
0.871 (1.00) |
0.118 (1.00) |
| 7q loss | 76 (9%) | 744 |
0.0992 (1.00) |
0.0773 (1.00) |
1 (1.00) |
0.776 (1.00) |
0.316 (1.00) |
| 8p loss | 277 (34%) | 543 |
0.0414 (1.00) |
0.963 (1.00) |
0.496 (1.00) |
0.221 (1.00) |
0.249 (1.00) |
| 8q loss | 46 (6%) | 774 |
0.628 (1.00) |
0.134 (1.00) |
1 (1.00) |
0.719 (1.00) |
0.435 (1.00) |
| 9p loss | 183 (22%) | 637 |
0.00385 (1.00) |
0.379 (1.00) |
0.118 (1.00) |
0.374 (1.00) |
0.0364 (1.00) |
| 9q loss | 146 (18%) | 674 |
0.18 (1.00) |
0.32 (1.00) |
0.205 (1.00) |
0.746 (1.00) |
0.0711 (1.00) |
| 10p loss | 85 (10%) | 735 |
0.115 (1.00) |
0.0345 (1.00) |
0.609 (1.00) |
0.223 (1.00) |
0.0738 (1.00) |
| 10q loss | 125 (15%) | 695 |
0.00105 (0.406) |
0.27 (1.00) |
0.369 (1.00) |
0.566 (1.00) |
0.226 (1.00) |
| 11p loss | 175 (21%) | 645 |
0.00257 (0.986) |
0.896 (1.00) |
0.693 (1.00) |
0.687 (1.00) |
0.929 (1.00) |
| 11q loss | 277 (34%) | 543 |
0.182 (1.00) |
0.622 (1.00) |
0.174 (1.00) |
0.663 (1.00) |
0.54 (1.00) |
| 12p loss | 82 (10%) | 738 |
0.539 (1.00) |
0.267 (1.00) |
1 (1.00) |
0.784 (1.00) |
0.548 (1.00) |
| 12q loss | 69 (8%) | 751 |
0.443 (1.00) |
0.503 (1.00) |
1 (1.00) |
0.179 (1.00) |
1 (1.00) |
| 13q loss | 259 (32%) | 561 |
0.14 (1.00) |
0.132 (1.00) |
0.474 (1.00) |
0.79 (1.00) |
0.876 (1.00) |
| 14q loss | 139 (17%) | 681 |
0.0046 (1.00) |
0.665 (1.00) |
0.37 (1.00) |
0.66 (1.00) |
0.0527 (1.00) |
| 15q loss | 159 (19%) | 661 |
0.128 (1.00) |
0.396 (1.00) |
0.219 (1.00) |
0.532 (1.00) |
0.713 (1.00) |
| 16p loss | 79 (10%) | 741 |
0.485 (1.00) |
0.376 (1.00) |
0.212 (1.00) |
0.675 (1.00) |
0.713 (1.00) |
| 17p loss | 371 (45%) | 449 |
0.238 (1.00) |
0.0419 (1.00) |
0.739 (1.00) |
0.0968 (1.00) |
0.273 (1.00) |
| 17q loss | 151 (18%) | 669 |
0.482 (1.00) |
0.327 (1.00) |
0.379 (1.00) |
0.594 (1.00) |
0.779 (1.00) |
| 18p loss | 172 (21%) | 648 |
0.0179 (1.00) |
0.00744 (1.00) |
0.693 (1.00) |
0.361 (1.00) |
0.722 (1.00) |
| 18q loss | 179 (22%) | 641 |
0.103 (1.00) |
0.0276 (1.00) |
0.692 (1.00) |
0.618 (1.00) |
0.334 (1.00) |
| 19p loss | 86 (10%) | 734 |
0.643 (1.00) |
0.883 (1.00) |
0.609 (1.00) |
0.224 (1.00) |
0.0981 (1.00) |
| 19q loss | 63 (8%) | 757 |
0.48 (1.00) |
0.652 (1.00) |
1 (1.00) |
0.0881 (1.00) |
0.0197 (1.00) |
| 20p loss | 54 (7%) | 766 |
0.00473 (1.00) |
0.586 (1.00) |
0.46 (1.00) |
0.869 (1.00) |
0.77 (1.00) |
| 20q loss | 23 (3%) | 797 |
0.0889 (1.00) |
0.179 (1.00) |
1 (1.00) |
0.802 (1.00) |
0.188 (1.00) |
| 21q loss | 82 (10%) | 738 |
0.702 (1.00) |
0.639 (1.00) |
0.61 (1.00) |
0.584 (1.00) |
0.116 (1.00) |
| 22q loss | 282 (34%) | 538 |
0.193 (1.00) |
0.433 (1.00) |
0.288 (1.00) |
0.0819 (1.00) |
0.878 (1.00) |
P value = 0.000157 (Fisher's exact test), Q value = 0.061
Table S1. Gene #14: '7q gain mutation analysis' versus Clinical Feature #4: 'RADIATIONS.RADIATION.REGIMENINDICATION'
| nPatients | NO | YES |
|---|---|---|
| ALL | 191 | 629 |
| 7Q GAIN MUTATED | 45 | 75 |
| 7Q GAIN WILD-TYPE | 146 | 554 |
Figure S1. Get High-res Image Gene #14: '7q gain mutation analysis' versus Clinical Feature #4: 'RADIATIONS.RADIATION.REGIMENINDICATION'
P value = 0.000432 (Fisher's exact test), Q value = 0.17
Table S2. Gene #14: '7q gain mutation analysis' versus Clinical Feature #5: 'NEOADJUVANT.THERAPY'
| nPatients | NO | YES |
|---|---|---|
| ALL | 296 | 524 |
| 7Q GAIN MUTATED | 61 | 59 |
| 7Q GAIN WILD-TYPE | 235 | 465 |
Figure S2. Get High-res Image Gene #14: '7q gain mutation analysis' versus Clinical Feature #5: 'NEOADJUVANT.THERAPY'
P value = 3.17e-05 (t-test), Q value = 0.012
Table S3. Gene #40: '1p loss mutation analysis' versus Clinical Feature #2: 'AGE'
| nPatients | Mean (Std.Dev) | |
|---|---|---|
| ALL | 819 | 58.4 (13.2) |
| 1P LOSS MUTATED | 120 | 63.0 (12.6) |
| 1P LOSS WILD-TYPE | 699 | 57.6 (13.2) |
Figure S3. Get High-res Image Gene #40: '1p loss mutation analysis' versus Clinical Feature #2: 'AGE'

P value = 0.000191 (t-test), Q value = 0.074
Table S4. Gene #68: '16q loss mutation analysis' versus Clinical Feature #2: 'AGE'
| nPatients | Mean (Std.Dev) | |
|---|---|---|
| ALL | 819 | 58.4 (13.2) |
| 16Q LOSS MUTATED | 357 | 60.3 (13.0) |
| 16Q LOSS WILD-TYPE | 462 | 56.9 (13.3) |
Figure S4. Get High-res Image Gene #68: '16q loss mutation analysis' versus Clinical Feature #2: 'AGE'
-
Mutation data file = broad_values_by_arm.mutsig.cluster.txt
-
Clinical data file = BRCA.clin.merged.picked.txt
-
Number of patients = 820
-
Number of significantly arm-level cnvs = 78
-
Number of selected clinical features = 5
-
Exclude genes that fewer than K tumors have mutations, K = 3
For survival clinical features, the Kaplan-Meier survival curves of tumors with and without gene mutations were plotted and the statistical significance P values were estimated by logrank test (Bland and Altman 2004) using the 'survdiff' function in R
For continuous numerical clinical features, two-tailed Student's t test with unequal variance (Lehmann and Romano 2005) was applied to compare the clinical values between tumors with and without gene mutations using 't.test' function in R
For binary or multi-class clinical features (nominal or ordinal), two-tailed Fisher's exact tests (Fisher 1922) were used to estimate the P values using the 'fisher.test' function in R
For multiple hypothesis correction, Q value is the False Discovery Rate (FDR) analogue of the P value (Benjamini and Hochberg 1995), defined as the minimum FDR at which the test may be called significant. We used the 'Benjamini and Hochberg' method of 'p.adjust' function in R to convert P values into Q values.
This is an experimental feature. The full results of the analysis summarized in this report can be downloaded from the TCGA Data Coordination Center.