This pipeline computes the correlation between significant arm-level copy number variations (cnvs) and selected clinical features.
Testing the association between copy number variation 77 arm-level results and 6 clinical features across 540 patients, 9 significant findings detected with Q value < 0.25.
-
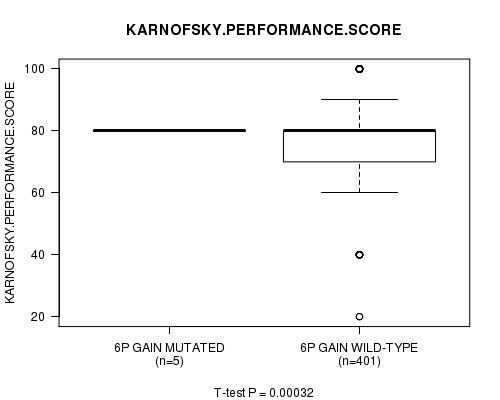
6p gain cnv correlated to 'KARNOFSKY.PERFORMANCE.SCORE'.
-
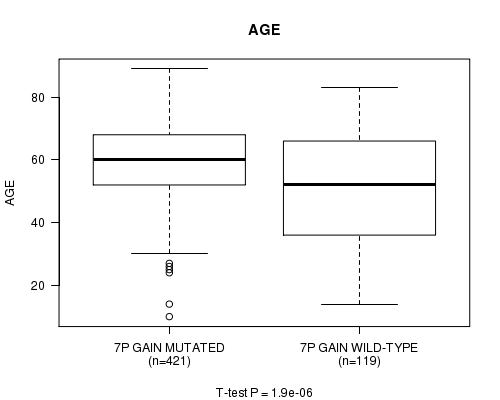
7p gain cnv correlated to 'AGE'.
-
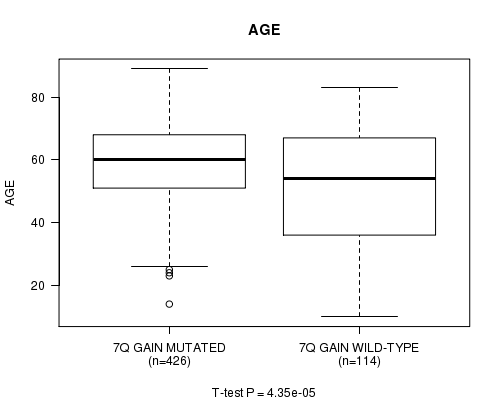
7q gain cnv correlated to 'AGE'.
-
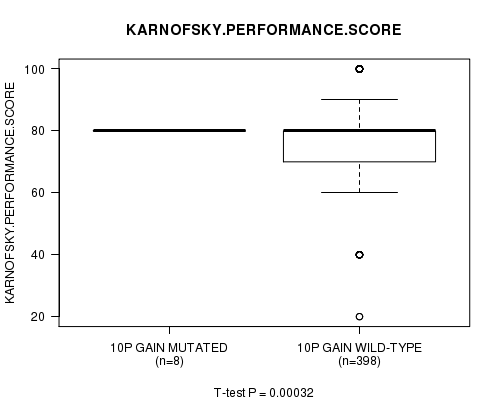
10p gain cnv correlated to 'KARNOFSKY.PERFORMANCE.SCORE'.
-
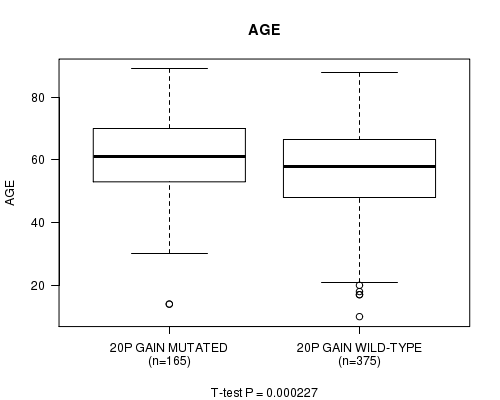
20p gain cnv correlated to 'AGE'.
-
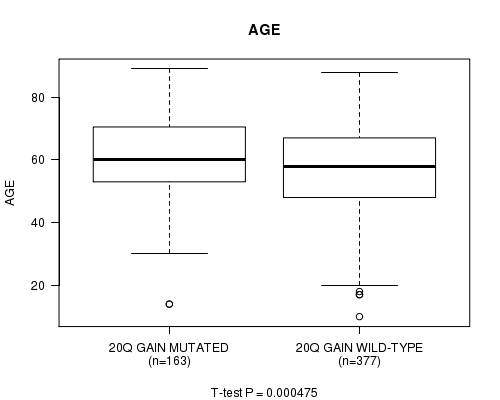
20q gain cnv correlated to 'AGE'.
-
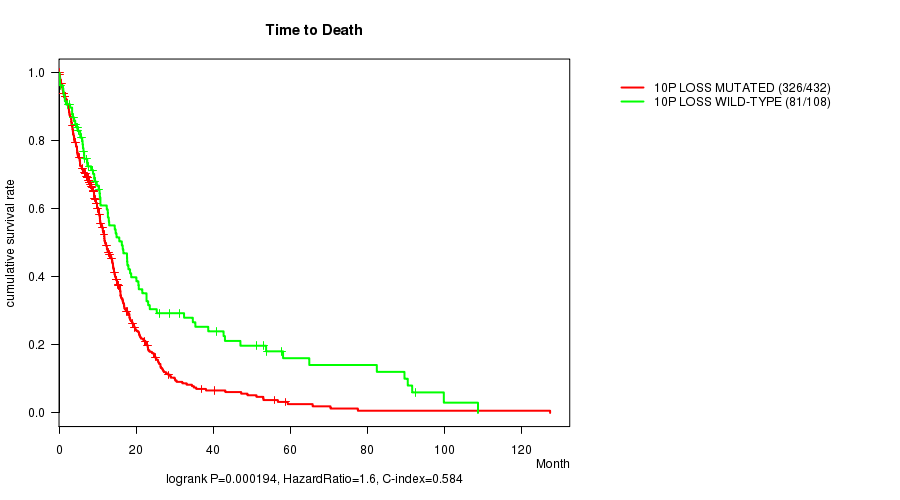
10p loss cnv correlated to 'Time to Death' and 'AGE'.
-
10q loss cnv correlated to 'AGE'.
Table 1. Get Full Table Overview of the association between significant copy number variation of 77 arm-level results and 6 clinical features. Shown in the table are P values (Q values). Thresholded by Q value < 0.25, 9 significant findings detected.
|
Clinical Features |
Time to Death |
AGE | GENDER |
KARNOFSKY PERFORMANCE SCORE |
RADIATIONS RADIATION REGIMENINDICATION |
NEOADJUVANT THERAPY |
||
| nCNV (%) | nWild-Type | logrank test | t-test | Fisher's exact test | t-test | Fisher's exact test | Fisher's exact test | |
| 10p loss | 432 (80%) | 108 |
0.000194 (0.0885) |
9.57e-09 (4.4e-06) |
0.189 (1.00) |
0.361 (1.00) |
0.645 (1.00) |
0.198 (1.00) |
| 6p gain | 11 (2%) | 529 |
0.0971 (1.00) |
0.0389 (1.00) |
1 (1.00) |
0.00032 (0.145) |
0.516 (1.00) |
0.763 (1.00) |
| 7p gain | 421 (78%) | 119 |
0.00853 (1.00) |
1.9e-06 (0.000868) |
0.459 (1.00) |
0.871 (1.00) |
0.0578 (1.00) |
0.755 (1.00) |
| 7q gain | 426 (79%) | 114 |
0.019 (1.00) |
4.35e-05 (0.0199) |
0.452 (1.00) |
0.976 (1.00) |
0.175 (1.00) |
0.292 (1.00) |
| 10p gain | 8 (1%) | 532 |
0.011 (1.00) |
0.00345 (1.00) |
0.064 (1.00) |
0.00032 (0.145) |
1 (1.00) |
0.485 (1.00) |
| 20p gain | 165 (31%) | 375 |
0.959 (1.00) |
0.000227 (0.103) |
1 (1.00) |
0.482 (1.00) |
0.134 (1.00) |
1 (1.00) |
| 20q gain | 163 (30%) | 377 |
0.864 (1.00) |
0.000475 (0.215) |
0.702 (1.00) |
0.524 (1.00) |
0.131 (1.00) |
0.778 (1.00) |
| 10q loss | 445 (82%) | 95 |
0.00135 (0.609) |
6.89e-08 (3.16e-05) |
0.818 (1.00) |
0.184 (1.00) |
1 (1.00) |
0.259 (1.00) |
| 1p gain | 37 (7%) | 503 |
0.963 (1.00) |
0.815 (1.00) |
0.863 (1.00) |
0.552 (1.00) |
0.856 (1.00) |
0.733 (1.00) |
| 1q gain | 42 (8%) | 498 |
0.65 (1.00) |
0.529 (1.00) |
0.871 (1.00) |
0.998 (1.00) |
0.864 (1.00) |
0.749 (1.00) |
| 2p gain | 18 (3%) | 522 |
0.823 (1.00) |
0.418 (1.00) |
0.807 (1.00) |
0.791 (1.00) |
0.0702 (1.00) |
0.242 (1.00) |
| 2q gain | 15 (3%) | 525 |
0.161 (1.00) |
0.971 (1.00) |
0.79 (1.00) |
0.595 (1.00) |
0.0453 (1.00) |
0.794 (1.00) |
| 3p gain | 28 (5%) | 512 |
0.27 (1.00) |
0.125 (1.00) |
0.843 (1.00) |
0.538 (1.00) |
0.534 (1.00) |
0.562 (1.00) |
| 3q gain | 32 (6%) | 508 |
0.525 (1.00) |
0.128 (1.00) |
0.854 (1.00) |
0.359 (1.00) |
0.7 (1.00) |
0.362 (1.00) |
| 4p gain | 12 (2%) | 528 |
0.125 (1.00) |
0.466 (1.00) |
0.771 (1.00) |
0.497 (1.00) |
0.115 (1.00) |
0.0399 (1.00) |
| 4q gain | 12 (2%) | 528 |
0.00934 (1.00) |
0.33 (1.00) |
0.555 (1.00) |
0.195 (1.00) |
0.115 (1.00) |
0.391 (1.00) |
| 5p gain | 26 (5%) | 514 |
0.577 (1.00) |
0.226 (1.00) |
0.541 (1.00) |
0.0543 (1.00) |
0.0831 (1.00) |
0.549 (1.00) |
| 5q gain | 21 (4%) | 519 |
0.925 (1.00) |
0.815 (1.00) |
0.499 (1.00) |
0.211 (1.00) |
0.239 (1.00) |
0.661 (1.00) |
| 6q gain | 11 (2%) | 529 |
0.21 (1.00) |
0.0341 (1.00) |
1 (1.00) |
0.849 (1.00) |
1 (1.00) |
0.364 (1.00) |
| 8p gain | 26 (5%) | 514 |
0.189 (1.00) |
0.437 (1.00) |
1 (1.00) |
0.397 (1.00) |
0.518 (1.00) |
0.317 (1.00) |
| 8q gain | 34 (6%) | 506 |
0.448 (1.00) |
0.0299 (1.00) |
0.858 (1.00) |
0.897 (1.00) |
0.851 (1.00) |
1 (1.00) |
| 9p gain | 16 (3%) | 524 |
0.413 (1.00) |
0.0649 (1.00) |
0.443 (1.00) |
0.0955 (1.00) |
0.414 (1.00) |
0.613 (1.00) |
| 9q gain | 36 (7%) | 504 |
0.0247 (1.00) |
0.0297 (1.00) |
0.219 (1.00) |
0.0236 (1.00) |
0.46 (1.00) |
0.734 (1.00) |
| 11p gain | 6 (1%) | 534 |
0.221 (1.00) |
0.765 (1.00) |
0.222 (1.00) |
0.24 (1.00) |
1 (1.00) |
0.689 (1.00) |
| 11q gain | 7 (1%) | 533 |
0.952 (1.00) |
0.989 (1.00) |
0.708 (1.00) |
0.651 (1.00) |
1 (1.00) |
0.016 (1.00) |
| 12p gain | 39 (7%) | 501 |
0.46 (1.00) |
0.0976 (1.00) |
1 (1.00) |
0.363 (1.00) |
0.153 (1.00) |
0.74 (1.00) |
| 12q gain | 28 (5%) | 512 |
0.25 (1.00) |
0.93 (1.00) |
0.843 (1.00) |
0.683 (1.00) |
0.298 (1.00) |
1 (1.00) |
| 13q gain | 3 (1%) | 537 |
0.589 (1.00) |
0.886 (1.00) |
0.566 (1.00) |
0.247 (1.00) |
0.239 (1.00) |
0.605 (1.00) |
| 14q gain | 8 (1%) | 532 |
0.0334 (1.00) |
0.737 (1.00) |
0.276 (1.00) |
0.353 (1.00) |
0.714 (1.00) |
1 (1.00) |
| 15q gain | 7 (1%) | 533 |
0.289 (1.00) |
0.535 (1.00) |
0.708 (1.00) |
0.626 (1.00) |
0.685 (1.00) |
0.712 (1.00) |
| 16p gain | 18 (3%) | 522 |
0.126 (1.00) |
0.0436 (1.00) |
0.464 (1.00) |
0.716 (1.00) |
0.203 (1.00) |
1 (1.00) |
| 16q gain | 17 (3%) | 523 |
0.0362 (1.00) |
0.0294 (1.00) |
0.131 (1.00) |
0.781 (1.00) |
0.291 (1.00) |
1 (1.00) |
| 17p gain | 13 (2%) | 527 |
0.58 (1.00) |
0.00347 (1.00) |
0.261 (1.00) |
0.0254 (1.00) |
1 (1.00) |
0.78 (1.00) |
| 17q gain | 24 (4%) | 516 |
0.885 (1.00) |
0.508 (1.00) |
0.394 (1.00) |
0.00384 (1.00) |
0.271 (1.00) |
0.678 (1.00) |
| 18p gain | 27 (5%) | 513 |
0.806 (1.00) |
0.798 (1.00) |
0.842 (1.00) |
0.2 (1.00) |
0.835 (1.00) |
1 (1.00) |
| 18q gain | 29 (5%) | 511 |
0.547 (1.00) |
0.93 (1.00) |
0.848 (1.00) |
0.477 (1.00) |
0.687 (1.00) |
1 (1.00) |
| 19p gain | 171 (32%) | 369 |
0.158 (1.00) |
0.374 (1.00) |
0.777 (1.00) |
0.862 (1.00) |
0.233 (1.00) |
0.853 (1.00) |
| 19q gain | 150 (28%) | 390 |
0.251 (1.00) |
0.243 (1.00) |
1 (1.00) |
0.887 (1.00) |
0.354 (1.00) |
0.923 (1.00) |
| 21q gain | 29 (5%) | 511 |
0.144 (1.00) |
0.762 (1.00) |
0.697 (1.00) |
0.495 (1.00) |
0.222 (1.00) |
1 (1.00) |
| 22q gain | 11 (2%) | 529 |
0.871 (1.00) |
0.79 (1.00) |
1 (1.00) |
0.225 (1.00) |
0.516 (1.00) |
0.763 (1.00) |
| 1p loss | 7 (1%) | 533 |
0.036 (1.00) |
0.77 (1.00) |
0.708 (1.00) |
0.678 (1.00) |
0.44 (1.00) |
1 (1.00) |
| 1q loss | 4 (1%) | 536 |
0.947 (1.00) |
0.177 (1.00) |
1 (1.00) |
0.29 (1.00) |
1 (1.00) |
0.626 (1.00) |
| 2p loss | 10 (2%) | 530 |
0.236 (1.00) |
0.534 (1.00) |
0.207 (1.00) |
0.383 (1.00) |
0.733 (1.00) |
0.755 (1.00) |
| 2q loss | 9 (2%) | 531 |
0.139 (1.00) |
0.407 (1.00) |
0.166 (1.00) |
0.754 (1.00) |
1 (1.00) |
1 (1.00) |
| 3p loss | 31 (6%) | 509 |
0.152 (1.00) |
0.0698 (1.00) |
0.851 (1.00) |
0.571 (1.00) |
0.164 (1.00) |
0.0156 (1.00) |
| 3q loss | 25 (5%) | 515 |
0.843 (1.00) |
0.0959 (1.00) |
0.68 (1.00) |
0.559 (1.00) |
0.827 (1.00) |
0.541 (1.00) |
| 4p loss | 30 (6%) | 510 |
0.115 (1.00) |
0.143 (1.00) |
0.338 (1.00) |
0.761 (1.00) |
0.42 (1.00) |
0.71 (1.00) |
| 4q loss | 25 (5%) | 515 |
0.0533 (1.00) |
0.0657 (1.00) |
0.835 (1.00) |
0.0524 (1.00) |
0.511 (1.00) |
0.307 (1.00) |
| 5p loss | 20 (4%) | 520 |
0.0532 (1.00) |
0.214 (1.00) |
0.647 (1.00) |
0.46 (1.00) |
0.331 (1.00) |
0.823 (1.00) |
| 5q loss | 18 (3%) | 522 |
0.0635 (1.00) |
0.327 (1.00) |
0.22 (1.00) |
0.133 (1.00) |
0.203 (1.00) |
1 (1.00) |
| 6p loss | 54 (10%) | 486 |
0.0185 (1.00) |
0.593 (1.00) |
0.309 (1.00) |
0.955 (1.00) |
1 (1.00) |
0.774 (1.00) |
| 6q loss | 92 (17%) | 448 |
0.145 (1.00) |
0.446 (1.00) |
0.35 (1.00) |
0.904 (1.00) |
1 (1.00) |
1 (1.00) |
| 7p loss | 4 (1%) | 536 |
0.563 (1.00) |
0.758 (1.00) |
0.652 (1.00) |
1 (1.00) |
1 (1.00) |
|
| 7q loss | 4 (1%) | 536 |
0.355 (1.00) |
0.266 (1.00) |
1 (1.00) |
1 (1.00) |
1 (1.00) |
|
| 8p loss | 36 (7%) | 504 |
0.855 (1.00) |
0.375 (1.00) |
0.219 (1.00) |
0.947 (1.00) |
0.137 (1.00) |
0.388 (1.00) |
| 8q loss | 22 (4%) | 518 |
0.221 (1.00) |
0.965 (1.00) |
0.376 (1.00) |
0.649 (1.00) |
0.0186 (1.00) |
0.384 (1.00) |
| 9p loss | 207 (38%) | 333 |
0.568 (1.00) |
0.97 (1.00) |
0.417 (1.00) |
0.286 (1.00) |
0.776 (1.00) |
0.723 (1.00) |
| 9q loss | 76 (14%) | 464 |
0.789 (1.00) |
0.955 (1.00) |
0.101 (1.00) |
0.209 (1.00) |
0.792 (1.00) |
1 (1.00) |
| 11p loss | 62 (11%) | 478 |
0.351 (1.00) |
0.357 (1.00) |
0.0977 (1.00) |
0.702 (1.00) |
0.147 (1.00) |
0.686 (1.00) |
| 11q loss | 51 (9%) | 489 |
0.657 (1.00) |
0.691 (1.00) |
0.454 (1.00) |
0.652 (1.00) |
0.0398 (1.00) |
0.184 (1.00) |
| 12p loss | 49 (9%) | 491 |
0.482 (1.00) |
0.92 (1.00) |
0.649 (1.00) |
0.963 (1.00) |
0.265 (1.00) |
0.233 (1.00) |
| 12q loss | 45 (8%) | 495 |
0.506 (1.00) |
0.837 (1.00) |
0.752 (1.00) |
0.865 (1.00) |
0.868 (1.00) |
0.877 (1.00) |
| 13q loss | 150 (28%) | 390 |
0.878 (1.00) |
0.456 (1.00) |
0.17 (1.00) |
0.519 (1.00) |
0.918 (1.00) |
0.773 (1.00) |
| 14q loss | 135 (25%) | 405 |
0.786 (1.00) |
0.167 (1.00) |
0.417 (1.00) |
0.904 (1.00) |
0.749 (1.00) |
0.371 (1.00) |
| 15q loss | 63 (12%) | 477 |
0.656 (1.00) |
0.597 (1.00) |
0.338 (1.00) |
0.554 (1.00) |
0.568 (1.00) |
0.688 (1.00) |
| 16p loss | 31 (6%) | 509 |
0.0334 (1.00) |
0.539 (1.00) |
0.573 (1.00) |
0.414 (1.00) |
0.844 (1.00) |
0.198 (1.00) |
| 16q loss | 45 (8%) | 495 |
0.0804 (1.00) |
0.424 (1.00) |
1 (1.00) |
0.188 (1.00) |
0.868 (1.00) |
0.351 (1.00) |
| 17p loss | 35 (6%) | 505 |
0.607 (1.00) |
0.363 (1.00) |
0.156 (1.00) |
0.844 (1.00) |
1 (1.00) |
0.227 (1.00) |
| 17q loss | 14 (3%) | 526 |
0.22 (1.00) |
0.844 (1.00) |
0.268 (1.00) |
0.478 (1.00) |
1 (1.00) |
0.0595 (1.00) |
| 18p loss | 46 (9%) | 494 |
0.566 (1.00) |
0.72 (1.00) |
0.433 (1.00) |
0.191 (1.00) |
0.624 (1.00) |
0.645 (1.00) |
| 18q loss | 40 (7%) | 500 |
0.785 (1.00) |
0.83 (1.00) |
0.317 (1.00) |
0.0745 (1.00) |
0.481 (1.00) |
0.744 (1.00) |
| 19p loss | 14 (3%) | 526 |
0.596 (1.00) |
0.215 (1.00) |
0.424 (1.00) |
0.889 (1.00) |
0.775 (1.00) |
0.59 (1.00) |
| 19q loss | 28 (5%) | 512 |
0.271 (1.00) |
0.976 (1.00) |
0.697 (1.00) |
0.924 (1.00) |
0.836 (1.00) |
1 (1.00) |
| 20p loss | 10 (2%) | 530 |
0.429 (1.00) |
0.218 (1.00) |
0.207 (1.00) |
0.225 (1.00) |
1 (1.00) |
1 (1.00) |
| 20q loss | 9 (2%) | 531 |
0.446 (1.00) |
0.714 (1.00) |
0.494 (1.00) |
0.158 (1.00) |
0.476 (1.00) |
1 (1.00) |
| 21q loss | 27 (5%) | 513 |
0.959 (1.00) |
0.34 (1.00) |
0.227 (1.00) |
0.382 (1.00) |
1 (1.00) |
0.694 (1.00) |
| 22q loss | 142 (26%) | 398 |
0.524 (1.00) |
0.0121 (1.00) |
0.921 (1.00) |
0.569 (1.00) |
0.753 (1.00) |
0.559 (1.00) |
P value = 0.00032 (t-test), Q value = 0.15
Table S1. Gene #11: '6p gain mutation analysis' versus Clinical Feature #4: 'KARNOFSKY.PERFORMANCE.SCORE'
| nPatients | Mean (Std.Dev) | |
|---|---|---|
| ALL | 406 | 77.3 (14.8) |
| 6P GAIN MUTATED | 5 | 80.0 (0.0) |
| 6P GAIN WILD-TYPE | 401 | 77.3 (14.9) |
Figure S1. Get High-res Image Gene #11: '6p gain mutation analysis' versus Clinical Feature #4: 'KARNOFSKY.PERFORMANCE.SCORE'
P value = 1.9e-06 (t-test), Q value = 0.00087
Table S2. Gene #13: '7p gain mutation analysis' versus Clinical Feature #2: 'AGE'
| nPatients | Mean (Std.Dev) | |
|---|---|---|
| ALL | 540 | 57.8 (14.3) |
| 7P GAIN MUTATED | 421 | 59.7 (12.4) |
| 7P GAIN WILD-TYPE | 119 | 50.9 (18.2) |
Figure S2. Get High-res Image Gene #13: '7p gain mutation analysis' versus Clinical Feature #2: 'AGE'
P value = 4.35e-05 (t-test), Q value = 0.02
Table S3. Gene #14: '7q gain mutation analysis' versus Clinical Feature #2: 'AGE'
| nPatients | Mean (Std.Dev) | |
|---|---|---|
| ALL | 540 | 57.8 (14.3) |
| 7Q GAIN MUTATED | 426 | 59.4 (12.4) |
| 7Q GAIN WILD-TYPE | 114 | 51.6 (18.7) |
Figure S3. Get High-res Image Gene #14: '7q gain mutation analysis' versus Clinical Feature #2: 'AGE'
P value = 0.00032 (t-test), Q value = 0.15
Table S4. Gene #19: '10p gain mutation analysis' versus Clinical Feature #4: 'KARNOFSKY.PERFORMANCE.SCORE'
| nPatients | Mean (Std.Dev) | |
|---|---|---|
| ALL | 406 | 77.3 (14.8) |
| 10P GAIN MUTATED | 8 | 80.0 (0.0) |
| 10P GAIN WILD-TYPE | 398 | 77.3 (14.9) |
Figure S4. Get High-res Image Gene #19: '10p gain mutation analysis' versus Clinical Feature #4: 'KARNOFSKY.PERFORMANCE.SCORE'
P value = 0.000227 (t-test), Q value = 0.1
Table S5. Gene #35: '20p gain mutation analysis' versus Clinical Feature #2: 'AGE'
| nPatients | Mean (Std.Dev) | |
|---|---|---|
| ALL | 540 | 57.8 (14.3) |
| 20P GAIN MUTATED | 165 | 61.0 (12.4) |
| 20P GAIN WILD-TYPE | 375 | 56.4 (14.9) |
Figure S5. Get High-res Image Gene #35: '20p gain mutation analysis' versus Clinical Feature #2: 'AGE'
P value = 0.000475 (t-test), Q value = 0.21
Table S6. Gene #36: '20q gain mutation analysis' versus Clinical Feature #2: 'AGE'
| nPatients | Mean (Std.Dev) | |
|---|---|---|
| ALL | 540 | 57.8 (14.3) |
| 20Q GAIN MUTATED | 163 | 60.9 (12.7) |
| 20Q GAIN WILD-TYPE | 377 | 56.4 (14.8) |
Figure S6. Get High-res Image Gene #36: '20q gain mutation analysis' versus Clinical Feature #2: 'AGE'
P value = 0.000194 (logrank test), Q value = 0.088
Table S7. Gene #57: '10p loss mutation analysis' versus Clinical Feature #1: 'Time to Death'
| nPatients | nDeath | Duration Range (Median), Month | |
|---|---|---|---|
| ALL | 540 | 407 | 0.1 - 127.6 (9.6) |
| 10P LOSS MUTATED | 432 | 326 | 0.1 - 127.6 (9.3) |
| 10P LOSS WILD-TYPE | 108 | 81 | 0.2 - 108.8 (10.7) |
Figure S7. Get High-res Image Gene #57: '10p loss mutation analysis' versus Clinical Feature #1: 'Time to Death'
P value = 9.57e-09 (t-test), Q value = 4.4e-06
Table S8. Gene #57: '10p loss mutation analysis' versus Clinical Feature #2: 'AGE'
| nPatients | Mean (Std.Dev) | |
|---|---|---|
| ALL | 540 | 57.8 (14.3) |
| 10P LOSS MUTATED | 432 | 60.0 (12.1) |
| 10P LOSS WILD-TYPE | 108 | 48.7 (18.3) |
Figure S8. Get High-res Image Gene #57: '10p loss mutation analysis' versus Clinical Feature #2: 'AGE'

P value = 6.89e-08 (t-test), Q value = 3.2e-05
Table S9. Gene #58: '10q loss mutation analysis' versus Clinical Feature #2: 'AGE'
| nPatients | Mean (Std.Dev) | |
|---|---|---|
| ALL | 540 | 57.8 (14.3) |
| 10Q LOSS MUTATED | 445 | 59.7 (12.6) |
| 10Q LOSS WILD-TYPE | 95 | 48.5 (18.0) |
Figure S9. Get High-res Image Gene #58: '10q loss mutation analysis' versus Clinical Feature #2: 'AGE'

-
Mutation data file = broad_values_by_arm.mutsig.cluster.txt
-
Clinical data file = GBM.clin.merged.picked.txt
-
Number of patients = 540
-
Number of significantly arm-level cnvs = 77
-
Number of selected clinical features = 6
-
Exclude genes that fewer than K tumors have mutations, K = 3
For survival clinical features, the Kaplan-Meier survival curves of tumors with and without gene mutations were plotted and the statistical significance P values were estimated by logrank test (Bland and Altman 2004) using the 'survdiff' function in R
For continuous numerical clinical features, two-tailed Student's t test with unequal variance (Lehmann and Romano 2005) was applied to compare the clinical values between tumors with and without gene mutations using 't.test' function in R
For binary or multi-class clinical features (nominal or ordinal), two-tailed Fisher's exact tests (Fisher 1922) were used to estimate the P values using the 'fisher.test' function in R
For multiple hypothesis correction, Q value is the False Discovery Rate (FDR) analogue of the P value (Benjamini and Hochberg 1995), defined as the minimum FDR at which the test may be called significant. We used the 'Benjamini and Hochberg' method of 'p.adjust' function in R to convert P values into Q values.
This is an experimental feature. The full results of the analysis summarized in this report can be downloaded from the TCGA Data Coordination Center.