This pipeline uses various statistical tests to identify mRNAs whose expression levels correlated to selected clinical features.
Testing the association between 12042 genes and 6 clinical features across 519 samples, statistically thresholded by Q value < 0.05, 5 clinical features related to at least one genes.
-
21 genes correlated to 'Time to Death'.
-
CLEC5A , EFEMP2 , NCOA4 , ATP5C1 , DIRAS3 , ...
-
76 genes correlated to 'AGE'.
-
RANBP17 , FBXO17 , TUSC3 , KIAA0495 , NOL3 , ...
-
23 genes correlated to 'GENDER'.
-
DDX3Y , RPS4Y1 , EIF1AY , JARID1D , NLGN4Y , ...
-
1 gene correlated to 'RADIATIONS.RADIATION.REGIMENINDICATION'.
-
NPAT
-
8 genes correlated to 'NEOADJUVANT.THERAPY'.
-
WDR57 , SSNA1 , SMU1 , DNAJA2 , IDH3A , ...
-
No genes correlated to 'KARNOFSKY.PERFORMANCE.SCORE'
Complete statistical result table is provided in Supplement Table 1
Table 1. Get Full Table This table shows the clinical features, statistical methods used, and the number of genes that are significantly associated with each clinical feature at Q value < 0.05.
| Clinical feature | Statistical test | Significant genes | Associated with | Associated with | ||
|---|---|---|---|---|---|---|
| Time to Death | Cox regression test | N=21 | shorter survival | N=11 | longer survival | N=10 |
| AGE | Spearman correlation test | N=76 | older | N=42 | younger | N=34 |
| GENDER | t test | N=23 | male | N=11 | female | N=12 |
| KARNOFSKY PERFORMANCE SCORE | Spearman correlation test | N=0 | ||||
| RADIATIONS RADIATION REGIMENINDICATION | t test | N=1 | yes | N=0 | no | N=1 |
| NEOADJUVANT THERAPY | t test | N=8 | yes | N=0 | no | N=8 |
Table S1. Basic characteristics of clinical feature: 'Time to Death'
| Time to Death | Duration (Months) | 0.1-127.6 (median=9.9) |
| censored | N = 116 | |
| death | N = 403 | |
| Significant markers | N = 21 | |
| associated with shorter survival | 11 | |
| associated with longer survival | 10 |
Table S2. Get Full Table List of top 10 genes significantly associated with 'Time to Death' by Cox regression test
| HazardRatio | Wald_P | Q | C_index | |
|---|---|---|---|---|
| CLEC5A | 1.23 | 7.107e-08 | 0.00086 | 0.584 |
| EFEMP2 | 1.3 | 7.708e-08 | 0.00093 | 0.542 |
| NCOA4 | 0.56 | 8.196e-08 | 0.00099 | 0.442 |
| ATP5C1 | 0.59 | 8.228e-08 | 0.00099 | 0.451 |
| DIRAS3 | 1.22 | 1.111e-07 | 0.0013 | 0.558 |
| RANBP17 | 0.46 | 1.833e-07 | 0.0022 | 0.427 |
| ANKRD26 | 0.39 | 2.458e-07 | 0.003 | 0.446 |
| HIST3H2A | 0.82 | 3.552e-07 | 0.0043 | 0.427 |
| ZIC3 | 0.48 | 6.625e-07 | 0.008 | 0.444 |
| FZD7 | 1.23 | 1.054e-06 | 0.013 | 0.556 |
Figure S1. Get High-res Image As an example, this figure shows the association of CLEC5A to 'Time to Death'. four curves present the cumulative survival rates of 4 quartile subsets of patients. P value = 7.11e-08 with univariate Cox regression analysis using continuous log-2 expression values.
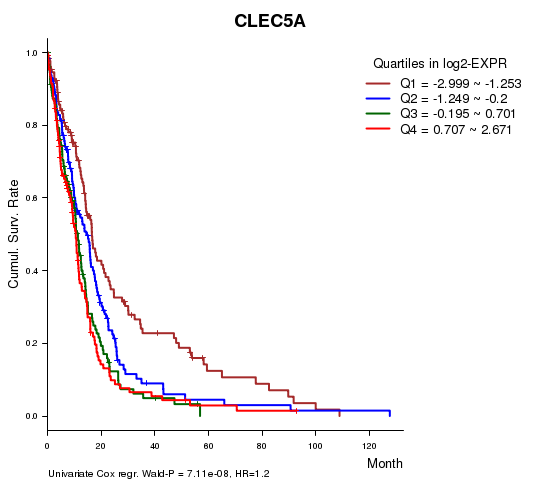
Table S3. Basic characteristics of clinical feature: 'AGE'
| AGE | Mean (SD) | 57.68 (14) |
| Significant markers | N = 76 | |
| pos. correlated | 42 | |
| neg. correlated | 34 |
Table S4. Get Full Table List of top 10 genes significantly correlated to 'AGE' by Spearman correlation test
| SpearmanCorr | corrP | Q | |
|---|---|---|---|
| RANBP17 | -0.316 | 1.677e-13 | 2.02e-09 |
| FBXO17 | 0.3024 | 1.966e-12 | 2.37e-08 |
| TUSC3 | -0.2972 | 4.787e-12 | 5.76e-08 |
| KIAA0495 | 0.279 | 9.796e-11 | 1.18e-06 |
| NOL3 | 0.2745 | 2.002e-10 | 2.41e-06 |
| PPA1 | -0.2725 | 2.734e-10 | 3.29e-06 |
| H2AFY2 | -0.2638 | 1.037e-09 | 1.25e-05 |
| DRG2 | 0.2628 | 1.203e-09 | 1.45e-05 |
| NCOA4 | -0.2621 | 1.343e-09 | 1.62e-05 |
| ENOSF1 | -0.2585 | 2.273e-09 | 2.73e-05 |
Figure S2. Get High-res Image As an example, this figure shows the association of RANBP17 to 'AGE'. P value = 1.68e-13 with Spearman correlation analysis. The straight line presents the best linear regression.
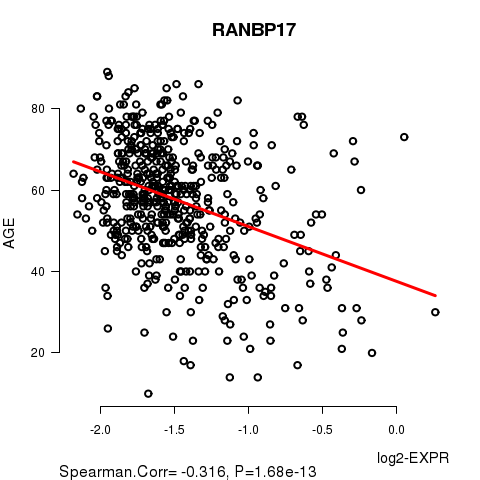
Table S5. Basic characteristics of clinical feature: 'GENDER'
| GENDER | Labels | N |
| FEMALE | 205 | |
| MALE | 314 | |
| Significant markers | N = 23 | |
| Higher in MALE | 11 | |
| Higher in FEMALE | 12 |
Table S6. Get Full Table List of top 10 genes differentially expressed by 'GENDER'
| T(pos if higher in 'MALE') | ttestP | Q | AUC | |
|---|---|---|---|---|
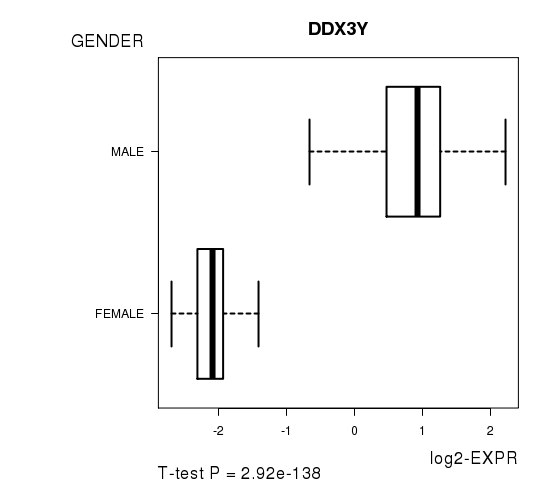
| DDX3Y | 36.83 | 2.924e-138 | 3.52e-134 | 0.9584 |
| RPS4Y1 | 39.2 | 2.833e-135 | 3.41e-131 | 0.9492 |
| EIF1AY | 34.4 | 1.476e-131 | 1.78e-127 | 0.9528 |
| JARID1D | 33.72 | 3.527e-131 | 4.25e-127 | 0.9563 |
| NLGN4Y | 30.21 | 1.062e-114 | 1.28e-110 | 0.9458 |
| USP9Y | 21.03 | 3.406e-71 | 4.1e-67 | 0.9156 |
| CYORF15B | 19.1 | 6.738e-62 | 8.11e-58 | 0.9006 |
| UTY | 19.44 | 8.975e-59 | 1.08e-54 | 0.8959 |
| ZFX | -12.4 | 1.482e-29 | 1.78e-25 | 0.8181 |
| HDHD1A | -12.31 | 2.604e-29 | 3.13e-25 | 0.802 |
Figure S3. Get High-res Image As an example, this figure shows the association of DDX3Y to 'GENDER'. P value = 2.92e-138 with T-test analysis.
No gene related to 'KARNOFSKY.PERFORMANCE.SCORE'.
Table S7. Basic characteristics of clinical feature: 'KARNOFSKY.PERFORMANCE.SCORE'
| KARNOFSKY.PERFORMANCE.SCORE | Mean (SD) | 77.12 (14) |
| Significant markers | N = 0 |
One gene related to 'RADIATIONS.RADIATION.REGIMENINDICATION'.
Table S8. Basic characteristics of clinical feature: 'RADIATIONS.RADIATION.REGIMENINDICATION'
| RADIATIONS.RADIATION.REGIMENINDICATION | Labels | N |
| NO | 350 | |
| YES | 169 | |
| Significant markers | N = 1 | |
| Higher in YES | 0 | |
| Higher in NO | 1 |
Table S9. Get Full Table List of one gene differentially expressed by 'RADIATIONS.RADIATION.REGIMENINDICATION'
| T(pos if higher in 'YES') | ttestP | Q | AUC | |
|---|---|---|---|---|
| NPAT | -5.31 | 1.811e-07 | 0.00218 | 0.6241 |
Figure S4. Get High-res Image As an example, this figure shows the association of NPAT to 'RADIATIONS.RADIATION.REGIMENINDICATION'. P value = 1.81e-07 with T-test analysis.
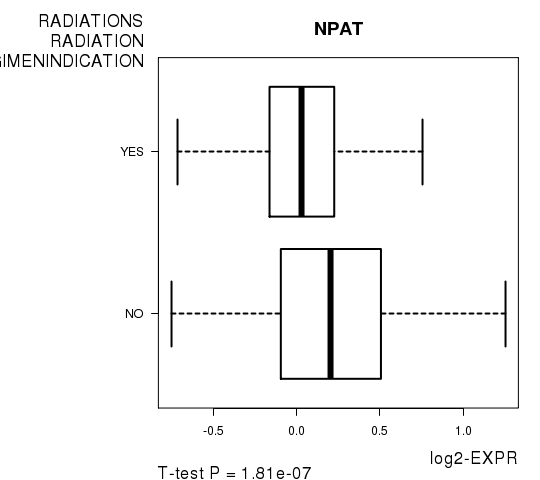
Table S10. Basic characteristics of clinical feature: 'NEOADJUVANT.THERAPY'
| NEOADJUVANT.THERAPY | Labels | N |
| NO | 273 | |
| YES | 246 | |
| Significant markers | N = 8 | |
| Higher in YES | 0 | |
| Higher in NO | 8 |
Table S11. Get Full Table List of 8 genes differentially expressed by 'NEOADJUVANT.THERAPY'
| T(pos if higher in 'YES') | ttestP | Q | AUC | |
|---|---|---|---|---|
| WDR57 | -5.78 | 1.322e-08 | 0.000159 | 0.6419 |
| SSNA1 | -5.33 | 1.434e-07 | 0.00173 | 0.6399 |
| SMU1 | -5.32 | 1.525e-07 | 0.00184 | 0.6245 |
| DNAJA2 | -5.05 | 6.073e-07 | 0.00731 | 0.6297 |
| IDH3A | -4.97 | 9.321e-07 | 0.0112 | 0.6245 |
| PDCL | -4.88 | 1.425e-06 | 0.0172 | 0.6275 |
| NUTF2 | -4.82 | 1.884e-06 | 0.0227 | 0.6112 |
| RPN1 | -4.65 | 4.157e-06 | 0.05 | 0.6192 |
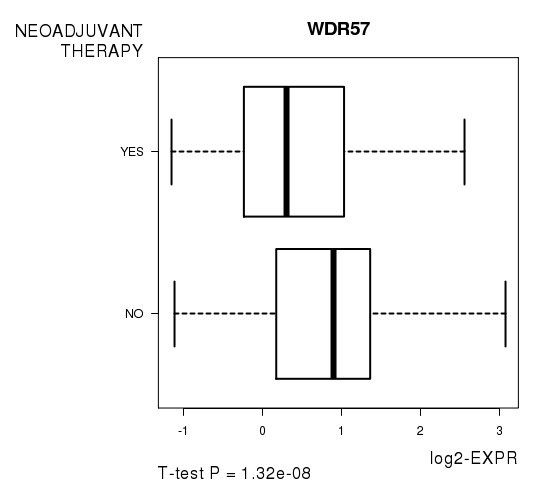
Figure S5. Get High-res Image As an example, this figure shows the association of WDR57 to 'NEOADJUVANT.THERAPY'. P value = 1.32e-08 with T-test analysis.
-
Expresson data file = GBM.medianexp.txt
-
Clinical data file = GBM.clin.merged.picked.txt
-
Number of patients = 519
-
Number of genes = 12042
-
Number of clinical features = 6
For survival clinical features, Wald's test in univariate Cox regression analysis with proportional hazards model (Andersen and Gill 1982) was used to estimate the P values using the 'coxph' function in R. Kaplan-Meier survival curves were plot using the four quartile subgroups of patients based on expression levels
For continuous numerical clinical features, Spearman's rank correlation coefficients (Spearman 1904) and two-tailed P values were estimated using 'cor.test' function in R
For two-class clinical features, two-tailed Student's t test with unequal variance (Lehmann and Romano 2005) was applied to compare the log2-expression levels between the two clinical classes using 't.test' function in R
For multiple hypothesis correction, Q value is the False Discovery Rate (FDR) analogue of the P value (Benjamini and Hochberg 1995), defined as the minimum FDR at which the test may be called significant. We used the 'Benjamini and Hochberg' method of 'p.adjust' function in R to convert P values into Q values.
This is an experimental feature. The full results of the analysis summarized in this report can be downloaded from the TCGA Data Coordination Center.