This pipeline computes the correlation between significant arm-level copy number variations (cnvs) and selected clinical features.
Testing the association between copy number variation 78 arm-level results and 8 clinical features across 286 patients, one significant finding detected with Q value < 0.25.
-
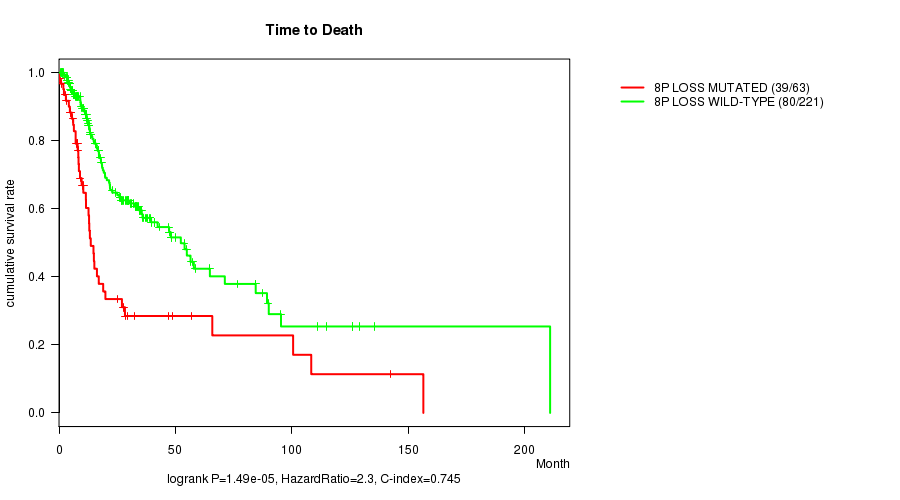
8p loss cnv correlated to 'Time to Death'.
Table 1. Get Full Table Overview of the association between significant copy number variation of 78 arm-level results and 8 clinical features. Shown in the table are P values (Q values). Thresholded by Q value < 0.25, one significant finding detected.
|
Clinical Features |
Time to Death |
AGE | GENDER |
PATHOLOGY T |
PATHOLOGY N |
PATHOLOGICSPREAD(M) |
RADIATIONS RADIATION REGIMENINDICATION |
NEOADJUVANT THERAPY |
||
| nCNV (%) | nWild-Type | logrank test | t-test | Fisher's exact test | Fisher's exact test | Fisher's exact test | Fisher's exact test | Fisher's exact test | Fisher's exact test | |
| 8p loss | 63 (22%) | 223 |
1.49e-05 (0.00928) |
0.218 (1.00) |
1 (1.00) |
0.363 (1.00) |
0.564 (1.00) |
0.12 (1.00) |
0.422 (1.00) |
1 (1.00) |
| 1p gain | 15 (5%) | 271 |
0.33 (1.00) |
0.252 (1.00) |
0.376 (1.00) |
0.901 (1.00) |
0.00175 (1.00) |
0.15 (1.00) |
1 (1.00) |
0.72 (1.00) |
| 1q gain | 40 (14%) | 246 |
0.969 (1.00) |
0.54 (1.00) |
1 (1.00) |
0.296 (1.00) |
0.166 (1.00) |
0.0526 (1.00) |
0.121 (1.00) |
0.495 (1.00) |
| 2p gain | 25 (9%) | 261 |
0.296 (1.00) |
0.715 (1.00) |
0.172 (1.00) |
0.215 (1.00) |
0.736 (1.00) |
1 (1.00) |
0.817 (1.00) |
0.577 (1.00) |
| 2q gain | 16 (6%) | 270 |
0.15 (1.00) |
0.156 (1.00) |
0.251 (1.00) |
0.56 (1.00) |
1 (1.00) |
1 (1.00) |
0.381 (1.00) |
0.733 (1.00) |
| 3p gain | 31 (11%) | 255 |
0.195 (1.00) |
0.893 (1.00) |
0.531 (1.00) |
0.519 (1.00) |
0.229 (1.00) |
0.293 (1.00) |
0.281 (1.00) |
0.0679 (1.00) |
| 3q gain | 117 (41%) | 169 |
0.118 (1.00) |
0.483 (1.00) |
0.00758 (1.00) |
0.772 (1.00) |
0.416 (1.00) |
1 (1.00) |
0.134 (1.00) |
0.257 (1.00) |
| 4p gain | 13 (5%) | 273 |
0.644 (1.00) |
0.321 (1.00) |
0.764 (1.00) |
0.974 (1.00) |
0.351 (1.00) |
1 (1.00) |
0.751 (1.00) |
0.454 (1.00) |
| 4q gain | 7 (2%) | 279 |
0.958 (1.00) |
0.286 (1.00) |
1 (1.00) |
0.448 (1.00) |
0.799 (1.00) |
1 (1.00) |
0.195 (1.00) |
0.604 (1.00) |
| 5p gain | 86 (30%) | 200 |
0.788 (1.00) |
0.102 (1.00) |
0.253 (1.00) |
0.5 (1.00) |
0.335 (1.00) |
1 (1.00) |
0.561 (1.00) |
0.862 (1.00) |
| 5q gain | 23 (8%) | 263 |
0.102 (1.00) |
0.26 (1.00) |
0.145 (1.00) |
0.639 (1.00) |
0.426 (1.00) |
1 (1.00) |
0.216 (1.00) |
0.236 (1.00) |
| 6p gain | 23 (8%) | 263 |
0.371 (1.00) |
0.153 (1.00) |
1 (1.00) |
0.601 (1.00) |
0.176 (1.00) |
1 (1.00) |
0.146 (1.00) |
0.142 (1.00) |
| 6q gain | 13 (5%) | 273 |
0.539 (1.00) |
0.479 (1.00) |
0.204 (1.00) |
0.35 (1.00) |
0.00899 (1.00) |
1 (1.00) |
1 (1.00) |
0.701 (1.00) |
| 7p gain | 59 (21%) | 227 |
0.586 (1.00) |
0.202 (1.00) |
0.259 (1.00) |
0.634 (1.00) |
0.743 (1.00) |
1 (1.00) |
0.321 (1.00) |
0.693 (1.00) |
| 7q gain | 39 (14%) | 247 |
0.367 (1.00) |
0.319 (1.00) |
0.339 (1.00) |
0.596 (1.00) |
0.748 (1.00) |
1 (1.00) |
0.56 (1.00) |
0.816 (1.00) |
| 8p gain | 55 (19%) | 231 |
0.0249 (1.00) |
0.789 (1.00) |
1 (1.00) |
0.11 (1.00) |
0.564 (1.00) |
0.476 (1.00) |
0.402 (1.00) |
1 (1.00) |
| 8q gain | 124 (43%) | 162 |
0.461 (1.00) |
0.135 (1.00) |
0.792 (1.00) |
0.576 (1.00) |
0.0416 (1.00) |
1 (1.00) |
0.686 (1.00) |
0.424 (1.00) |
| 9p gain | 45 (16%) | 241 |
0.961 (1.00) |
0.00317 (1.00) |
0.149 (1.00) |
0.944 (1.00) |
0.0478 (1.00) |
1 (1.00) |
0.582 (1.00) |
0.664 (1.00) |
| 9q gain | 52 (18%) | 234 |
0.136 (1.00) |
0.0776 (1.00) |
0.496 (1.00) |
0.104 (1.00) |
0.579 (1.00) |
1 (1.00) |
1 (1.00) |
0.838 (1.00) |
| 10p gain | 13 (5%) | 273 |
0.946 (1.00) |
0.631 (1.00) |
0.363 (1.00) |
0.381 (1.00) |
0.198 (1.00) |
1 (1.00) |
0.751 (1.00) |
1 (1.00) |
| 10q gain | 5 (2%) | 281 |
0.214 (1.00) |
0.813 (1.00) |
1 (1.00) |
0.246 (1.00) |
0.858 (1.00) |
1 (1.00) |
0.611 (1.00) |
1 (1.00) |
| 11p gain | 17 (6%) | 269 |
0.203 (1.00) |
0.26 (1.00) |
0.786 (1.00) |
0.0543 (1.00) |
0.504 (1.00) |
1 (1.00) |
1 (1.00) |
0.323 (1.00) |
| 11q gain | 20 (7%) | 266 |
0.448 (1.00) |
0.0931 (1.00) |
1 (1.00) |
0.742 (1.00) |
0.468 (1.00) |
1 (1.00) |
1 (1.00) |
0.216 (1.00) |
| 12p gain | 61 (21%) | 225 |
0.173 (1.00) |
0.291 (1.00) |
0.109 (1.00) |
0.969 (1.00) |
0.87 (1.00) |
0.516 (1.00) |
0.193 (1.00) |
0.33 (1.00) |
| 12q gain | 27 (9%) | 259 |
0.717 (1.00) |
0.847 (1.00) |
0.27 (1.00) |
0.54 (1.00) |
0.764 (1.00) |
0.259 (1.00) |
1 (1.00) |
1 (1.00) |
| 13q gain | 19 (7%) | 267 |
0.545 (1.00) |
0.127 (1.00) |
1 (1.00) |
0.607 (1.00) |
0.421 (1.00) |
1 (1.00) |
0.597 (1.00) |
0.529 (1.00) |
| 14q gain | 46 (16%) | 240 |
0.933 (1.00) |
0.916 (1.00) |
0.158 (1.00) |
0.713 (1.00) |
0.723 (1.00) |
1 (1.00) |
0.278 (1.00) |
0.384 (1.00) |
| 15q gain | 11 (4%) | 275 |
0.929 (1.00) |
0.976 (1.00) |
0.513 (1.00) |
0.13 (1.00) |
1 (1.00) |
1 (1.00) |
0.298 (1.00) |
1 (1.00) |
| 16p gain | 16 (6%) | 270 |
0.659 (1.00) |
0.00972 (1.00) |
0.779 (1.00) |
0.765 (1.00) |
0.174 (1.00) |
1 (1.00) |
0.572 (1.00) |
1 (1.00) |
| 16q gain | 20 (7%) | 266 |
0.705 (1.00) |
0.32 (1.00) |
0.803 (1.00) |
0.337 (1.00) |
0.311 (1.00) |
1 (1.00) |
1 (1.00) |
1 (1.00) |
| 17p gain | 18 (6%) | 268 |
0.641 (1.00) |
0.82 (1.00) |
0.11 (1.00) |
0.609 (1.00) |
0.747 (1.00) |
1 (1.00) |
0.582 (1.00) |
0.747 (1.00) |
| 17q gain | 23 (8%) | 263 |
0.932 (1.00) |
0.549 (1.00) |
0.334 (1.00) |
0.197 (1.00) |
0.905 (1.00) |
1 (1.00) |
0.806 (1.00) |
0.142 (1.00) |
| 18p gain | 46 (16%) | 240 |
0.142 (1.00) |
0.558 (1.00) |
0.00384 (1.00) |
0.00275 (1.00) |
0.7 (1.00) |
1 (1.00) |
0.146 (1.00) |
0.0154 (1.00) |
| 18q gain | 17 (6%) | 269 |
0.0676 (1.00) |
0.448 (1.00) |
0.166 (1.00) |
0.208 (1.00) |
0.832 (1.00) |
1 (1.00) |
0.78 (1.00) |
0.323 (1.00) |
| 19p gain | 12 (4%) | 274 |
0.0441 (1.00) |
0.204 (1.00) |
0.746 (1.00) |
0.606 (1.00) |
0.588 (1.00) |
1 (1.00) |
0.526 (1.00) |
1 (1.00) |
| 19q gain | 17 (6%) | 269 |
0.113 (1.00) |
0.564 (1.00) |
1 (1.00) |
0.551 (1.00) |
0.477 (1.00) |
1 (1.00) |
0.78 (1.00) |
1 (1.00) |
| 20p gain | 56 (20%) | 230 |
0.0763 (1.00) |
0.261 (1.00) |
0.869 (1.00) |
0.323 (1.00) |
0.0666 (1.00) |
1 (1.00) |
0.0441 (1.00) |
0.00908 (1.00) |
| 20q gain | 58 (20%) | 228 |
0.132 (1.00) |
0.0179 (1.00) |
0.328 (1.00) |
0.315 (1.00) |
0.527 (1.00) |
1 (1.00) |
0.0317 (1.00) |
0.11 (1.00) |
| 21q gain | 9 (3%) | 277 |
0.846 (1.00) |
0.0627 (1.00) |
1 (1.00) |
0.949 (1.00) |
0.906 (1.00) |
1 (1.00) |
1 (1.00) |
1 (1.00) |
| 22q gain | 33 (12%) | 253 |
0.405 (1.00) |
0.238 (1.00) |
0.684 (1.00) |
0.69 (1.00) |
0.406 (1.00) |
1 (1.00) |
0.836 (1.00) |
0.621 (1.00) |
| 1p loss | 24 (8%) | 262 |
0.693 (1.00) |
0.544 (1.00) |
0.816 (1.00) |
0.265 (1.00) |
0.12 (1.00) |
0.233 (1.00) |
0.81 (1.00) |
1 (1.00) |
| 1q loss | 7 (2%) | 279 |
0.19 (1.00) |
0.957 (1.00) |
1 (1.00) |
0.448 (1.00) |
1 (1.00) |
1 (1.00) |
0.679 (1.00) |
1 (1.00) |
| 2p loss | 5 (2%) | 281 |
0.647 (1.00) |
0.554 (1.00) |
1 (1.00) |
0.768 (1.00) |
1 (1.00) |
1 (1.00) |
0.611 (1.00) |
0.191 (1.00) |
| 2q loss | 8 (3%) | 278 |
0.517 (1.00) |
0.439 (1.00) |
0.692 (1.00) |
0.0644 (1.00) |
0.582 (1.00) |
0.0821 (1.00) |
0.686 (1.00) |
0.361 (1.00) |
| 3p loss | 115 (40%) | 171 |
0.00681 (1.00) |
0.0351 (1.00) |
0.00496 (1.00) |
0.046 (1.00) |
0.333 (1.00) |
0.566 (1.00) |
0.685 (1.00) |
0.871 (1.00) |
| 3q loss | 11 (4%) | 275 |
0.058 (1.00) |
0.531 (1.00) |
0.513 (1.00) |
0.211 (1.00) |
0.174 (1.00) |
1 (1.00) |
0.733 (1.00) |
1 (1.00) |
| 4p loss | 67 (23%) | 219 |
0.313 (1.00) |
0.412 (1.00) |
0.163 (1.00) |
0.493 (1.00) |
0.0052 (1.00) |
0.554 (1.00) |
1 (1.00) |
0.455 (1.00) |
| 4q loss | 42 (15%) | 244 |
0.904 (1.00) |
0.656 (1.00) |
0.854 (1.00) |
0.898 (1.00) |
0.143 (1.00) |
1 (1.00) |
0.85 (1.00) |
0.823 (1.00) |
| 5p loss | 12 (4%) | 274 |
0.971 (1.00) |
0.271 (1.00) |
0.746 (1.00) |
0.665 (1.00) |
1 (1.00) |
1 (1.00) |
0.0403 (1.00) |
0.226 (1.00) |
| 5q loss | 63 (22%) | 223 |
0.606 (1.00) |
0.303 (1.00) |
0.154 (1.00) |
0.502 (1.00) |
0.975 (1.00) |
1 (1.00) |
0.873 (1.00) |
0.848 (1.00) |
| 6p loss | 27 (9%) | 259 |
0.381 (1.00) |
0.822 (1.00) |
0.119 (1.00) |
0.0691 (1.00) |
0.667 (1.00) |
1 (1.00) |
0.655 (1.00) |
0.413 (1.00) |
| 6q loss | 28 (10%) | 258 |
0.988 (1.00) |
0.165 (1.00) |
0.12 (1.00) |
0.0373 (1.00) |
0.6 (1.00) |
1 (1.00) |
0.654 (1.00) |
0.591 (1.00) |
| 7p loss | 6 (2%) | 280 |
0.9 (1.00) |
0.97 (1.00) |
1 (1.00) |
0.0516 (1.00) |
0.628 (1.00) |
1 (1.00) |
1 (1.00) |
1 (1.00) |
| 7q loss | 20 (7%) | 266 |
0.269 (1.00) |
0.00907 (1.00) |
0.454 (1.00) |
0.876 (1.00) |
0.165 (1.00) |
1 (1.00) |
0.606 (1.00) |
0.753 (1.00) |
| 8q loss | 10 (3%) | 276 |
0.59 (1.00) |
0.662 (1.00) |
0.153 (1.00) |
0.961 (1.00) |
1 (1.00) |
0.102 (1.00) |
0.465 (1.00) |
0.0633 (1.00) |
| 9p loss | 82 (29%) | 204 |
0.273 (1.00) |
0.181 (1.00) |
0.386 (1.00) |
0.234 (1.00) |
0.181 (1.00) |
0.2 (1.00) |
0.883 (1.00) |
0.725 (1.00) |
| 9q loss | 27 (9%) | 259 |
0.733 (1.00) |
0.218 (1.00) |
0.826 (1.00) |
0.227 (1.00) |
0.269 (1.00) |
0.259 (1.00) |
1 (1.00) |
0.589 (1.00) |
| 10p loss | 43 (15%) | 243 |
0.23 (1.00) |
0.299 (1.00) |
0.469 (1.00) |
0.109 (1.00) |
0.313 (1.00) |
1 (1.00) |
0.852 (1.00) |
0.824 (1.00) |
| 10q loss | 28 (10%) | 258 |
0.116 (1.00) |
0.503 (1.00) |
0.51 (1.00) |
0.59 (1.00) |
0.804 (1.00) |
1 (1.00) |
0.823 (1.00) |
0.791 (1.00) |
| 11p loss | 52 (18%) | 234 |
0.0407 (1.00) |
0.707 (1.00) |
0.236 (1.00) |
0.836 (1.00) |
0.012 (1.00) |
0.0867 (1.00) |
0.388 (1.00) |
0.539 (1.00) |
| 11q loss | 76 (27%) | 210 |
0.538 (1.00) |
0.168 (1.00) |
0.00169 (1.00) |
0.962 (1.00) |
0.0258 (1.00) |
0.174 (1.00) |
0.449 (1.00) |
0.0694 (1.00) |
| 12p loss | 14 (5%) | 272 |
0.086 (1.00) |
0.00362 (1.00) |
0.363 (1.00) |
0.346 (1.00) |
0.0146 (1.00) |
0.00656 (1.00) |
0.211 (1.00) |
0.258 (1.00) |
| 12q loss | 13 (5%) | 273 |
0.862 (1.00) |
0.601 (1.00) |
0.363 (1.00) |
0.39 (1.00) |
0.163 (1.00) |
0.131 (1.00) |
0.751 (1.00) |
1 (1.00) |
| 13q loss | 59 (21%) | 227 |
0.395 (1.00) |
0.963 (1.00) |
0.259 (1.00) |
0.849 (1.00) |
0.583 (1.00) |
0.503 (1.00) |
0.87 (1.00) |
0.561 (1.00) |
| 14q loss | 14 (5%) | 272 |
0.719 (1.00) |
0.959 (1.00) |
0.363 (1.00) |
0.0521 (1.00) |
0.512 (1.00) |
0.00656 (1.00) |
0.534 (1.00) |
0.709 (1.00) |
| 15q loss | 25 (9%) | 261 |
0.94 (1.00) |
0.429 (1.00) |
0.486 (1.00) |
0.541 (1.00) |
0.471 (1.00) |
1 (1.00) |
0.488 (1.00) |
0.577 (1.00) |
| 16p loss | 16 (6%) | 270 |
0.0305 (1.00) |
0.361 (1.00) |
1 (1.00) |
0.185 (1.00) |
0.716 (1.00) |
0.16 (1.00) |
1 (1.00) |
0.485 (1.00) |
| 16q loss | 23 (8%) | 263 |
0.568 (1.00) |
0.65 (1.00) |
0.63 (1.00) |
0.468 (1.00) |
0.876 (1.00) |
1 (1.00) |
0.806 (1.00) |
0.39 (1.00) |
| 17p loss | 40 (14%) | 246 |
0.301 (1.00) |
0.345 (1.00) |
0.258 (1.00) |
0.207 (1.00) |
0.457 (1.00) |
0.366 (1.00) |
0.849 (1.00) |
0.495 (1.00) |
| 17q loss | 8 (3%) | 278 |
0.605 (1.00) |
0.821 (1.00) |
0.111 (1.00) |
0.00993 (1.00) |
0.0832 (1.00) |
0.0821 (1.00) |
0.442 (1.00) |
0.622 (1.00) |
| 18p loss | 37 (13%) | 249 |
0.61 (1.00) |
0.586 (1.00) |
1 (1.00) |
0.986 (1.00) |
0.731 (1.00) |
0.0453 (1.00) |
0.691 (1.00) |
0.0922 (1.00) |
| 18q loss | 79 (28%) | 207 |
0.298 (1.00) |
0.00992 (1.00) |
0.0778 (1.00) |
0.654 (1.00) |
0.753 (1.00) |
0.187 (1.00) |
0.552 (1.00) |
0.157 (1.00) |
| 19p loss | 30 (10%) | 256 |
0.00195 (1.00) |
0.636 (1.00) |
0.018 (1.00) |
0.209 (1.00) |
0.0211 (1.00) |
0.285 (1.00) |
0.274 (1.00) |
0.797 (1.00) |
| 19q loss | 22 (8%) | 264 |
0.0217 (1.00) |
0.734 (1.00) |
0.00666 (1.00) |
0.0624 (1.00) |
0.00578 (1.00) |
0.215 (1.00) |
0.456 (1.00) |
0.768 (1.00) |
| 20p loss | 15 (5%) | 271 |
0.527 (1.00) |
0.661 (1.00) |
0.247 (1.00) |
0.686 (1.00) |
0.187 (1.00) |
0.15 (1.00) |
0.766 (1.00) |
0.72 (1.00) |
| 20q loss | 6 (2%) | 280 |
0.208 (1.00) |
0.519 (1.00) |
0.189 (1.00) |
0.853 (1.00) |
0.767 (1.00) |
0.0621 (1.00) |
0.658 (1.00) |
1 (1.00) |
| 21q loss | 54 (19%) | 232 |
0.573 (1.00) |
0.132 (1.00) |
0.0434 (1.00) |
0.498 (1.00) |
0.099 (1.00) |
0.0899 (1.00) |
0.865 (1.00) |
1 (1.00) |
| 22q loss | 23 (8%) | 263 |
0.208 (1.00) |
0.782 (1.00) |
0.334 (1.00) |
0.521 (1.00) |
0.704 (1.00) |
0.224 (1.00) |
1 (1.00) |
1 (1.00) |
P value = 1.49e-05 (logrank test), Q value = 0.0093
Table S1. Gene #54: '8p loss mutation analysis' versus Clinical Feature #1: 'Time to Death'
| nPatients | nDeath | Duration Range (Median), Month | |
|---|---|---|---|
| ALL | 284 | 119 | 0.1 - 210.9 (13.8) |
| 8P LOSS MUTATED | 63 | 39 | 0.1 - 156.5 (10.2) |
| 8P LOSS WILD-TYPE | 221 | 80 | 0.8 - 210.9 (16.9) |
Figure S1. Get High-res Image Gene #54: '8p loss mutation analysis' versus Clinical Feature #1: 'Time to Death'
-
Mutation data file = broad_values_by_arm.mutsig.cluster.txt
-
Clinical data file = HNSC.clin.merged.picked.txt
-
Number of patients = 286
-
Number of significantly arm-level cnvs = 78
-
Number of selected clinical features = 8
-
Exclude genes that fewer than K tumors have mutations, K = 3
For survival clinical features, the Kaplan-Meier survival curves of tumors with and without gene mutations were plotted and the statistical significance P values were estimated by logrank test (Bland and Altman 2004) using the 'survdiff' function in R
For continuous numerical clinical features, two-tailed Student's t test with unequal variance (Lehmann and Romano 2005) was applied to compare the clinical values between tumors with and without gene mutations using 't.test' function in R
For binary or multi-class clinical features (nominal or ordinal), two-tailed Fisher's exact tests (Fisher 1922) were used to estimate the P values using the 'fisher.test' function in R
For multiple hypothesis correction, Q value is the False Discovery Rate (FDR) analogue of the P value (Benjamini and Hochberg 1995), defined as the minimum FDR at which the test may be called significant. We used the 'Benjamini and Hochberg' method of 'p.adjust' function in R to convert P values into Q values.
This is an experimental feature. The full results of the analysis summarized in this report can be downloaded from the TCGA Data Coordination Center.