This pipeline computes the correlation between significant arm-level copy number variations (cnvs) and selected clinical features.
Testing the association between copy number variation 51 arm-level results and 7 clinical features across 144 patients, 13 significant findings detected with Q value < 0.25.
-
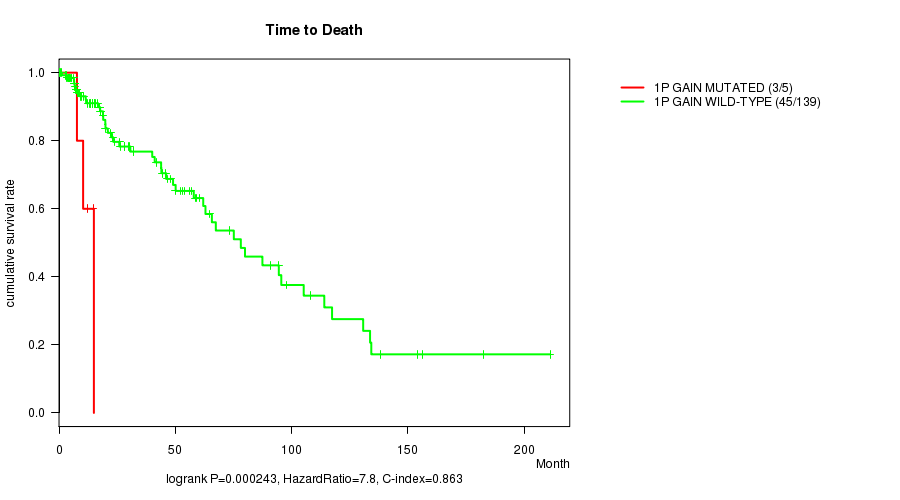
1p gain cnv correlated to 'Time to Death'.
-
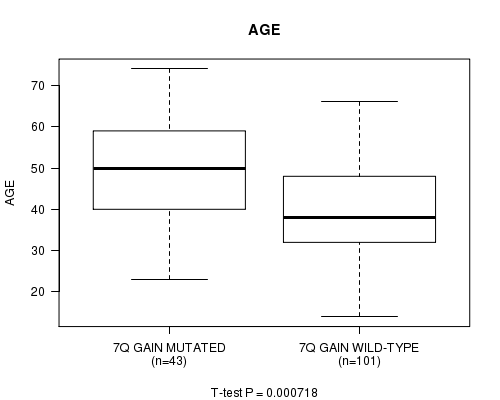
7q gain cnv correlated to 'AGE'.
-
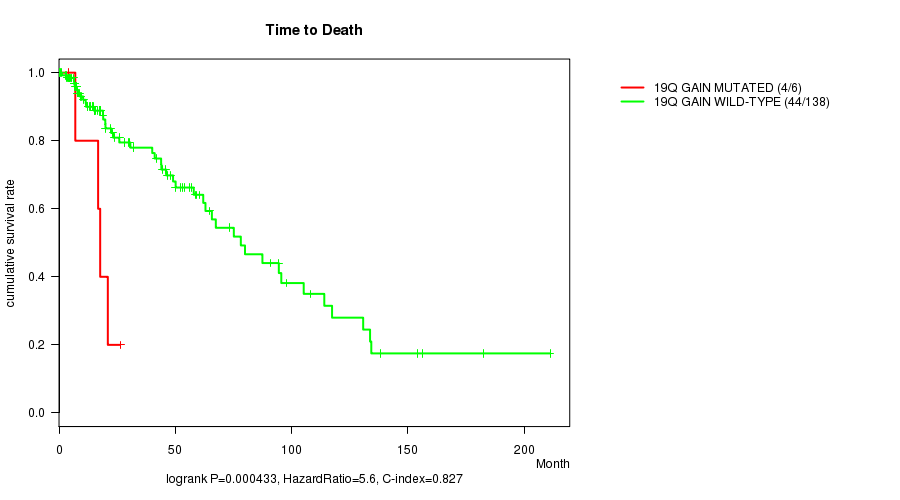
19q gain cnv correlated to 'Time to Death'.
-
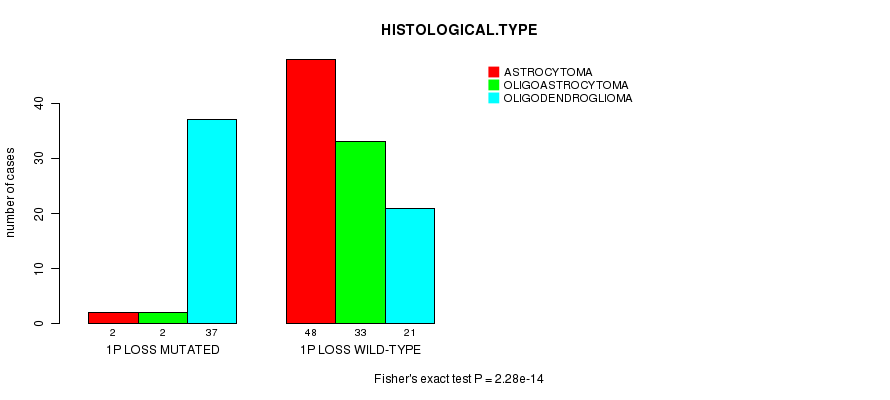
1p loss cnv correlated to 'HISTOLOGICAL.TYPE' and 'RADIATIONS.RADIATION.REGIMENINDICATION'.
-
1q loss cnv correlated to 'HISTOLOGICAL.TYPE'.
-
6q loss cnv correlated to 'HISTOLOGICAL.TYPE'.
-
10p loss cnv correlated to 'Time to Death' and 'AGE'.
-
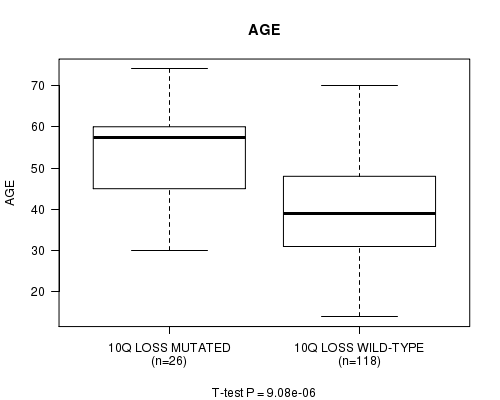
10q loss cnv correlated to 'Time to Death' and 'AGE'.
-
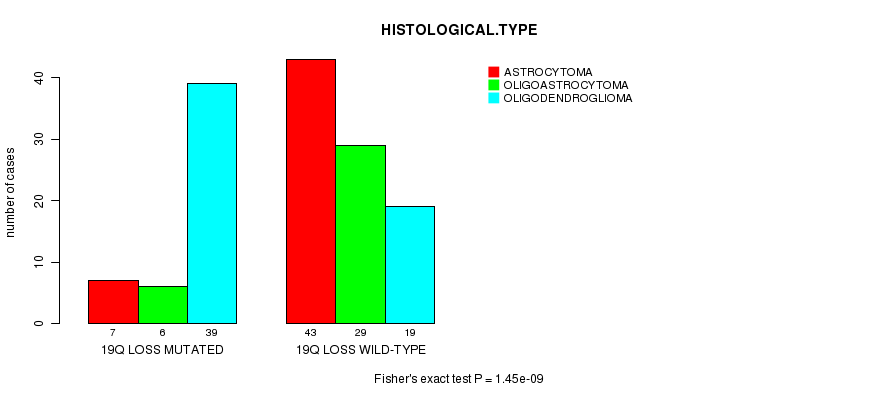
19q loss cnv correlated to 'HISTOLOGICAL.TYPE'.
-
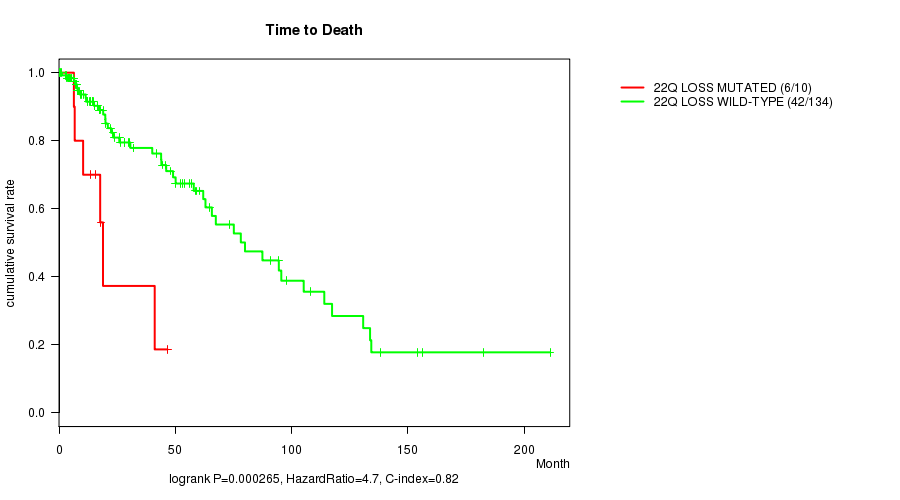
22q loss cnv correlated to 'Time to Death'.
Table 1. Get Full Table Overview of the association between significant copy number variation of 51 arm-level results and 7 clinical features. Shown in the table are P values (Q values). Thresholded by Q value < 0.25, 13 significant findings detected.
|
Clinical Features |
Time to Death |
AGE | GENDER |
KARNOFSKY PERFORMANCE SCORE |
HISTOLOGICAL TYPE |
RADIATIONS RADIATION REGIMENINDICATION |
NEOADJUVANT THERAPY |
||
| nCNV (%) | nWild-Type | logrank test | t-test | Fisher's exact test | t-test | Fisher's exact test | Fisher's exact test | Fisher's exact test | |
| 1p loss | 41 (28%) | 103 |
0.113 (1.00) |
0.0555 (1.00) |
0.71 (1.00) |
0.941 (1.00) |
2.28e-14 (7.79e-12) |
0.000133 (0.0442) |
1 (1.00) |
| 10p loss | 22 (15%) | 122 |
7.96e-10 (2.7e-07) |
6.65e-06 (0.00224) |
0.252 (1.00) |
0.441 (1.00) |
0.0238 (1.00) |
0.481 (1.00) |
0.648 (1.00) |
| 10q loss | 26 (18%) | 118 |
4.78e-11 (1.62e-08) |
9.08e-06 (0.00304) |
0.126 (1.00) |
0.507 (1.00) |
0.0072 (1.00) |
0.184 (1.00) |
0.391 (1.00) |
| 1p gain | 5 (3%) | 139 |
0.000243 (0.0807) |
0.0217 (1.00) |
0.652 (1.00) |
0.465 (1.00) |
0.0619 (1.00) |
1 (1.00) |
0.206 (1.00) |
| 7q gain | 43 (30%) | 101 |
0.0523 (1.00) |
0.000718 (0.236) |
0.27 (1.00) |
0.869 (1.00) |
0.212 (1.00) |
0.267 (1.00) |
0.718 (1.00) |
| 19q gain | 6 (4%) | 138 |
0.000433 (0.143) |
0.0488 (1.00) |
0.236 (1.00) |
0.315 (1.00) |
0.382 (1.00) |
0.402 (1.00) |
0.681 (1.00) |
| 1q loss | 23 (16%) | 121 |
0.223 (1.00) |
0.279 (1.00) |
0.651 (1.00) |
0.97 (1.00) |
4.97e-06 (0.00168) |
0.248 (1.00) |
0.261 (1.00) |
| 6q loss | 18 (12%) | 126 |
0.00686 (1.00) |
0.487 (1.00) |
0.312 (1.00) |
0.475 (1.00) |
8.27e-05 (0.0276) |
0.00873 (1.00) |
0.322 (1.00) |
| 19q loss | 52 (36%) | 92 |
0.0218 (1.00) |
0.451 (1.00) |
0.862 (1.00) |
0.785 (1.00) |
1.45e-09 (4.92e-07) |
0.00502 (1.00) |
0.165 (1.00) |
| 22q loss | 10 (7%) | 134 |
0.000265 (0.0876) |
0.886 (1.00) |
0.745 (1.00) |
0.21 (1.00) |
0.00569 (1.00) |
0.524 (1.00) |
0.53 (1.00) |
| 1q gain | 6 (4%) | 138 |
0.142 (1.00) |
0.0366 (1.00) |
0.403 (1.00) |
0.457 (1.00) |
0.282 (1.00) |
1 (1.00) |
0.438 (1.00) |
| 7p gain | 30 (21%) | 114 |
0.0504 (1.00) |
0.0263 (1.00) |
0.219 (1.00) |
0.578 (1.00) |
0.0263 (1.00) |
0.0982 (1.00) |
0.54 (1.00) |
| 8p gain | 13 (9%) | 131 |
0.706 (1.00) |
0.536 (1.00) |
0.778 (1.00) |
0.739 (1.00) |
0.759 (1.00) |
0.0751 (1.00) |
0.397 (1.00) |
| 8q gain | 22 (15%) | 122 |
0.941 (1.00) |
0.472 (1.00) |
0.641 (1.00) |
0.69 (1.00) |
0.295 (1.00) |
0.239 (1.00) |
1 (1.00) |
| 9p gain | 3 (2%) | 141 |
0.125 (1.00) |
0.0178 (1.00) |
0.578 (1.00) |
0.344 (1.00) |
1 (1.00) |
0.617 (1.00) |
|
| 10p gain | 17 (12%) | 127 |
0.524 (1.00) |
0.0038 (1.00) |
0.3 (1.00) |
0.336 (1.00) |
0.0912 (1.00) |
0.433 (1.00) |
1 (1.00) |
| 10q gain | 3 (2%) | 141 |
0.396 (1.00) |
0.11 (1.00) |
0.259 (1.00) |
0.0548 (1.00) |
1 (1.00) |
0.117 (1.00) |
|
| 11p gain | 5 (3%) | 139 |
0.216 (1.00) |
0.779 (1.00) |
1 (1.00) |
0.44 (1.00) |
0.297 (1.00) |
1 (1.00) |
0.679 (1.00) |
| 11q gain | 10 (7%) | 134 |
0.535 (1.00) |
0.586 (1.00) |
0.328 (1.00) |
0.269 (1.00) |
0.842 (1.00) |
1 (1.00) |
1 (1.00) |
| 12p gain | 8 (6%) | 136 |
0.757 (1.00) |
0.00679 (1.00) |
0.0104 (1.00) |
0.59 (1.00) |
1 (1.00) |
0.275 (1.00) |
|
| 12q gain | 3 (2%) | 141 |
0.387 (1.00) |
0.00117 (0.384) |
0.259 (1.00) |
1 (1.00) |
0.565 (1.00) |
0.245 (1.00) |
|
| 15q gain | 3 (2%) | 141 |
0.75 (1.00) |
0.947 (1.00) |
0.259 (1.00) |
0.315 (1.00) |
0.344 (1.00) |
0.273 (1.00) |
0.617 (1.00) |
| 17p gain | 3 (2%) | 141 |
0.0416 (1.00) |
0.976 (1.00) |
0.259 (1.00) |
0.614 (1.00) |
1 (1.00) |
1 (1.00) |
|
| 17q gain | 5 (3%) | 139 |
0.0234 (1.00) |
0.66 (1.00) |
0.0702 (1.00) |
0.205 (1.00) |
1 (1.00) |
0.648 (1.00) |
1 (1.00) |
| 18p gain | 4 (3%) | 140 |
0.0547 (1.00) |
0.558 (1.00) |
0.315 (1.00) |
0.0169 (1.00) |
1 (1.00) |
1 (1.00) |
|
| 19p gain | 10 (7%) | 134 |
0.0146 (1.00) |
0.094 (1.00) |
1 (1.00) |
0.373 (1.00) |
0.162 (1.00) |
0.316 (1.00) |
1 (1.00) |
| 20p gain | 10 (7%) | 134 |
0.0277 (1.00) |
0.173 (1.00) |
0.745 (1.00) |
0.7 (1.00) |
0.338 (1.00) |
0.316 (1.00) |
0.53 (1.00) |
| 20q gain | 10 (7%) | 134 |
0.00201 (0.651) |
0.223 (1.00) |
0.745 (1.00) |
0.835 (1.00) |
0.254 (1.00) |
0.74 (1.00) |
1 (1.00) |
| 21q gain | 3 (2%) | 141 |
0.568 (1.00) |
0.982 (1.00) |
1 (1.00) |
0.182 (1.00) |
1 (1.00) |
1 (1.00) |
|
| 3p loss | 4 (3%) | 140 |
0.45 (1.00) |
0.0281 (1.00) |
1 (1.00) |
0.126 (1.00) |
0.648 (1.00) |
0.363 (1.00) |
|
| 3q loss | 6 (4%) | 138 |
0.983 (1.00) |
0.83 (1.00) |
0.236 (1.00) |
0.886 (1.00) |
0.282 (1.00) |
1 (1.00) |
1 (1.00) |
| 4p loss | 15 (10%) | 129 |
0.347 (1.00) |
0.0334 (1.00) |
0.583 (1.00) |
0.495 (1.00) |
0.0737 (1.00) |
0.283 (1.00) |
0.181 (1.00) |
| 4q loss | 20 (14%) | 124 |
0.147 (1.00) |
0.0997 (1.00) |
0.812 (1.00) |
0.36 (1.00) |
0.16 (1.00) |
0.218 (1.00) |
0.153 (1.00) |
| 5p loss | 12 (8%) | 132 |
0.248 (1.00) |
0.599 (1.00) |
0.233 (1.00) |
0.18 (1.00) |
0.00163 (0.531) |
0.361 (1.00) |
0.56 (1.00) |
| 5q loss | 8 (6%) | 136 |
0.0435 (1.00) |
0.718 (1.00) |
1 (1.00) |
0.44 (1.00) |
0.59 (1.00) |
0.144 (1.00) |
1 (1.00) |
| 6p loss | 3 (2%) | 141 |
0.00216 (0.696) |
0.791 (1.00) |
1 (1.00) |
0.536 (1.00) |
0.614 (1.00) |
0.273 (1.00) |
1 (1.00) |
| 8p loss | 3 (2%) | 141 |
0.746 (1.00) |
0.00574 (1.00) |
1 (1.00) |
0.344 (1.00) |
0.565 (1.00) |
0.117 (1.00) |
|
| 9p loss | 35 (24%) | 109 |
0.0247 (1.00) |
0.0127 (1.00) |
0.44 (1.00) |
0.803 (1.00) |
0.14 (1.00) |
0.00139 (0.453) |
0.081 (1.00) |
| 9q loss | 5 (3%) | 139 |
0.149 (1.00) |
0.0817 (1.00) |
0.652 (1.00) |
1 (1.00) |
1 (1.00) |
0.679 (1.00) |
|
| 11p loss | 15 (10%) | 129 |
0.257 (1.00) |
0.0261 (1.00) |
1 (1.00) |
0.969 (1.00) |
0.0434 (1.00) |
0.405 (1.00) |
1 (1.00) |
| 12p loss | 3 (2%) | 141 |
0.43 (1.00) |
0.423 (1.00) |
1 (1.00) |
0.614 (1.00) |
0.565 (1.00) |
0.617 (1.00) |
|
| 12q loss | 6 (4%) | 138 |
0.547 (1.00) |
0.306 (1.00) |
0.236 (1.00) |
0.195 (1.00) |
0.685 (1.00) |
0.681 (1.00) |
|
| 13q loss | 19 (13%) | 125 |
0.0624 (1.00) |
0.152 (1.00) |
1 (1.00) |
0.432 (1.00) |
0.491 (1.00) |
0.217 (1.00) |
0.225 (1.00) |
| 14q loss | 23 (16%) | 121 |
0.00853 (1.00) |
0.796 (1.00) |
0.00223 (0.717) |
0.608 (1.00) |
0.0895 (1.00) |
0.489 (1.00) |
0.823 (1.00) |
| 15q loss | 10 (7%) | 134 |
0.865 (1.00) |
0.847 (1.00) |
0.188 (1.00) |
0.214 (1.00) |
0.202 (1.00) |
0.53 (1.00) |
|
| 16p loss | 3 (2%) | 141 |
0.319 (1.00) |
0.521 (1.00) |
1 (1.00) |
0.344 (1.00) |
1 (1.00) |
0.117 (1.00) |
|
| 16q loss | 5 (3%) | 139 |
0.832 (1.00) |
0.276 (1.00) |
1 (1.00) |
0.534 (1.00) |
0.648 (1.00) |
0.679 (1.00) |
|
| 18p loss | 10 (7%) | 134 |
0.948 (1.00) |
0.276 (1.00) |
0.745 (1.00) |
0.44 (1.00) |
0.12 (1.00) |
1 (1.00) |
1 (1.00) |
| 18q loss | 13 (9%) | 131 |
0.239 (1.00) |
0.626 (1.00) |
0.24 (1.00) |
0.486 (1.00) |
0.103 (1.00) |
0.562 (1.00) |
0.397 (1.00) |
| 19p loss | 28 (19%) | 116 |
0.179 (1.00) |
0.592 (1.00) |
0.288 (1.00) |
0.599 (1.00) |
0.00132 (0.432) |
0.285 (1.00) |
0.0936 (1.00) |
| 21q loss | 5 (3%) | 139 |
0.955 (1.00) |
0.735 (1.00) |
1 (1.00) |
0.534 (1.00) |
1 (1.00) |
0.679 (1.00) |
P value = 0.000243 (logrank test), Q value = 0.081
Table S1. Gene #1: '1p gain mutation analysis' versus Clinical Feature #1: 'Time to Death'
| nPatients | nDeath | Duration Range (Median), Month | |
|---|---|---|---|
| ALL | 144 | 48 | 0.0 - 211.2 (18.0) |
| 1P GAIN MUTATED | 5 | 3 | 7.7 - 15.0 (12.4) |
| 1P GAIN WILD-TYPE | 139 | 45 | 0.0 - 211.2 (18.9) |
Figure S1. Get High-res Image Gene #1: '1p gain mutation analysis' versus Clinical Feature #1: 'Time to Death'
P value = 0.000718 (t-test), Q value = 0.24
Table S2. Gene #4: '7q gain mutation analysis' versus Clinical Feature #2: 'AGE'
| nPatients | Mean (Std.Dev) | |
|---|---|---|
| ALL | 144 | 42.7 (13.0) |
| 7Q GAIN MUTATED | 43 | 48.6 (13.6) |
| 7Q GAIN WILD-TYPE | 101 | 40.2 (11.9) |
Figure S2. Get High-res Image Gene #4: '7q gain mutation analysis' versus Clinical Feature #2: 'AGE'
P value = 0.000433 (logrank test), Q value = 0.14
Table S3. Gene #19: '19q gain mutation analysis' versus Clinical Feature #1: 'Time to Death'
| nPatients | nDeath | Duration Range (Median), Month | |
|---|---|---|---|
| ALL | 144 | 48 | 0.0 - 211.2 (18.0) |
| 19Q GAIN MUTATED | 6 | 4 | 4.1 - 26.3 (17.2) |
| 19Q GAIN WILD-TYPE | 138 | 44 | 0.0 - 211.2 (18.4) |
Figure S3. Get High-res Image Gene #19: '19q gain mutation analysis' versus Clinical Feature #1: 'Time to Death'
P value = 2.28e-14 (Fisher's exact test), Q value = 7.8e-12
Table S4. Gene #23: '1p loss mutation analysis' versus Clinical Feature #5: 'HISTOLOGICAL.TYPE'
| nPatients | ASTROCYTOMA | OLIGOASTROCYTOMA | OLIGODENDROGLIOMA |
|---|---|---|---|
| ALL | 50 | 35 | 58 |
| 1P LOSS MUTATED | 2 | 2 | 37 |
| 1P LOSS WILD-TYPE | 48 | 33 | 21 |
Figure S4. Get High-res Image Gene #23: '1p loss mutation analysis' versus Clinical Feature #5: 'HISTOLOGICAL.TYPE'
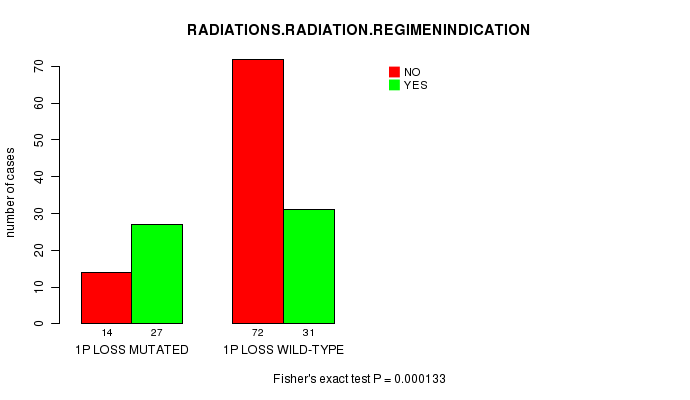
P value = 0.000133 (Fisher's exact test), Q value = 0.044
Table S5. Gene #23: '1p loss mutation analysis' versus Clinical Feature #6: 'RADIATIONS.RADIATION.REGIMENINDICATION'
| nPatients | NO | YES |
|---|---|---|
| ALL | 86 | 58 |
| 1P LOSS MUTATED | 14 | 27 |
| 1P LOSS WILD-TYPE | 72 | 31 |
Figure S5. Get High-res Image Gene #23: '1p loss mutation analysis' versus Clinical Feature #6: 'RADIATIONS.RADIATION.REGIMENINDICATION'
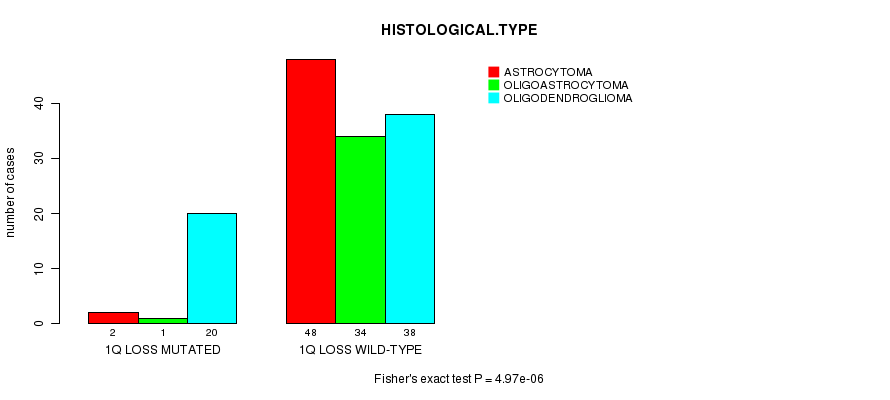
P value = 4.97e-06 (Fisher's exact test), Q value = 0.0017
Table S6. Gene #24: '1q loss mutation analysis' versus Clinical Feature #5: 'HISTOLOGICAL.TYPE'
| nPatients | ASTROCYTOMA | OLIGOASTROCYTOMA | OLIGODENDROGLIOMA |
|---|---|---|---|
| ALL | 50 | 35 | 58 |
| 1Q LOSS MUTATED | 2 | 1 | 20 |
| 1Q LOSS WILD-TYPE | 48 | 34 | 38 |
Figure S6. Get High-res Image Gene #24: '1q loss mutation analysis' versus Clinical Feature #5: 'HISTOLOGICAL.TYPE'
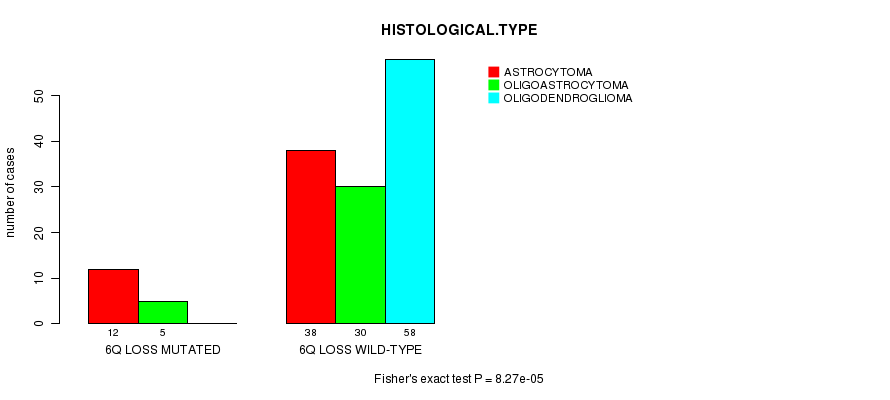
P value = 8.27e-05 (Fisher's exact test), Q value = 0.028
Table S7. Gene #32: '6q loss mutation analysis' versus Clinical Feature #5: 'HISTOLOGICAL.TYPE'
| nPatients | ASTROCYTOMA | OLIGOASTROCYTOMA | OLIGODENDROGLIOMA |
|---|---|---|---|
| ALL | 50 | 35 | 58 |
| 6Q LOSS MUTATED | 12 | 5 | 0 |
| 6Q LOSS WILD-TYPE | 38 | 30 | 58 |
Figure S7. Get High-res Image Gene #32: '6q loss mutation analysis' versus Clinical Feature #5: 'HISTOLOGICAL.TYPE'
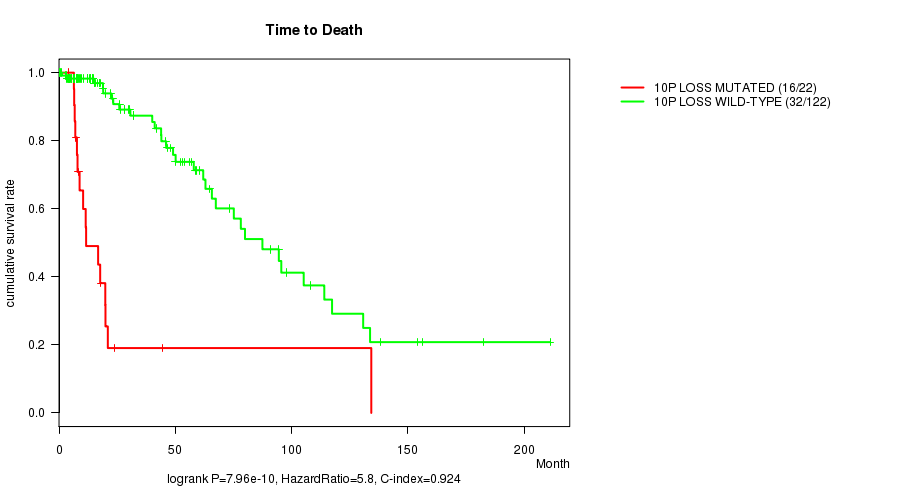
P value = 7.96e-10 (logrank test), Q value = 2.7e-07
Table S8. Gene #36: '10p loss mutation analysis' versus Clinical Feature #1: 'Time to Death'
| nPatients | nDeath | Duration Range (Median), Month | |
|---|---|---|---|
| ALL | 144 | 48 | 0.0 - 211.2 (18.0) |
| 10P LOSS MUTATED | 22 | 16 | 4.1 - 134.3 (10.9) |
| 10P LOSS WILD-TYPE | 122 | 32 | 0.0 - 211.2 (21.0) |
Figure S8. Get High-res Image Gene #36: '10p loss mutation analysis' versus Clinical Feature #1: 'Time to Death'
P value = 6.65e-06 (t-test), Q value = 0.0022
Table S9. Gene #36: '10p loss mutation analysis' versus Clinical Feature #2: 'AGE'
| nPatients | Mean (Std.Dev) | |
|---|---|---|
| ALL | 144 | 42.7 (13.0) |
| 10P LOSS MUTATED | 22 | 54.6 (11.0) |
| 10P LOSS WILD-TYPE | 122 | 40.6 (12.2) |
Figure S9. Get High-res Image Gene #36: '10p loss mutation analysis' versus Clinical Feature #2: 'AGE'

P value = 4.78e-11 (logrank test), Q value = 1.6e-08
Table S10. Gene #37: '10q loss mutation analysis' versus Clinical Feature #1: 'Time to Death'
| nPatients | nDeath | Duration Range (Median), Month | |
|---|---|---|---|
| ALL | 144 | 48 | 0.0 - 211.2 (18.0) |
| 10Q LOSS MUTATED | 26 | 18 | 4.1 - 134.3 (12.0) |
| 10Q LOSS WILD-TYPE | 118 | 30 | 0.0 - 211.2 (22.8) |
Figure S10. Get High-res Image Gene #37: '10q loss mutation analysis' versus Clinical Feature #1: 'Time to Death'
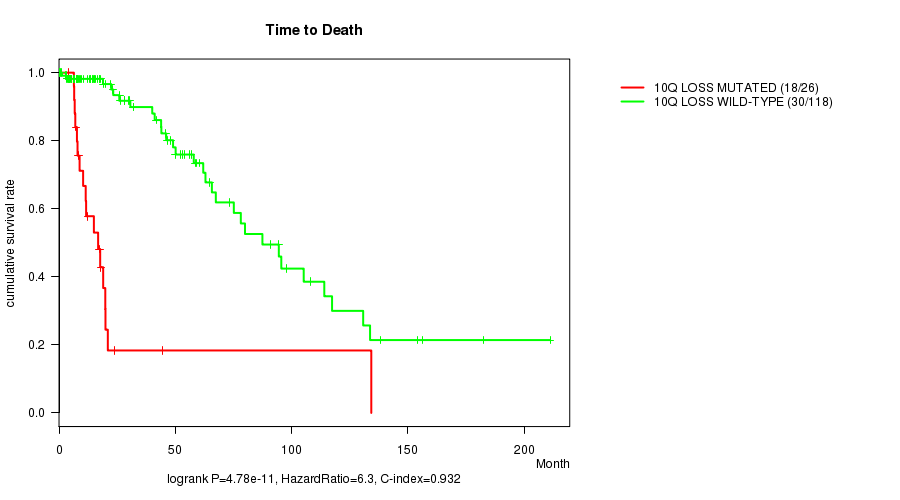
P value = 9.08e-06 (t-test), Q value = 0.003
Table S11. Gene #37: '10q loss mutation analysis' versus Clinical Feature #2: 'AGE'
| nPatients | Mean (Std.Dev) | |
|---|---|---|
| ALL | 144 | 42.7 (13.0) |
| 10Q LOSS MUTATED | 26 | 53.2 (11.4) |
| 10Q LOSS WILD-TYPE | 118 | 40.4 (12.2) |
Figure S11. Get High-res Image Gene #37: '10q loss mutation analysis' versus Clinical Feature #2: 'AGE'
P value = 1.45e-09 (Fisher's exact test), Q value = 4.9e-07
Table S12. Gene #49: '19q loss mutation analysis' versus Clinical Feature #5: 'HISTOLOGICAL.TYPE'
| nPatients | ASTROCYTOMA | OLIGOASTROCYTOMA | OLIGODENDROGLIOMA |
|---|---|---|---|
| ALL | 50 | 35 | 58 |
| 19Q LOSS MUTATED | 7 | 6 | 39 |
| 19Q LOSS WILD-TYPE | 43 | 29 | 19 |
Figure S12. Get High-res Image Gene #49: '19q loss mutation analysis' versus Clinical Feature #5: 'HISTOLOGICAL.TYPE'
P value = 0.000265 (logrank test), Q value = 0.088
Table S13. Gene #51: '22q loss mutation analysis' versus Clinical Feature #1: 'Time to Death'
| nPatients | nDeath | Duration Range (Median), Month | |
|---|---|---|---|
| ALL | 144 | 48 | 0.0 - 211.2 (18.0) |
| 22Q LOSS MUTATED | 10 | 6 | 6.4 - 46.6 (16.8) |
| 22Q LOSS WILD-TYPE | 134 | 42 | 0.0 - 211.2 (19.0) |
Figure S13. Get High-res Image Gene #51: '22q loss mutation analysis' versus Clinical Feature #1: 'Time to Death'
-
Mutation data file = broad_values_by_arm.mutsig.cluster.txt
-
Clinical data file = LGG.clin.merged.picked.txt
-
Number of patients = 144
-
Number of significantly arm-level cnvs = 51
-
Number of selected clinical features = 7
-
Exclude genes that fewer than K tumors have mutations, K = 3
For survival clinical features, the Kaplan-Meier survival curves of tumors with and without gene mutations were plotted and the statistical significance P values were estimated by logrank test (Bland and Altman 2004) using the 'survdiff' function in R
For continuous numerical clinical features, two-tailed Student's t test with unequal variance (Lehmann and Romano 2005) was applied to compare the clinical values between tumors with and without gene mutations using 't.test' function in R
For binary or multi-class clinical features (nominal or ordinal), two-tailed Fisher's exact tests (Fisher 1922) were used to estimate the P values using the 'fisher.test' function in R
For multiple hypothesis correction, Q value is the False Discovery Rate (FDR) analogue of the P value (Benjamini and Hochberg 1995), defined as the minimum FDR at which the test may be called significant. We used the 'Benjamini and Hochberg' method of 'p.adjust' function in R to convert P values into Q values.
This is an experimental feature. The full results of the analysis summarized in this report can be downloaded from the TCGA Data Coordination Center.