This pipeline computes the correlation between cancer subtypes identified by different molecular patterns and selected clinical features.
Testing the association between subtypes identified by 7 different clustering approaches and 10 clinical features across 283 patients, 10 significant findings detected with P value < 0.05.
-
CNMF clustering analysis on array-based mRNA expression data identified 4 subtypes that do not correlate to any clinical features.
-
Consensus hierarchical clustering analysis on array-based mRNA expression data identified 3 subtypes that do not correlate to any clinical features.
-
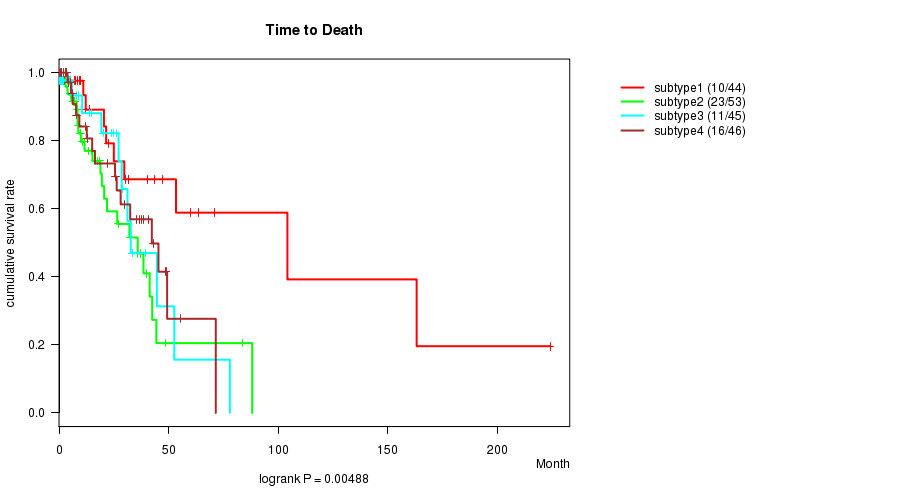
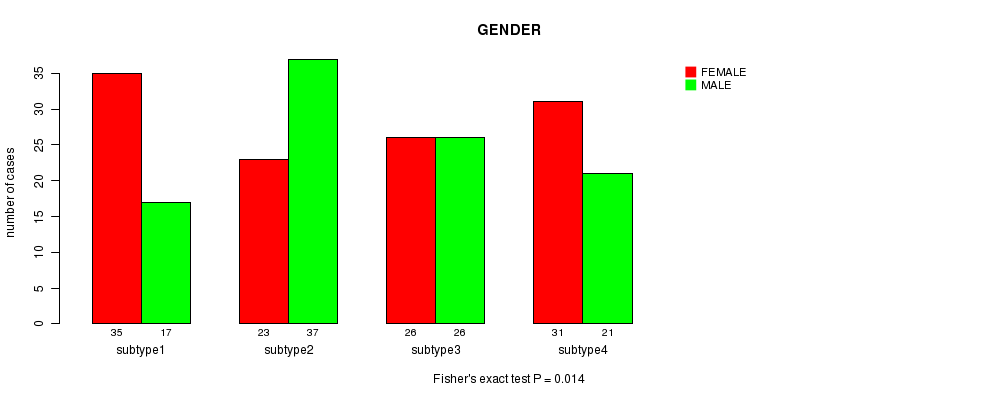
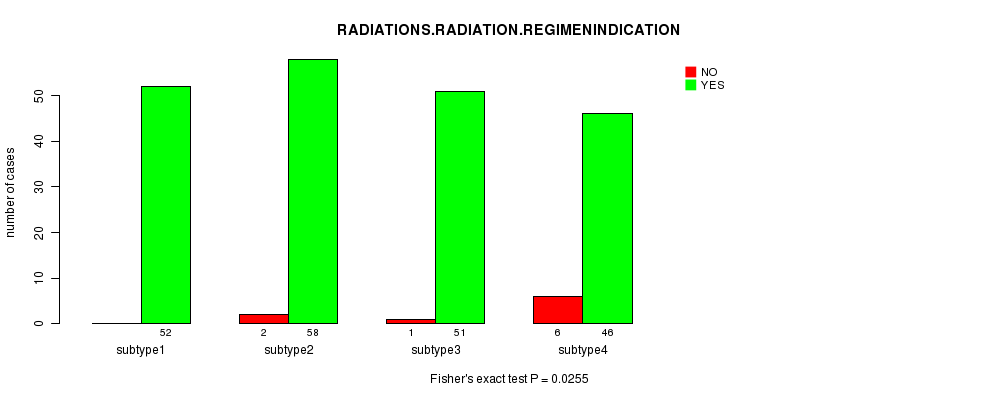
4 subtypes identified in current cancer cohort by 'METHLYATION CNMF'. These subtypes correlate to 'Time to Death', 'GENDER', and 'RADIATIONS.RADIATION.REGIMENINDICATION'.
-
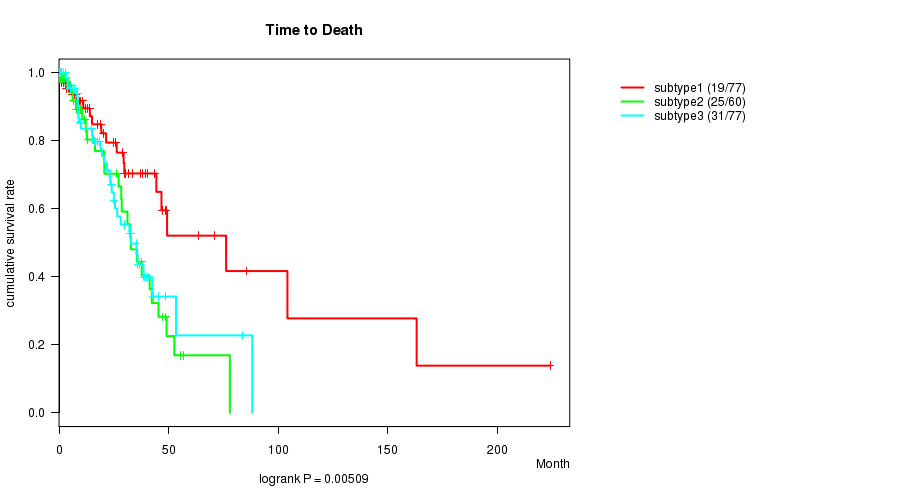
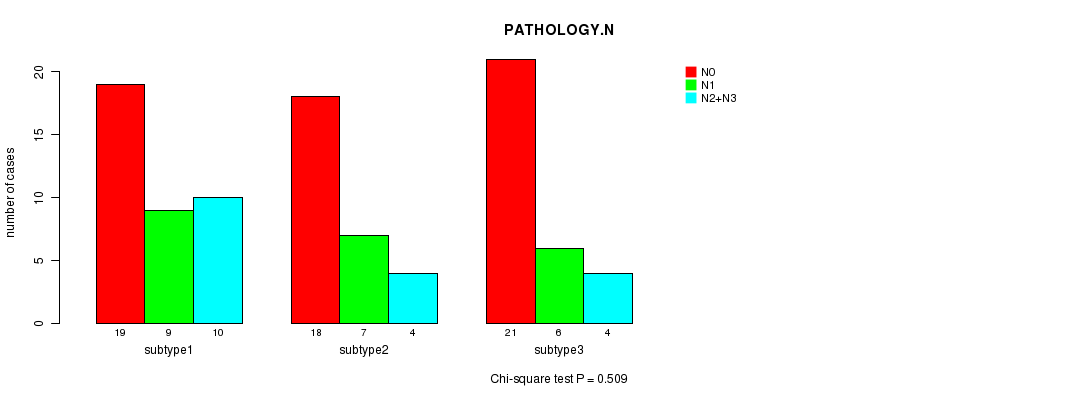
CNMF clustering analysis on sequencing-based mRNA expression data identified 3 subtypes that correlate to 'Time to Death', 'GENDER', and 'PATHOLOGY.N'.
-
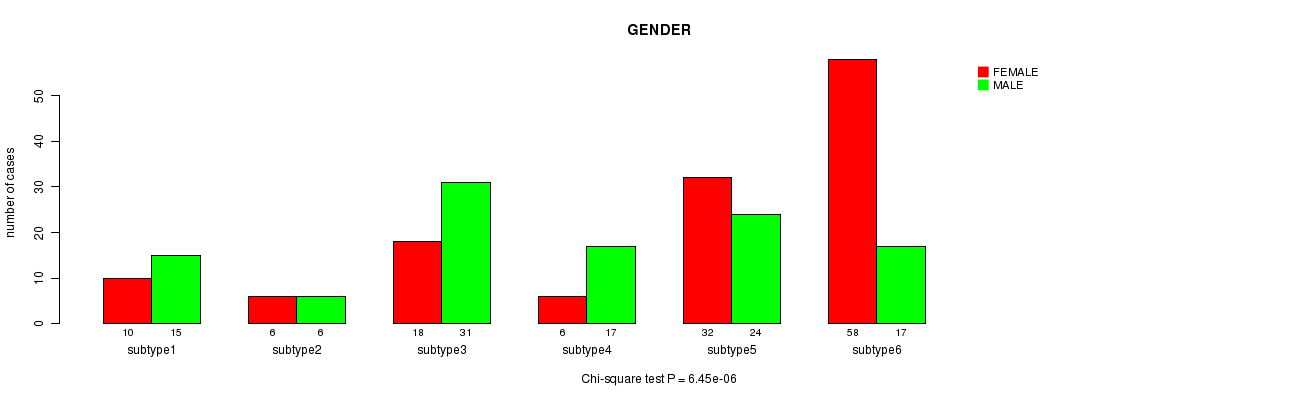
Consensus hierarchical clustering analysis on sequencing-based mRNA expression data identified 6 subtypes that correlate to 'Time to Death', 'GENDER', 'HISTOLOGICAL.TYPE', and 'PATHOLOGY.N'.
-
CNMF clustering analysis on sequencing-based miR expression data identified 3 subtypes that do not correlate to any clinical features.
-
Consensus hierarchical clustering analysis on sequencing-based miR expression data identified 3 subtypes that do not correlate to any clinical features.
Table 1. Get Full Table Overview of the association between subtypes identified by 7 different clustering approaches and 10 clinical features. Shown in the table are P values from statistical tests. Thresholded by P value < 0.05, 10 significant findings detected.
|
Clinical Features |
Statistical Tests |
mRNA CNMF subtypes |
mRNA cHierClus subtypes |
METHLYATION CNMF |
RNAseq CNMF subtypes |
RNAseq cHierClus subtypes |
MIRseq CNMF subtypes |
MIRseq cHierClus subtypes |
| Time to Death | logrank test | 0.337 | 0.671 | 0.00488 | 0.00509 | 2.87e-05 | 0.657 | 0.844 |
| AGE | ANOVA | 0.477 | 0.557 | 0.448 | 0.117 | 0.197 | 0.193 | 0.0506 |
| GENDER | Fisher's exact test | 0.272 | 0.383 | 0.014 | 2.22e-05 | 6.45e-06 | 0.0866 | 0.466 |
| KARNOFSKY PERFORMANCE SCORE | ANOVA | 0.679 | 0.631 | 0.576 | 0.43 | |||
| HISTOLOGICAL TYPE | Chi-square test | 0.3 | 0.274 | 0.191 | 0.112 | 0.000331 | 0.0827 | 0.0796 |
| PATHOLOGY T | Chi-square test | 0.489 | 0.479 | 0.755 | 0.224 | 0.0898 | 0.682 | 0.545 |
| PATHOLOGY N | Chi-square test | 0.572 | 0.651 | 0.574 | 0.0264 | 0.00175 | 0.509 | 0.599 |
| PATHOLOGICSPREAD(M) | Chi-square test | 0.504 | 1 | 0.435 | 0.421 | 0.488 | 0.144 | 0.0639 |
| RADIATIONS RADIATION REGIMENINDICATION | Fisher's exact test | 1 | 1 | 0.0255 | 1 | 0.661 | 0.552 | 0.821 |
| NEOADJUVANT THERAPY | Fisher's exact test | 0.921 | 1 | 0.296 | 0.576 | 0.166 | 1 | 0.682 |
Table S1. Get Full Table Description of clustering approach #1: 'mRNA CNMF subtypes'
| Cluster Labels | 1 | 2 | 3 | 4 |
|---|---|---|---|---|
| Number of samples | 5 | 9 | 12 | 6 |
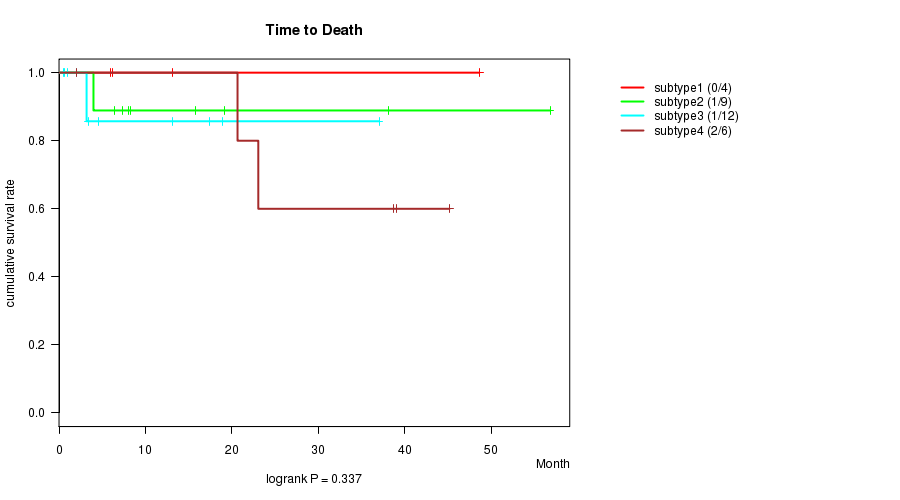
P value = 0.337 (logrank test)
Table S2. Clustering Approach #1: 'mRNA CNMF subtypes' versus Clinical Feature #1: 'Time to Death'
| nPatients | nDeath | Duration Range (Median), Month | |
|---|---|---|---|
| ALL | 31 | 4 | 0.5 - 56.8 (8.3) |
| subtype1 | 4 | 0 | 6.0 - 48.6 (9.7) |
| subtype2 | 9 | 1 | 4.0 - 56.8 (8.3) |
| subtype3 | 12 | 1 | 0.5 - 37.0 (3.3) |
| subtype4 | 6 | 2 | 2.0 - 45.2 (30.9) |
Figure S1. Get High-res Image Clustering Approach #1: 'mRNA CNMF subtypes' versus Clinical Feature #1: 'Time to Death'
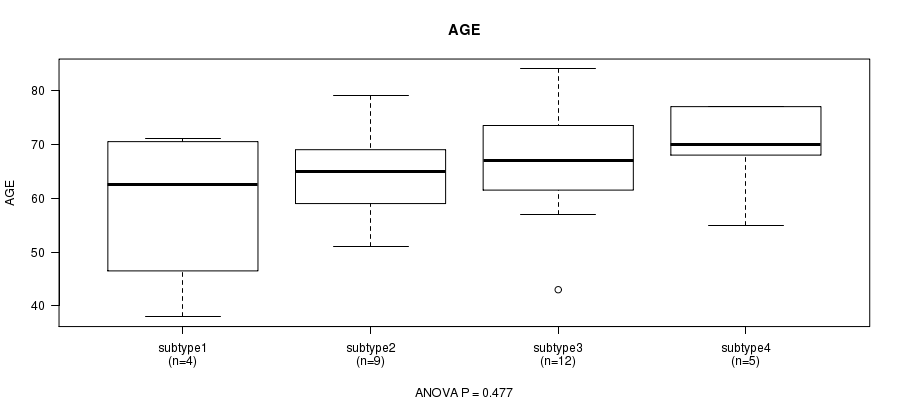
P value = 0.477 (ANOVA)
Table S3. Clustering Approach #1: 'mRNA CNMF subtypes' versus Clinical Feature #2: 'AGE'
| nPatients | Mean (Std.Dev) | |
|---|---|---|
| ALL | 30 | 65.7 (10.8) |
| subtype1 | 4 | 58.5 (15.5) |
| subtype2 | 9 | 65.0 (9.1) |
| subtype3 | 12 | 67.1 (11.1) |
| subtype4 | 5 | 69.4 (9.0) |
Figure S2. Get High-res Image Clustering Approach #1: 'mRNA CNMF subtypes' versus Clinical Feature #2: 'AGE'
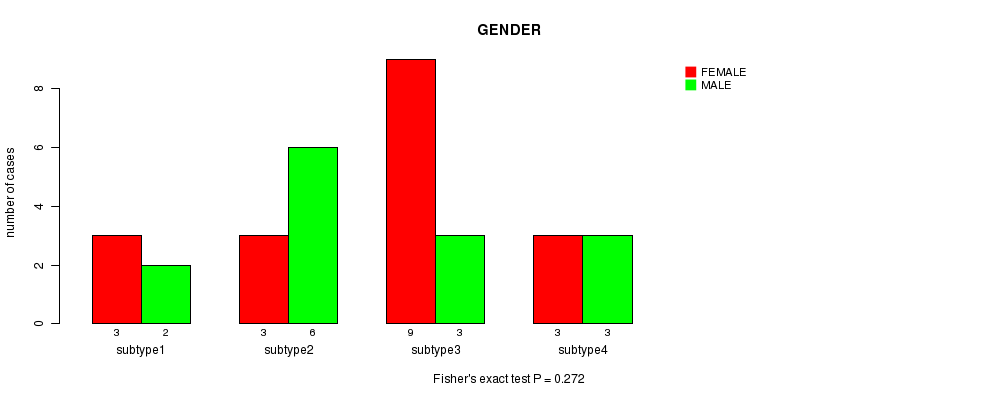
P value = 0.272 (Fisher's exact test)
Table S4. Clustering Approach #1: 'mRNA CNMF subtypes' versus Clinical Feature #3: 'GENDER'
| nPatients | FEMALE | MALE |
|---|---|---|
| ALL | 14 | 18 |
| subtype1 | 2 | 3 |
| subtype2 | 6 | 3 |
| subtype3 | 3 | 9 |
| subtype4 | 3 | 3 |
Figure S3. Get High-res Image Clustering Approach #1: 'mRNA CNMF subtypes' versus Clinical Feature #3: 'GENDER'
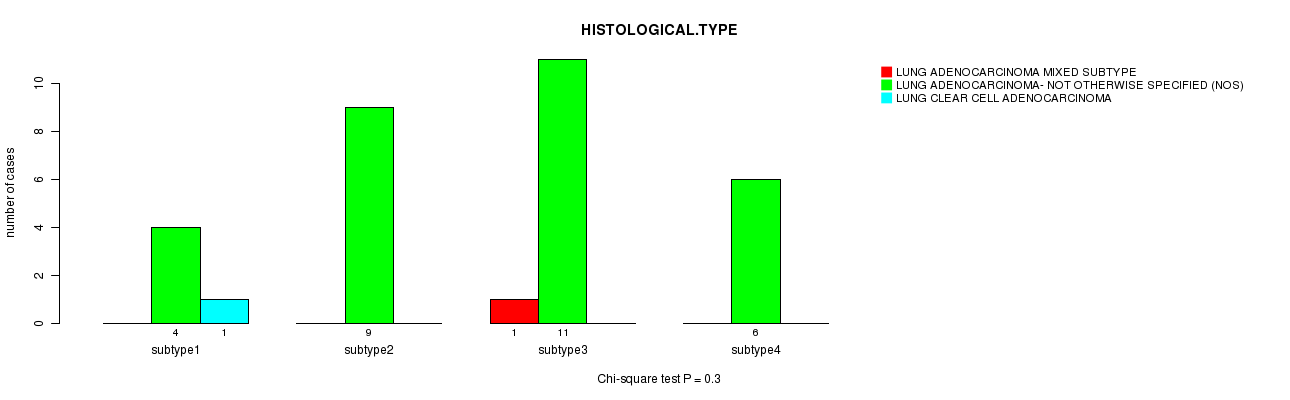
P value = 0.3 (Chi-square test)
Table S5. Clustering Approach #1: 'mRNA CNMF subtypes' versus Clinical Feature #5: 'HISTOLOGICAL.TYPE'
| nPatients | LUNG ADENOCARCINOMA MIXED SUBTYPE | LUNG ADENOCARCINOMA- NOT OTHERWISE SPECIFIED (NOS) | LUNG CLEAR CELL ADENOCARCINOMA |
|---|---|---|---|
| ALL | 1 | 30 | 1 |
| subtype1 | 0 | 4 | 1 |
| subtype2 | 0 | 9 | 0 |
| subtype3 | 1 | 11 | 0 |
| subtype4 | 0 | 6 | 0 |
Figure S4. Get High-res Image Clustering Approach #1: 'mRNA CNMF subtypes' versus Clinical Feature #5: 'HISTOLOGICAL.TYPE'
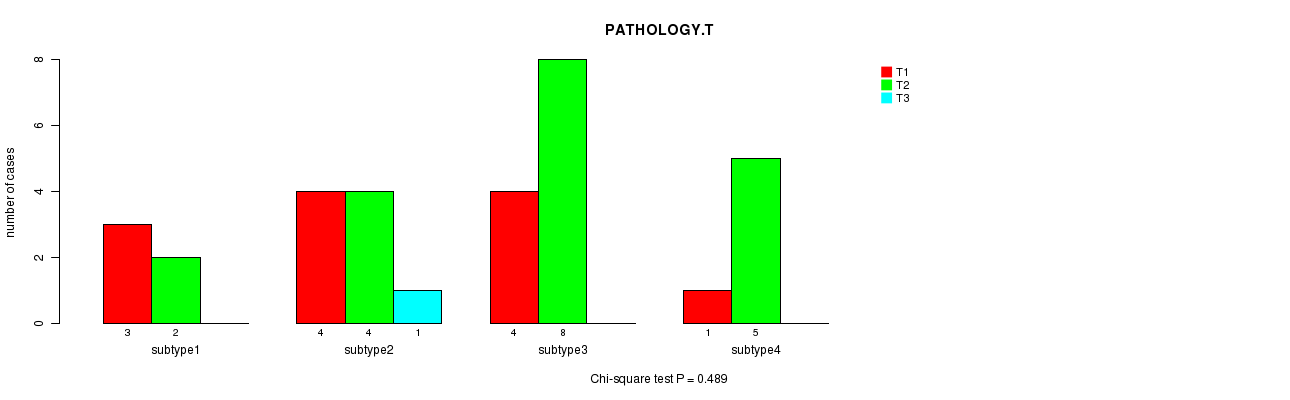
P value = 0.489 (Chi-square test)
Table S6. Clustering Approach #1: 'mRNA CNMF subtypes' versus Clinical Feature #6: 'PATHOLOGY.T'
| nPatients | T1 | T2 | T3 |
|---|---|---|---|
| ALL | 12 | 19 | 1 |
| subtype1 | 3 | 2 | 0 |
| subtype2 | 4 | 4 | 1 |
| subtype3 | 4 | 8 | 0 |
| subtype4 | 1 | 5 | 0 |
Figure S5. Get High-res Image Clustering Approach #1: 'mRNA CNMF subtypes' versus Clinical Feature #6: 'PATHOLOGY.T'
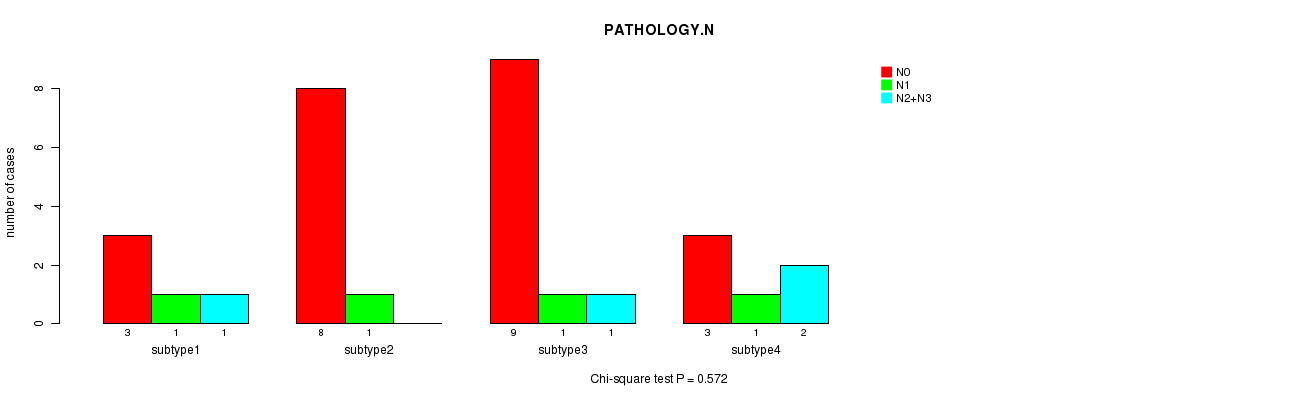
P value = 0.572 (Chi-square test)
Table S7. Clustering Approach #1: 'mRNA CNMF subtypes' versus Clinical Feature #7: 'PATHOLOGY.N'
| nPatients | N0 | N1 | N2+N3 |
|---|---|---|---|
| ALL | 23 | 4 | 4 |
| subtype1 | 3 | 1 | 1 |
| subtype2 | 8 | 1 | 0 |
| subtype3 | 9 | 1 | 1 |
| subtype4 | 3 | 1 | 2 |
Figure S6. Get High-res Image Clustering Approach #1: 'mRNA CNMF subtypes' versus Clinical Feature #7: 'PATHOLOGY.N'
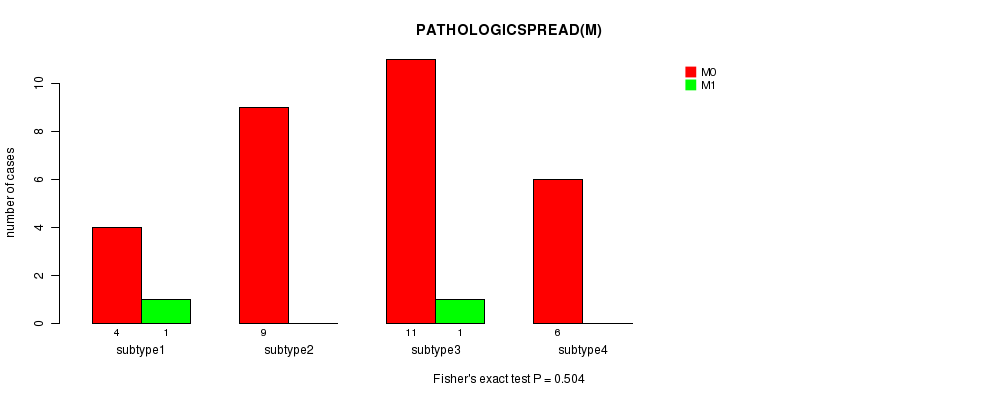
P value = 0.504 (Fisher's exact test)
Table S8. Clustering Approach #1: 'mRNA CNMF subtypes' versus Clinical Feature #8: 'PATHOLOGICSPREAD(M)'
| nPatients | M0 | M1 |
|---|---|---|
| ALL | 30 | 2 |
| subtype1 | 4 | 1 |
| subtype2 | 9 | 0 |
| subtype3 | 11 | 1 |
| subtype4 | 6 | 0 |
Figure S7. Get High-res Image Clustering Approach #1: 'mRNA CNMF subtypes' versus Clinical Feature #8: 'PATHOLOGICSPREAD(M)'
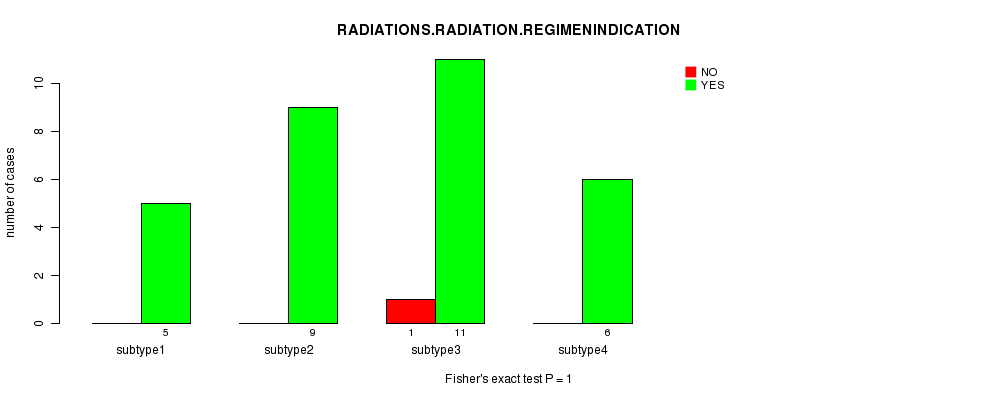
P value = 1 (Fisher's exact test)
Table S9. Clustering Approach #1: 'mRNA CNMF subtypes' versus Clinical Feature #9: 'RADIATIONS.RADIATION.REGIMENINDICATION'
| nPatients | NO | YES |
|---|---|---|
| ALL | 31 | 1 |
| subtype1 | 5 | 0 |
| subtype2 | 9 | 0 |
| subtype3 | 11 | 1 |
| subtype4 | 6 | 0 |
Figure S8. Get High-res Image Clustering Approach #1: 'mRNA CNMF subtypes' versus Clinical Feature #9: 'RADIATIONS.RADIATION.REGIMENINDICATION'
P value = 0.921 (Fisher's exact test)
Table S10. Clustering Approach #1: 'mRNA CNMF subtypes' versus Clinical Feature #10: 'NEOADJUVANT.THERAPY'
| nPatients | NO | YES |
|---|---|---|
| ALL | 26 | 6 |
| subtype1 | 4 | 1 |
| subtype2 | 8 | 1 |
| subtype3 | 9 | 3 |
| subtype4 | 5 | 1 |
Figure S9. Get High-res Image Clustering Approach #1: 'mRNA CNMF subtypes' versus Clinical Feature #10: 'NEOADJUVANT.THERAPY'
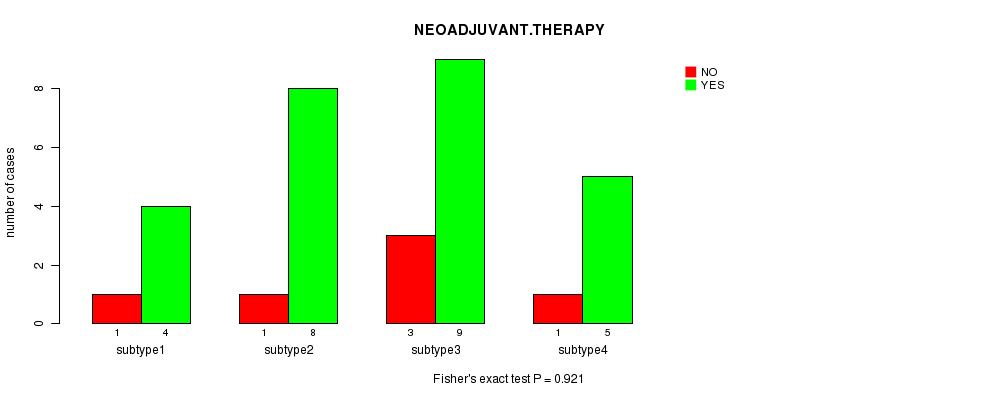
Table S11. Get Full Table Description of clustering approach #2: 'mRNA cHierClus subtypes'
| Cluster Labels | 1 | 2 | 3 |
|---|---|---|---|
| Number of samples | 7 | 13 | 12 |
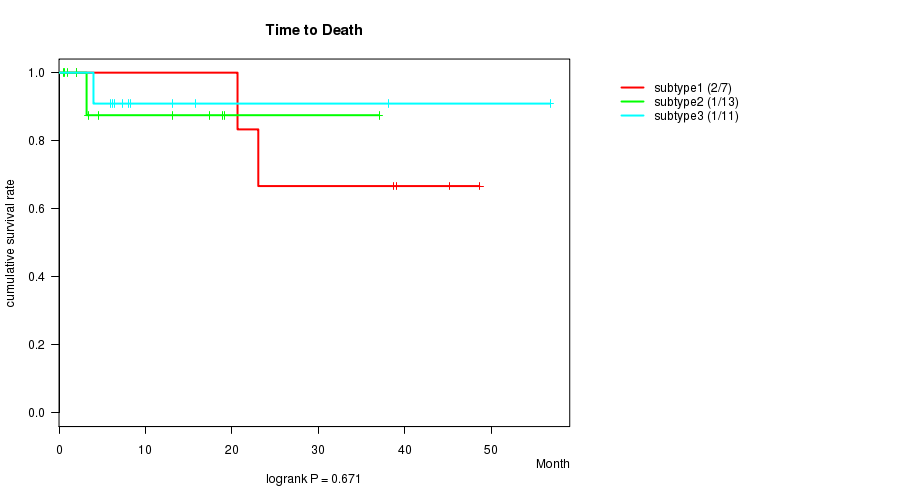
P value = 0.671 (logrank test)
Table S12. Clustering Approach #2: 'mRNA cHierClus subtypes' versus Clinical Feature #1: 'Time to Death'
| nPatients | nDeath | Duration Range (Median), Month | |
|---|---|---|---|
| ALL | 31 | 4 | 0.5 - 56.8 (8.3) |
| subtype1 | 7 | 2 | 2.0 - 48.6 (38.7) |
| subtype2 | 13 | 1 | 0.5 - 37.0 (3.4) |
| subtype3 | 11 | 1 | 4.0 - 56.8 (8.1) |
Figure S10. Get High-res Image Clustering Approach #2: 'mRNA cHierClus subtypes' versus Clinical Feature #1: 'Time to Death'
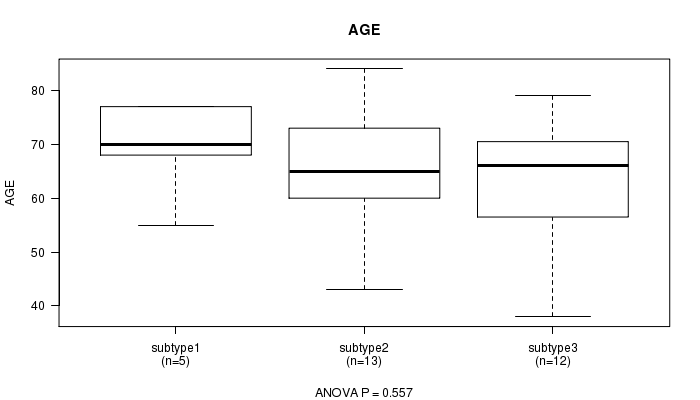
P value = 0.557 (ANOVA)
Table S13. Clustering Approach #2: 'mRNA cHierClus subtypes' versus Clinical Feature #2: 'AGE'
| nPatients | Mean (Std.Dev) | |
|---|---|---|
| ALL | 30 | 65.7 (10.8) |
| subtype1 | 5 | 69.4 (9.0) |
| subtype2 | 13 | 66.5 (10.9) |
| subtype3 | 12 | 63.3 (11.6) |
Figure S11. Get High-res Image Clustering Approach #2: 'mRNA cHierClus subtypes' versus Clinical Feature #2: 'AGE'
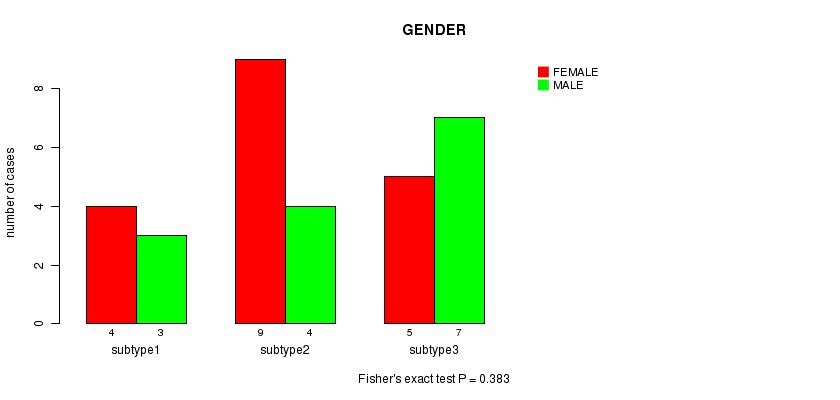
P value = 0.383 (Fisher's exact test)
Table S14. Clustering Approach #2: 'mRNA cHierClus subtypes' versus Clinical Feature #3: 'GENDER'
| nPatients | FEMALE | MALE |
|---|---|---|
| ALL | 14 | 18 |
| subtype1 | 3 | 4 |
| subtype2 | 4 | 9 |
| subtype3 | 7 | 5 |
Figure S12. Get High-res Image Clustering Approach #2: 'mRNA cHierClus subtypes' versus Clinical Feature #3: 'GENDER'
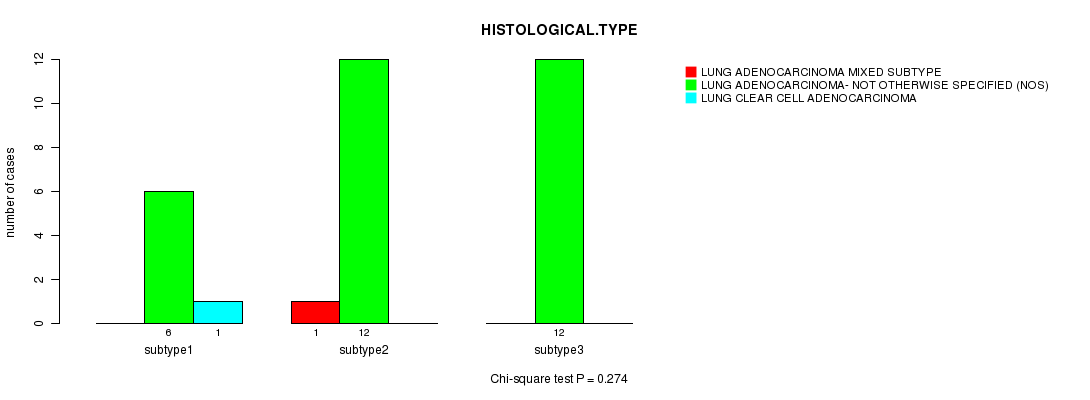
P value = 0.274 (Chi-square test)
Table S15. Clustering Approach #2: 'mRNA cHierClus subtypes' versus Clinical Feature #5: 'HISTOLOGICAL.TYPE'
| nPatients | LUNG ADENOCARCINOMA MIXED SUBTYPE | LUNG ADENOCARCINOMA- NOT OTHERWISE SPECIFIED (NOS) | LUNG CLEAR CELL ADENOCARCINOMA |
|---|---|---|---|
| ALL | 1 | 30 | 1 |
| subtype1 | 0 | 6 | 1 |
| subtype2 | 1 | 12 | 0 |
| subtype3 | 0 | 12 | 0 |
Figure S13. Get High-res Image Clustering Approach #2: 'mRNA cHierClus subtypes' versus Clinical Feature #5: 'HISTOLOGICAL.TYPE'
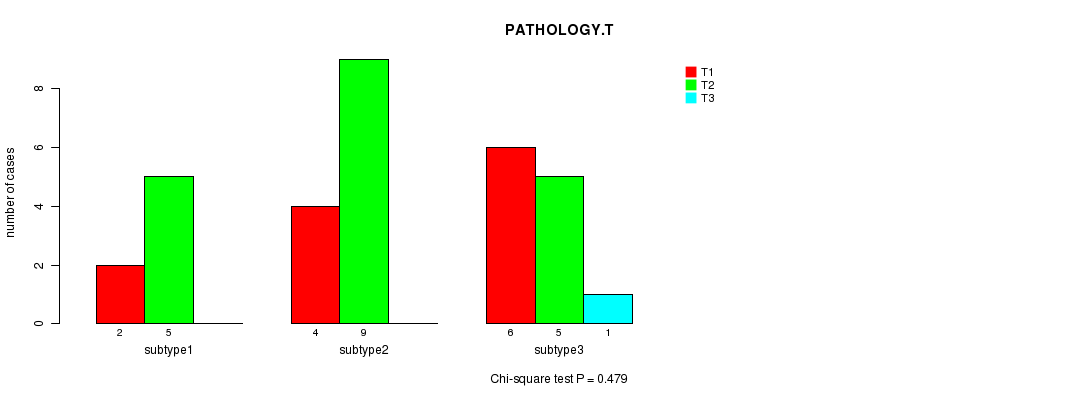
P value = 0.479 (Chi-square test)
Table S16. Clustering Approach #2: 'mRNA cHierClus subtypes' versus Clinical Feature #6: 'PATHOLOGY.T'
| nPatients | T1 | T2 | T3 |
|---|---|---|---|
| ALL | 12 | 19 | 1 |
| subtype1 | 2 | 5 | 0 |
| subtype2 | 4 | 9 | 0 |
| subtype3 | 6 | 5 | 1 |
Figure S14. Get High-res Image Clustering Approach #2: 'mRNA cHierClus subtypes' versus Clinical Feature #6: 'PATHOLOGY.T'
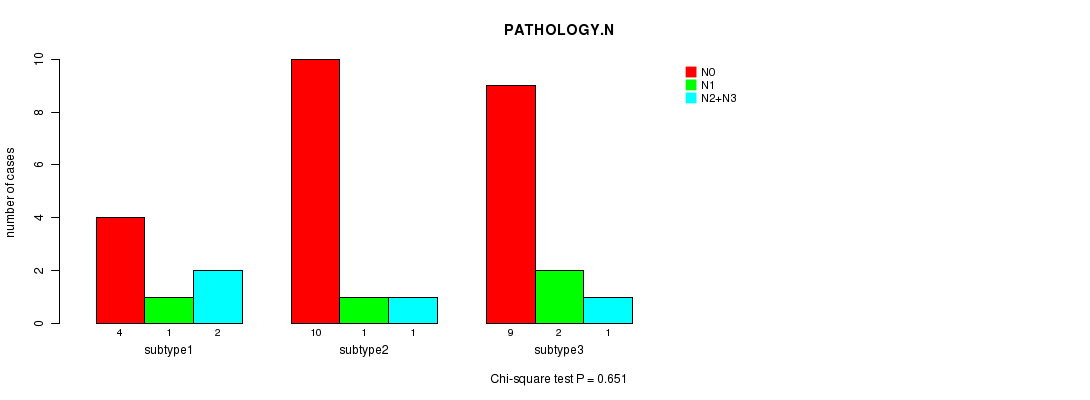
P value = 0.651 (Chi-square test)
Table S17. Clustering Approach #2: 'mRNA cHierClus subtypes' versus Clinical Feature #7: 'PATHOLOGY.N'
| nPatients | N0 | N1 | N2+N3 |
|---|---|---|---|
| ALL | 23 | 4 | 4 |
| subtype1 | 4 | 1 | 2 |
| subtype2 | 10 | 1 | 1 |
| subtype3 | 9 | 2 | 1 |
Figure S15. Get High-res Image Clustering Approach #2: 'mRNA cHierClus subtypes' versus Clinical Feature #7: 'PATHOLOGY.N'
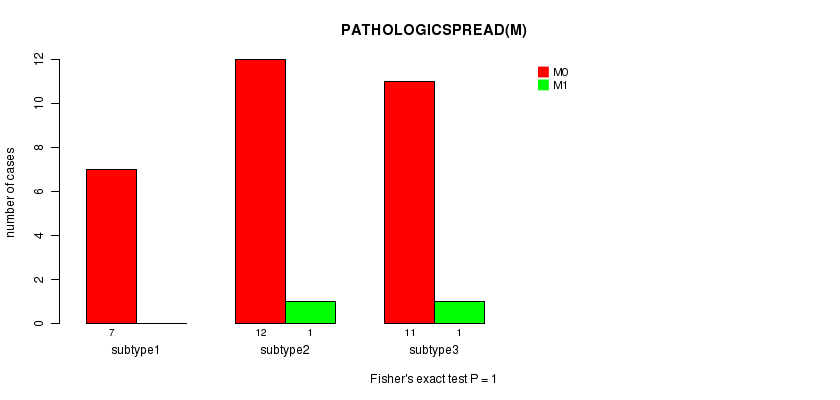
P value = 1 (Fisher's exact test)
Table S18. Clustering Approach #2: 'mRNA cHierClus subtypes' versus Clinical Feature #8: 'PATHOLOGICSPREAD(M)'
| nPatients | M0 | M1 |
|---|---|---|
| ALL | 30 | 2 |
| subtype1 | 7 | 0 |
| subtype2 | 12 | 1 |
| subtype3 | 11 | 1 |
Figure S16. Get High-res Image Clustering Approach #2: 'mRNA cHierClus subtypes' versus Clinical Feature #8: 'PATHOLOGICSPREAD(M)'
P value = 1 (Fisher's exact test)
Table S19. Clustering Approach #2: 'mRNA cHierClus subtypes' versus Clinical Feature #9: 'RADIATIONS.RADIATION.REGIMENINDICATION'
| nPatients | NO | YES |
|---|---|---|
| ALL | 31 | 1 |
| subtype1 | 7 | 0 |
| subtype2 | 12 | 1 |
| subtype3 | 12 | 0 |
Figure S17. Get High-res Image Clustering Approach #2: 'mRNA cHierClus subtypes' versus Clinical Feature #9: 'RADIATIONS.RADIATION.REGIMENINDICATION'
P value = 1 (Fisher's exact test)
Table S20. Clustering Approach #2: 'mRNA cHierClus subtypes' versus Clinical Feature #10: 'NEOADJUVANT.THERAPY'
| nPatients | NO | YES |
|---|---|---|
| ALL | 26 | 6 |
| subtype1 | 6 | 1 |
| subtype2 | 10 | 3 |
| subtype3 | 10 | 2 |
Figure S18. Get High-res Image Clustering Approach #2: 'mRNA cHierClus subtypes' versus Clinical Feature #10: 'NEOADJUVANT.THERAPY'
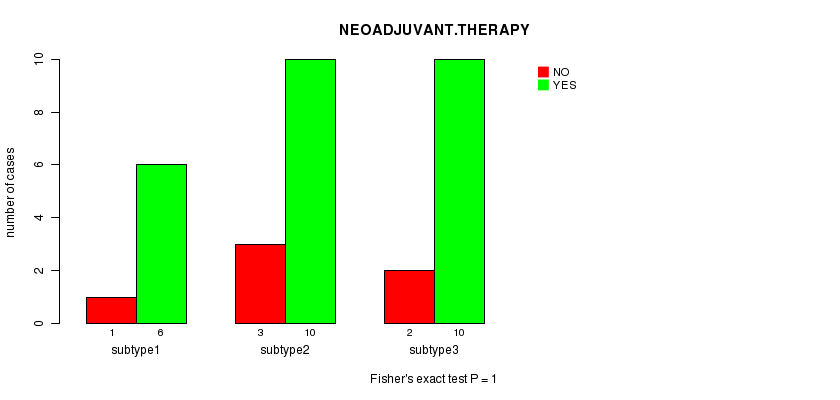
Table S21. Get Full Table Description of clustering approach #3: 'METHLYATION CNMF'
| Cluster Labels | 1 | 2 | 3 | 4 |
|---|---|---|---|---|
| Number of samples | 52 | 60 | 52 | 52 |
P value = 0.00488 (logrank test)
Table S22. Clustering Approach #3: 'METHLYATION CNMF' versus Clinical Feature #1: 'Time to Death'
| nPatients | nDeath | Duration Range (Median), Month | |
|---|---|---|---|
| ALL | 188 | 60 | 0.0 - 224.0 (11.6) |
| subtype1 | 44 | 10 | 0.1 - 224.0 (11.6) |
| subtype2 | 53 | 23 | 0.1 - 88.1 (15.0) |
| subtype3 | 45 | 11 | 0.0 - 77.9 (5.4) |
| subtype4 | 46 | 16 | 0.0 - 71.5 (12.8) |
Figure S19. Get High-res Image Clustering Approach #3: 'METHLYATION CNMF' versus Clinical Feature #1: 'Time to Death'
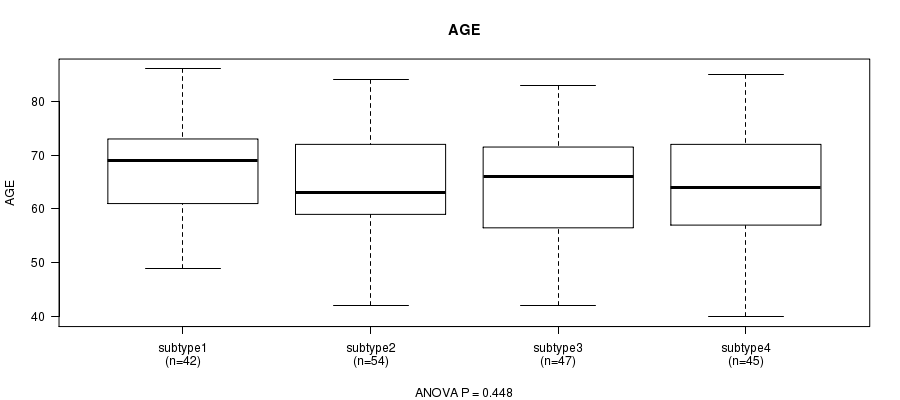
P value = 0.448 (ANOVA)
Table S23. Clustering Approach #3: 'METHLYATION CNMF' versus Clinical Feature #2: 'AGE'
| nPatients | Mean (Std.Dev) | |
|---|---|---|
| ALL | 188 | 65.3 (9.8) |
| subtype1 | 42 | 67.5 (7.8) |
| subtype2 | 54 | 64.7 (9.1) |
| subtype3 | 47 | 64.8 (10.5) |
| subtype4 | 45 | 64.5 (11.5) |
Figure S20. Get High-res Image Clustering Approach #3: 'METHLYATION CNMF' versus Clinical Feature #2: 'AGE'
P value = 0.014 (Fisher's exact test)
Table S24. Clustering Approach #3: 'METHLYATION CNMF' versus Clinical Feature #3: 'GENDER'
| nPatients | FEMALE | MALE |
|---|---|---|
| ALL | 101 | 115 |
| subtype1 | 17 | 35 |
| subtype2 | 37 | 23 |
| subtype3 | 26 | 26 |
| subtype4 | 21 | 31 |
Figure S21. Get High-res Image Clustering Approach #3: 'METHLYATION CNMF' versus Clinical Feature #3: 'GENDER'
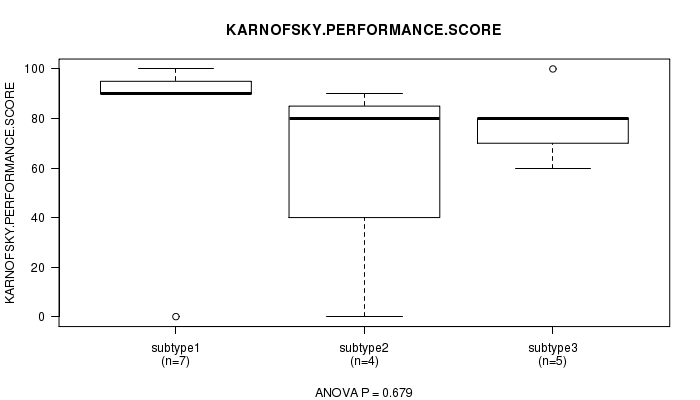
P value = 0.679 (ANOVA)
Table S25. Clustering Approach #3: 'METHLYATION CNMF' versus Clinical Feature #4: 'KARNOFSKY.PERFORMANCE.SCORE'
| nPatients | Mean (Std.Dev) | |
|---|---|---|
| ALL | 18 | 71.1 (34.3) |
| subtype1 | 7 | 80.0 (35.6) |
| subtype2 | 4 | 62.5 (41.9) |
| subtype3 | 5 | 78.0 (14.8) |
| subtype4 | 2 | 40.0 (56.6) |
Figure S22. Get High-res Image Clustering Approach #3: 'METHLYATION CNMF' versus Clinical Feature #4: 'KARNOFSKY.PERFORMANCE.SCORE'
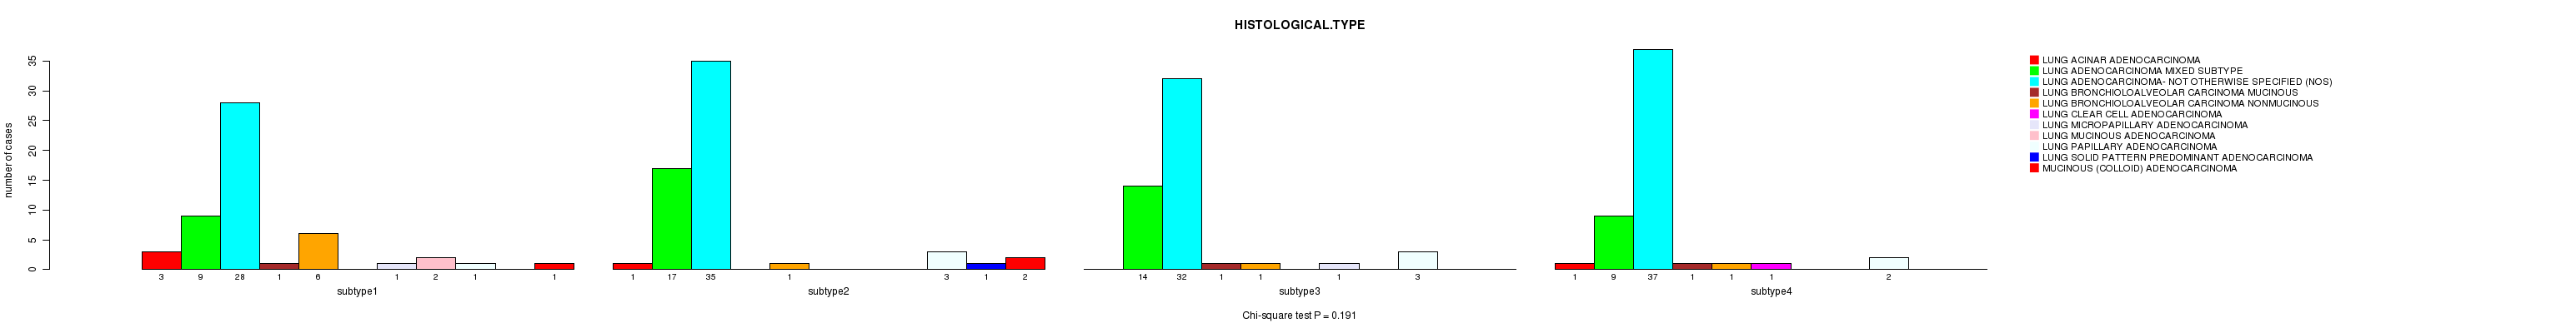
P value = 0.191 (Chi-square test)
Table S26. Clustering Approach #3: 'METHLYATION CNMF' versus Clinical Feature #5: 'HISTOLOGICAL.TYPE'
| nPatients | LUNG ACINAR ADENOCARCINOMA | LUNG ADENOCARCINOMA MIXED SUBTYPE | LUNG ADENOCARCINOMA- NOT OTHERWISE SPECIFIED (NOS) | LUNG BRONCHIOLOALVEOLAR CARCINOMA MUCINOUS | LUNG BRONCHIOLOALVEOLAR CARCINOMA NONMUCINOUS | LUNG CLEAR CELL ADENOCARCINOMA | LUNG MICROPAPILLARY ADENOCARCINOMA | LUNG MUCINOUS ADENOCARCINOMA | LUNG PAPILLARY ADENOCARCINOMA | LUNG SOLID PATTERN PREDOMINANT ADENOCARCINOMA | MUCINOUS (COLLOID) ADENOCARCINOMA |
|---|---|---|---|---|---|---|---|---|---|---|---|
| ALL | 5 | 49 | 132 | 3 | 9 | 1 | 2 | 2 | 9 | 1 | 3 |
| subtype1 | 3 | 9 | 28 | 1 | 6 | 0 | 1 | 2 | 1 | 0 | 1 |
| subtype2 | 1 | 17 | 35 | 0 | 1 | 0 | 0 | 0 | 3 | 1 | 2 |
| subtype3 | 0 | 14 | 32 | 1 | 1 | 0 | 1 | 0 | 3 | 0 | 0 |
| subtype4 | 1 | 9 | 37 | 1 | 1 | 1 | 0 | 0 | 2 | 0 | 0 |
Figure S23. Get High-res Image Clustering Approach #3: 'METHLYATION CNMF' versus Clinical Feature #5: 'HISTOLOGICAL.TYPE'
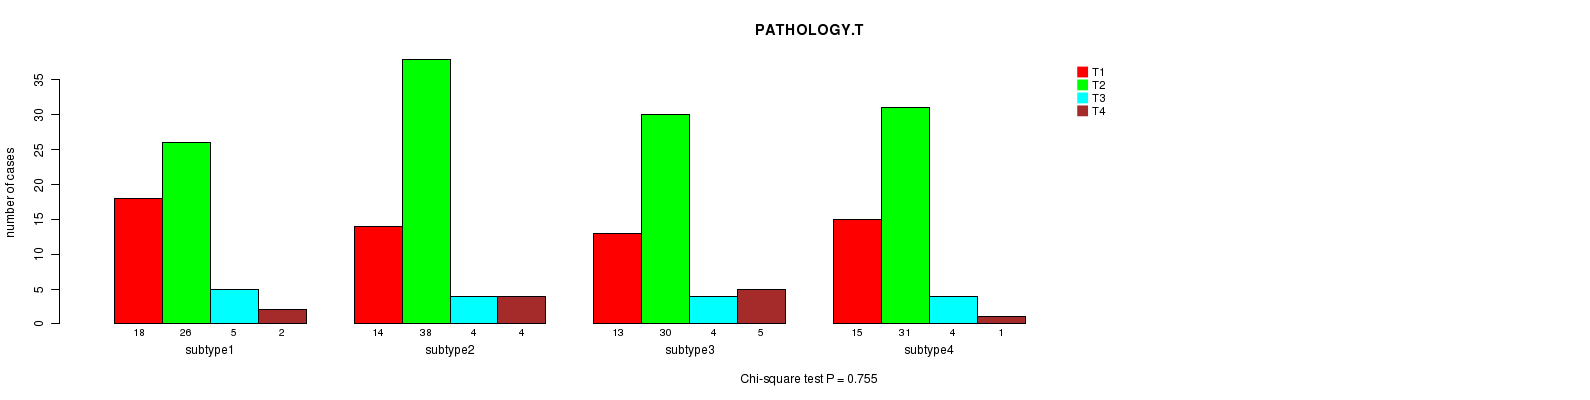
P value = 0.755 (Chi-square test)
Table S27. Clustering Approach #3: 'METHLYATION CNMF' versus Clinical Feature #6: 'PATHOLOGY.T'
| nPatients | T1 | T2 | T3 | T4 |
|---|---|---|---|---|
| ALL | 60 | 125 | 17 | 12 |
| subtype1 | 18 | 26 | 5 | 2 |
| subtype2 | 14 | 38 | 4 | 4 |
| subtype3 | 13 | 30 | 4 | 5 |
| subtype4 | 15 | 31 | 4 | 1 |
Figure S24. Get High-res Image Clustering Approach #3: 'METHLYATION CNMF' versus Clinical Feature #6: 'PATHOLOGY.T'
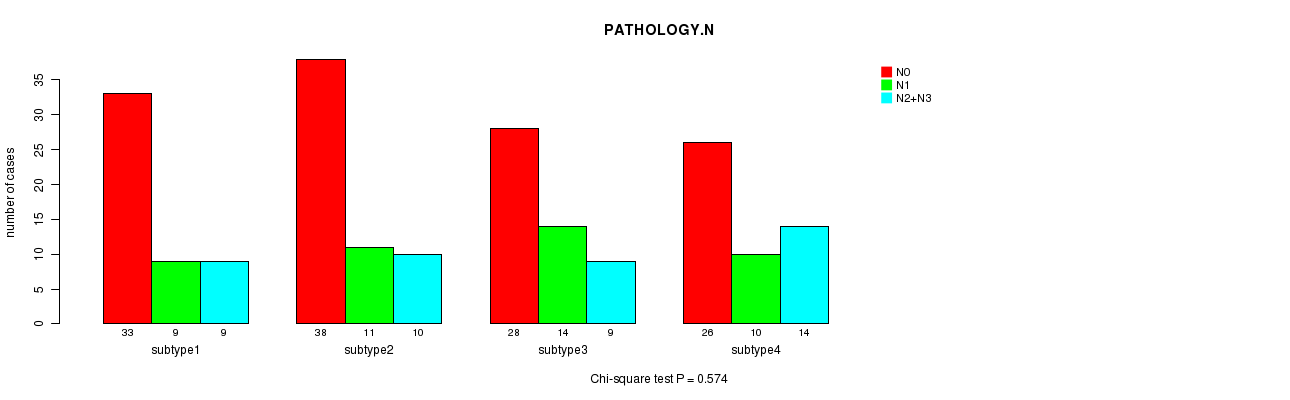
P value = 0.574 (Chi-square test)
Table S28. Clustering Approach #3: 'METHLYATION CNMF' versus Clinical Feature #7: 'PATHOLOGY.N'
| nPatients | N0 | N1 | N2+N3 |
|---|---|---|---|
| ALL | 125 | 44 | 42 |
| subtype1 | 33 | 9 | 9 |
| subtype2 | 38 | 11 | 10 |
| subtype3 | 28 | 14 | 9 |
| subtype4 | 26 | 10 | 14 |
Figure S25. Get High-res Image Clustering Approach #3: 'METHLYATION CNMF' versus Clinical Feature #7: 'PATHOLOGY.N'
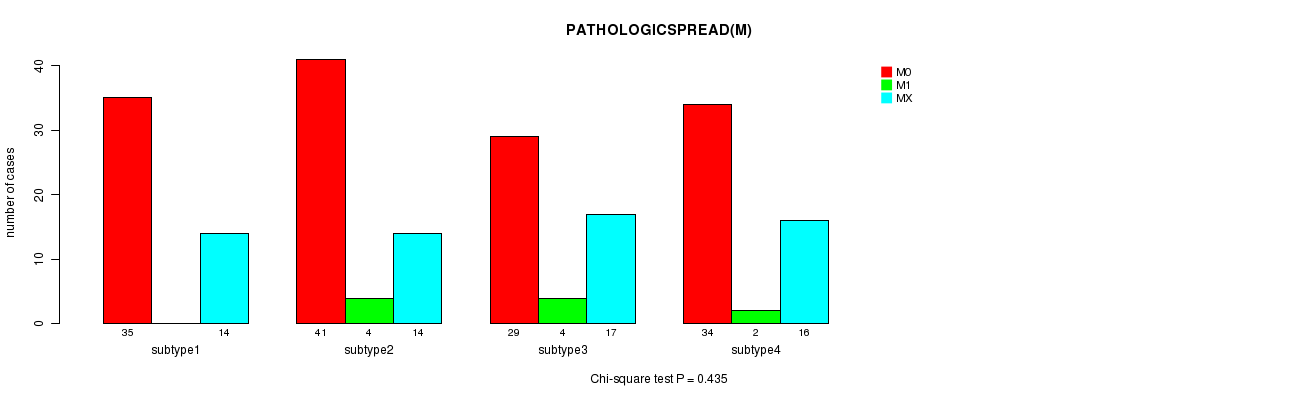
P value = 0.435 (Chi-square test)
Table S29. Clustering Approach #3: 'METHLYATION CNMF' versus Clinical Feature #8: 'PATHOLOGICSPREAD(M)'
| nPatients | M0 | M1 | MX |
|---|---|---|---|
| ALL | 139 | 10 | 61 |
| subtype1 | 35 | 0 | 14 |
| subtype2 | 41 | 4 | 14 |
| subtype3 | 29 | 4 | 17 |
| subtype4 | 34 | 2 | 16 |
Figure S26. Get High-res Image Clustering Approach #3: 'METHLYATION CNMF' versus Clinical Feature #8: 'PATHOLOGICSPREAD(M)'
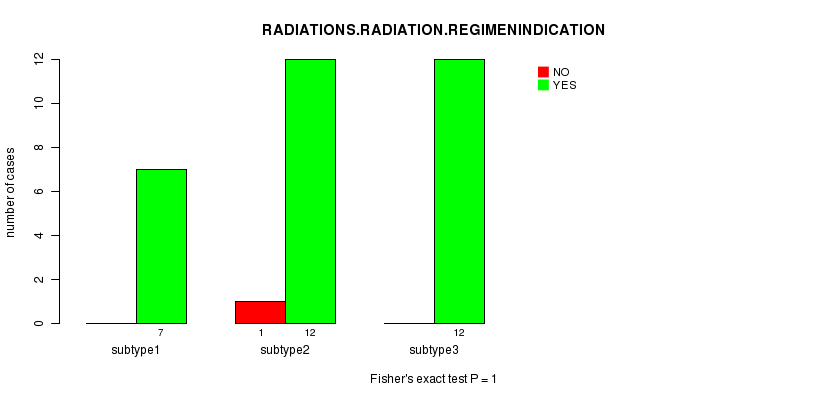
P value = 0.0255 (Fisher's exact test)
Table S30. Clustering Approach #3: 'METHLYATION CNMF' versus Clinical Feature #9: 'RADIATIONS.RADIATION.REGIMENINDICATION'
| nPatients | NO | YES |
|---|---|---|
| ALL | 207 | 9 |
| subtype1 | 52 | 0 |
| subtype2 | 58 | 2 |
| subtype3 | 51 | 1 |
| subtype4 | 46 | 6 |
Figure S27. Get High-res Image Clustering Approach #3: 'METHLYATION CNMF' versus Clinical Feature #9: 'RADIATIONS.RADIATION.REGIMENINDICATION'
P value = 0.296 (Fisher's exact test)
Table S31. Clustering Approach #3: 'METHLYATION CNMF' versus Clinical Feature #10: 'NEOADJUVANT.THERAPY'
| nPatients | NO | YES |
|---|---|---|
| ALL | 185 | 31 |
| subtype1 | 41 | 11 |
| subtype2 | 55 | 5 |
| subtype3 | 45 | 7 |
| subtype4 | 44 | 8 |
Figure S28. Get High-res Image Clustering Approach #3: 'METHLYATION CNMF' versus Clinical Feature #10: 'NEOADJUVANT.THERAPY'
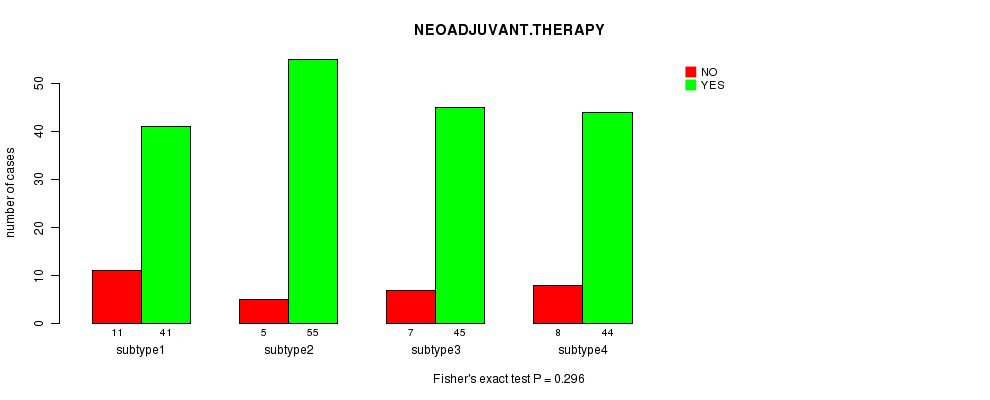
Table S32. Get Full Table Description of clustering approach #4: 'RNAseq CNMF subtypes'
| Cluster Labels | 1 | 2 | 3 |
|---|---|---|---|
| Number of samples | 88 | 68 | 84 |
P value = 0.00509 (logrank test)
Table S33. Clustering Approach #4: 'RNAseq CNMF subtypes' versus Clinical Feature #1: 'Time to Death'
| nPatients | nDeath | Duration Range (Median), Month | |
|---|---|---|---|
| ALL | 214 | 75 | 0.0 - 224.0 (15.0) |
| subtype1 | 77 | 19 | 0.1 - 224.0 (13.9) |
| subtype2 | 60 | 25 | 0.0 - 77.9 (11.0) |
| subtype3 | 77 | 31 | 0.0 - 88.1 (18.3) |
Figure S29. Get High-res Image Clustering Approach #4: 'RNAseq CNMF subtypes' versus Clinical Feature #1: 'Time to Death'
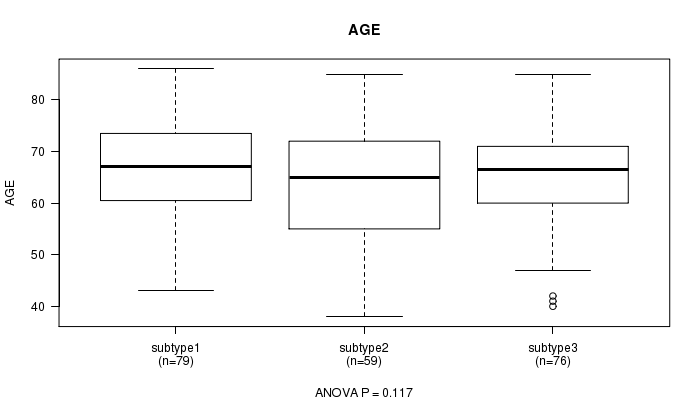
P value = 0.117 (ANOVA)
Table S34. Clustering Approach #4: 'RNAseq CNMF subtypes' versus Clinical Feature #2: 'AGE'
| nPatients | Mean (Std.Dev) | |
|---|---|---|
| ALL | 214 | 65.5 (9.7) |
| subtype1 | 79 | 67.1 (8.5) |
| subtype2 | 59 | 63.7 (11.3) |
| subtype3 | 76 | 65.1 (9.5) |
Figure S30. Get High-res Image Clustering Approach #4: 'RNAseq CNMF subtypes' versus Clinical Feature #2: 'AGE'
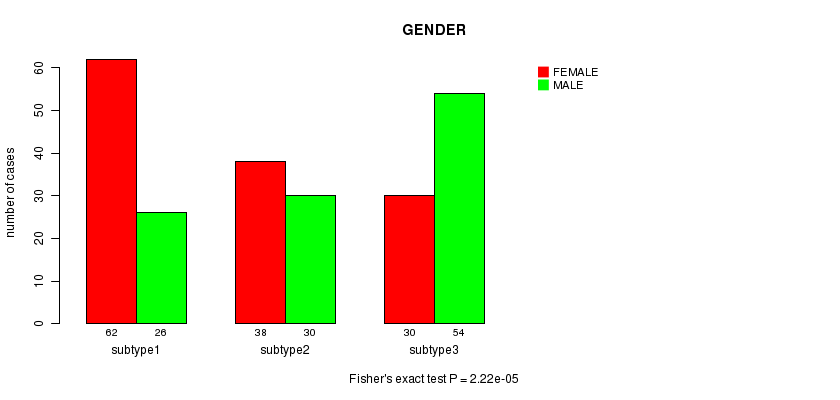
P value = 2.22e-05 (Fisher's exact test)
Table S35. Clustering Approach #4: 'RNAseq CNMF subtypes' versus Clinical Feature #3: 'GENDER'
| nPatients | FEMALE | MALE |
|---|---|---|
| ALL | 110 | 130 |
| subtype1 | 26 | 62 |
| subtype2 | 30 | 38 |
| subtype3 | 54 | 30 |
Figure S31. Get High-res Image Clustering Approach #4: 'RNAseq CNMF subtypes' versus Clinical Feature #3: 'GENDER'
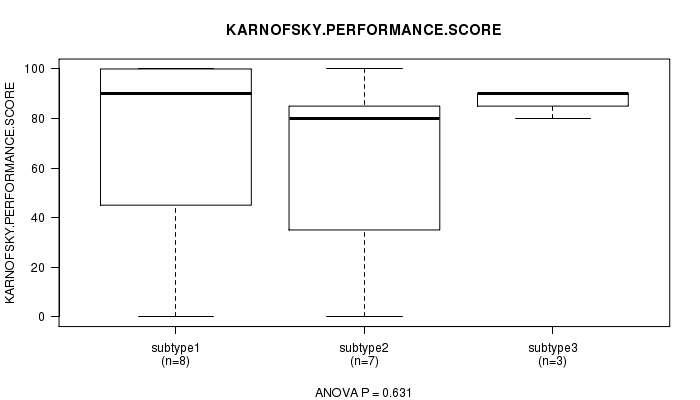
P value = 0.631 (ANOVA)
Table S36. Clustering Approach #4: 'RNAseq CNMF subtypes' versus Clinical Feature #4: 'KARNOFSKY.PERFORMANCE.SCORE'
| nPatients | Mean (Std.Dev) | |
|---|---|---|
| ALL | 18 | 69.4 (39.0) |
| subtype1 | 8 | 71.2 (44.2) |
| subtype2 | 7 | 60.0 (42.0) |
| subtype3 | 3 | 86.7 (5.8) |
Figure S32. Get High-res Image Clustering Approach #4: 'RNAseq CNMF subtypes' versus Clinical Feature #4: 'KARNOFSKY.PERFORMANCE.SCORE'
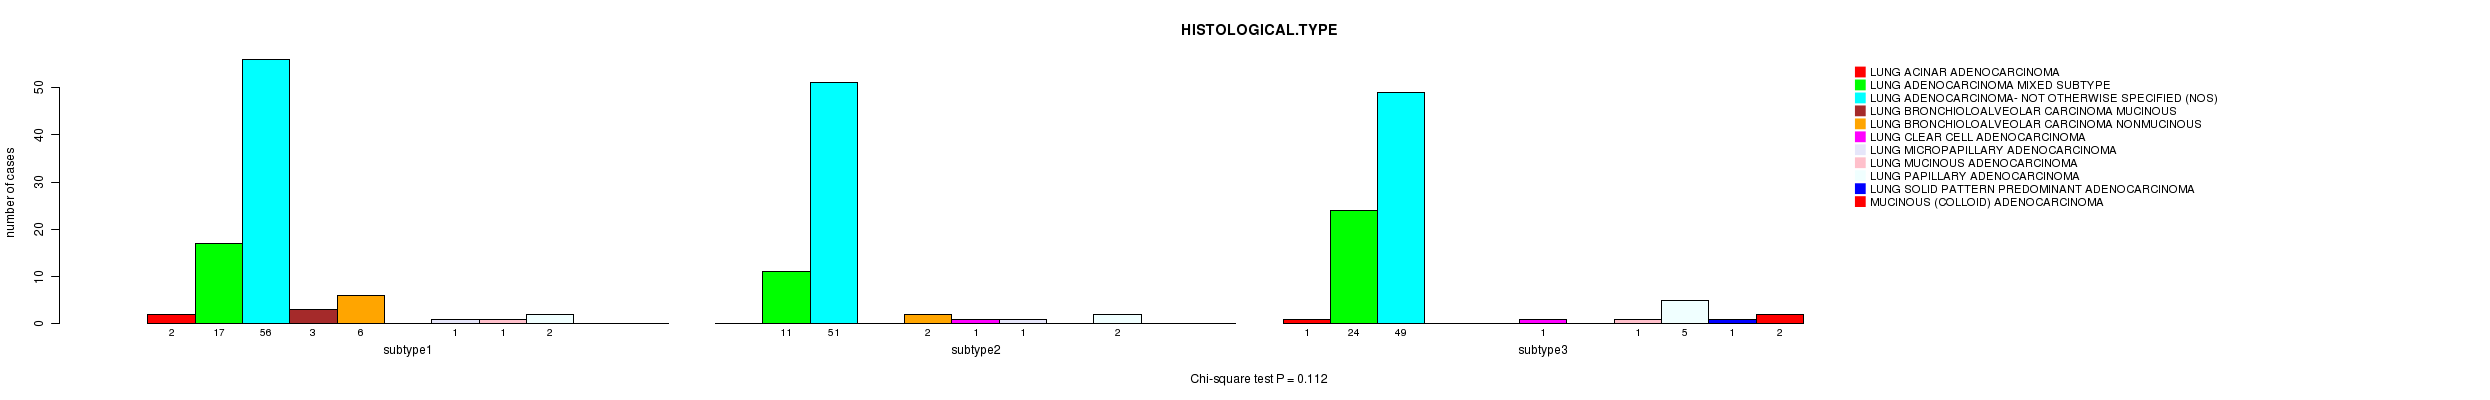
P value = 0.112 (Chi-square test)
Table S37. Clustering Approach #4: 'RNAseq CNMF subtypes' versus Clinical Feature #5: 'HISTOLOGICAL.TYPE'
| nPatients | LUNG ACINAR ADENOCARCINOMA | LUNG ADENOCARCINOMA MIXED SUBTYPE | LUNG ADENOCARCINOMA- NOT OTHERWISE SPECIFIED (NOS) | LUNG BRONCHIOLOALVEOLAR CARCINOMA MUCINOUS | LUNG BRONCHIOLOALVEOLAR CARCINOMA NONMUCINOUS | LUNG CLEAR CELL ADENOCARCINOMA | LUNG MICROPAPILLARY ADENOCARCINOMA | LUNG MUCINOUS ADENOCARCINOMA | LUNG PAPILLARY ADENOCARCINOMA | LUNG SOLID PATTERN PREDOMINANT ADENOCARCINOMA | MUCINOUS (COLLOID) ADENOCARCINOMA |
|---|---|---|---|---|---|---|---|---|---|---|---|
| ALL | 3 | 52 | 156 | 3 | 8 | 2 | 2 | 2 | 9 | 1 | 2 |
| subtype1 | 2 | 17 | 56 | 3 | 6 | 0 | 1 | 1 | 2 | 0 | 0 |
| subtype2 | 0 | 11 | 51 | 0 | 2 | 1 | 1 | 0 | 2 | 0 | 0 |
| subtype3 | 1 | 24 | 49 | 0 | 0 | 1 | 0 | 1 | 5 | 1 | 2 |
Figure S33. Get High-res Image Clustering Approach #4: 'RNAseq CNMF subtypes' versus Clinical Feature #5: 'HISTOLOGICAL.TYPE'
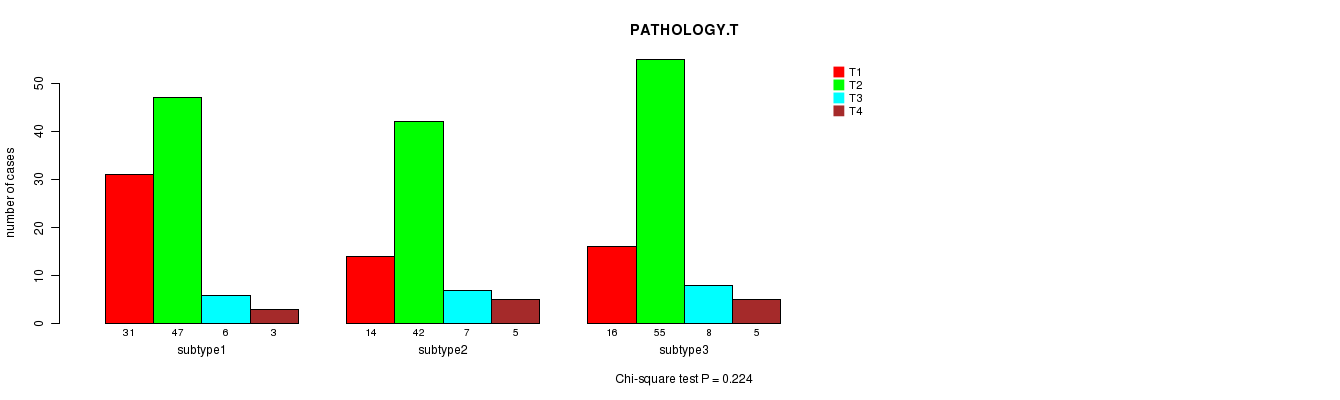
P value = 0.224 (Chi-square test)
Table S38. Clustering Approach #4: 'RNAseq CNMF subtypes' versus Clinical Feature #6: 'PATHOLOGY.T'
| nPatients | T1 | T2 | T3 | T4 |
|---|---|---|---|---|
| ALL | 61 | 144 | 21 | 13 |
| subtype1 | 31 | 47 | 6 | 3 |
| subtype2 | 14 | 42 | 7 | 5 |
| subtype3 | 16 | 55 | 8 | 5 |
Figure S34. Get High-res Image Clustering Approach #4: 'RNAseq CNMF subtypes' versus Clinical Feature #6: 'PATHOLOGY.T'
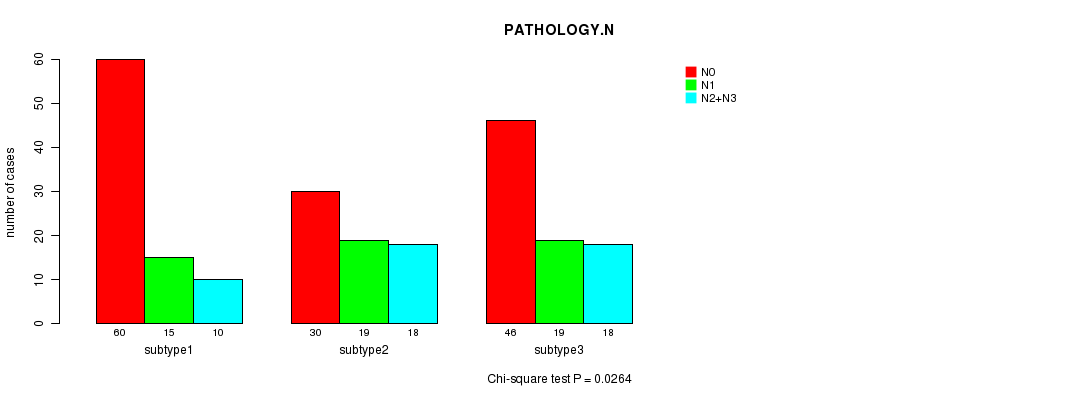
P value = 0.0264 (Chi-square test)
Table S39. Clustering Approach #4: 'RNAseq CNMF subtypes' versus Clinical Feature #7: 'PATHOLOGY.N'
| nPatients | N0 | N1 | N2+N3 |
|---|---|---|---|
| ALL | 136 | 53 | 46 |
| subtype1 | 60 | 15 | 10 |
| subtype2 | 30 | 19 | 18 |
| subtype3 | 46 | 19 | 18 |
Figure S35. Get High-res Image Clustering Approach #4: 'RNAseq CNMF subtypes' versus Clinical Feature #7: 'PATHOLOGY.N'
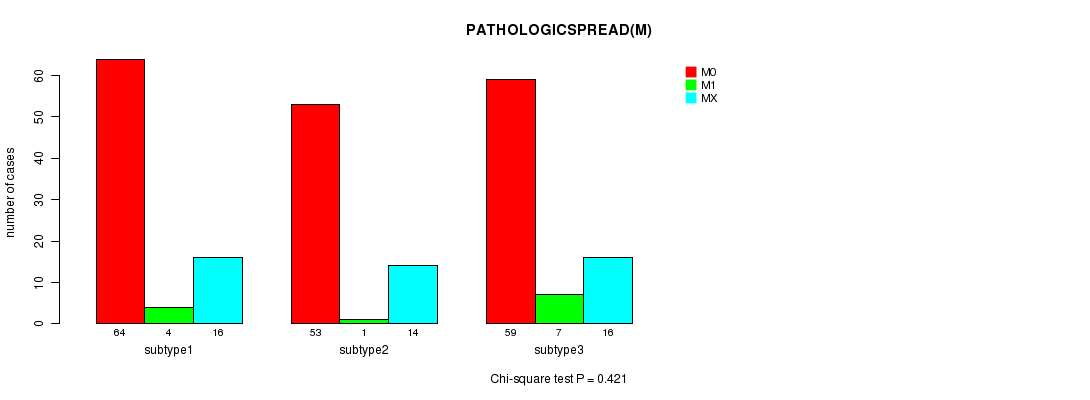
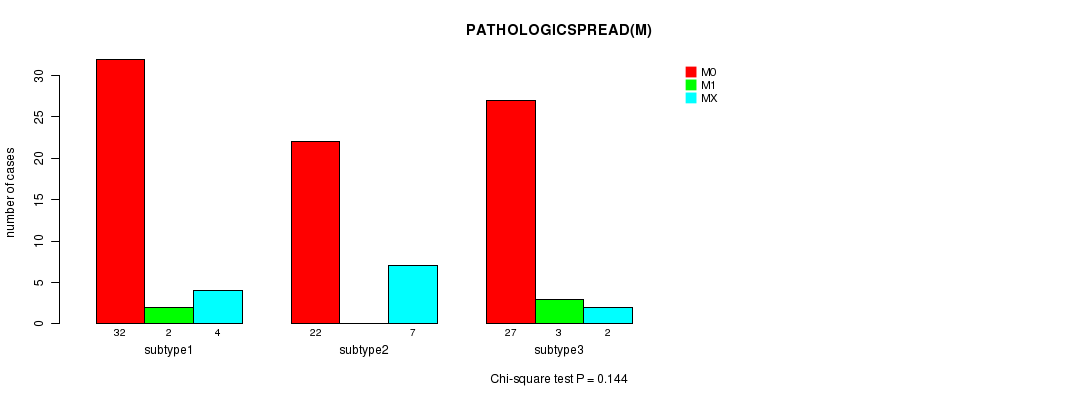
P value = 0.421 (Chi-square test)
Table S40. Clustering Approach #4: 'RNAseq CNMF subtypes' versus Clinical Feature #8: 'PATHOLOGICSPREAD(M)'
| nPatients | M0 | M1 | MX |
|---|---|---|---|
| ALL | 176 | 12 | 46 |
| subtype1 | 64 | 4 | 16 |
| subtype2 | 53 | 1 | 14 |
| subtype3 | 59 | 7 | 16 |
Figure S36. Get High-res Image Clustering Approach #4: 'RNAseq CNMF subtypes' versus Clinical Feature #8: 'PATHOLOGICSPREAD(M)'
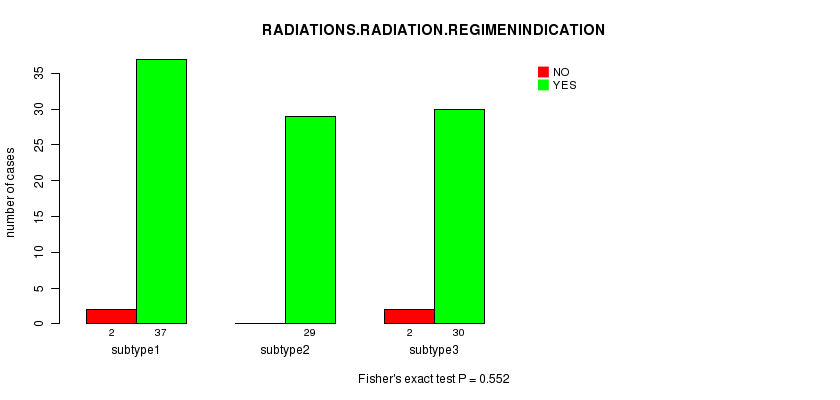
P value = 1 (Fisher's exact test)
Table S41. Clustering Approach #4: 'RNAseq CNMF subtypes' versus Clinical Feature #9: 'RADIATIONS.RADIATION.REGIMENINDICATION'
| nPatients | NO | YES |
|---|---|---|
| ALL | 229 | 11 |
| subtype1 | 84 | 4 |
| subtype2 | 65 | 3 |
| subtype3 | 80 | 4 |
Figure S37. Get High-res Image Clustering Approach #4: 'RNAseq CNMF subtypes' versus Clinical Feature #9: 'RADIATIONS.RADIATION.REGIMENINDICATION'
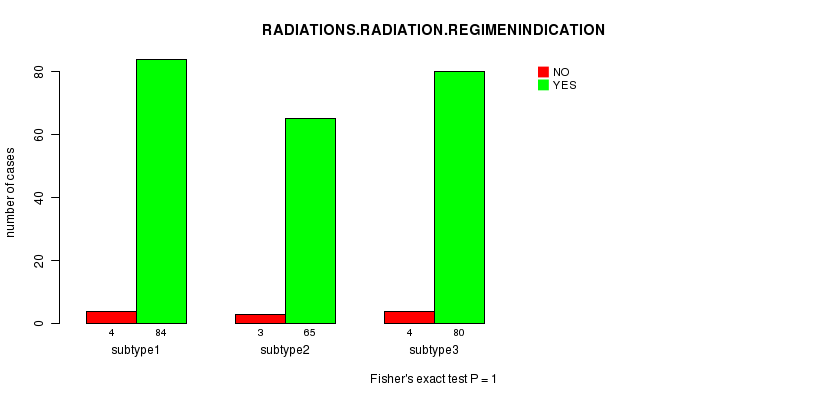
P value = 0.576 (Fisher's exact test)
Table S42. Clustering Approach #4: 'RNAseq CNMF subtypes' versus Clinical Feature #10: 'NEOADJUVANT.THERAPY'
| nPatients | NO | YES |
|---|---|---|
| ALL | 203 | 37 |
| subtype1 | 75 | 13 |
| subtype2 | 55 | 13 |
| subtype3 | 73 | 11 |
Figure S38. Get High-res Image Clustering Approach #4: 'RNAseq CNMF subtypes' versus Clinical Feature #10: 'NEOADJUVANT.THERAPY'
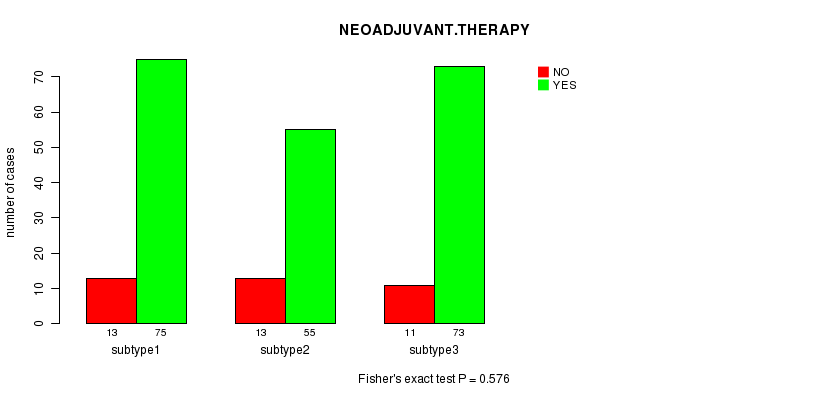
Table S43. Get Full Table Description of clustering approach #5: 'RNAseq cHierClus subtypes'
| Cluster Labels | 1 | 2 | 3 | 4 | 5 | 6 |
|---|---|---|---|---|---|---|
| Number of samples | 25 | 12 | 49 | 23 | 56 | 75 |
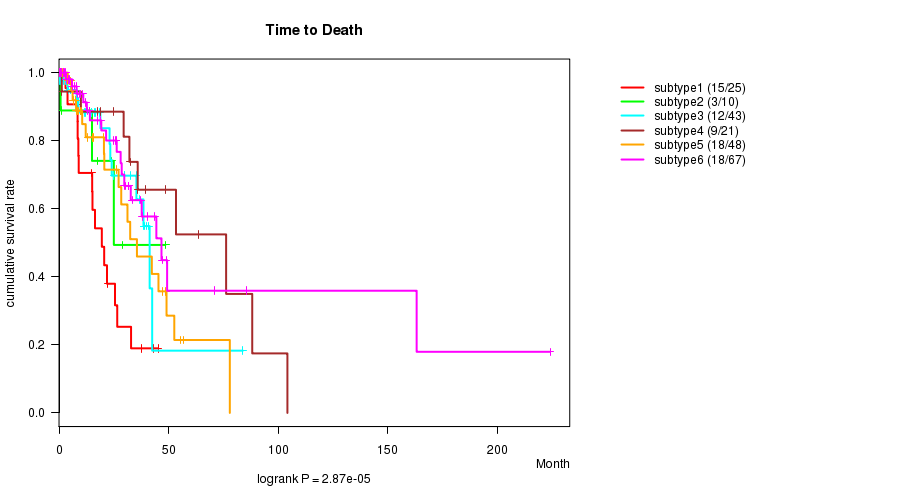
P value = 2.87e-05 (logrank test)
Table S44. Clustering Approach #5: 'RNAseq cHierClus subtypes' versus Clinical Feature #1: 'Time to Death'
| nPatients | nDeath | Duration Range (Median), Month | |
|---|---|---|---|
| ALL | 214 | 75 | 0.0 - 224.0 (15.0) |
| subtype1 | 25 | 15 | 0.1 - 45.2 (15.1) |
| subtype2 | 10 | 3 | 0.0 - 48.5 (16.2) |
| subtype3 | 43 | 12 | 0.1 - 83.8 (16.4) |
| subtype4 | 21 | 9 | 0.5 - 104.2 (32.1) |
| subtype5 | 48 | 18 | 0.0 - 77.9 (10.0) |
| subtype6 | 67 | 18 | 0.1 - 224.0 (13.7) |
Figure S39. Get High-res Image Clustering Approach #5: 'RNAseq cHierClus subtypes' versus Clinical Feature #1: 'Time to Death'
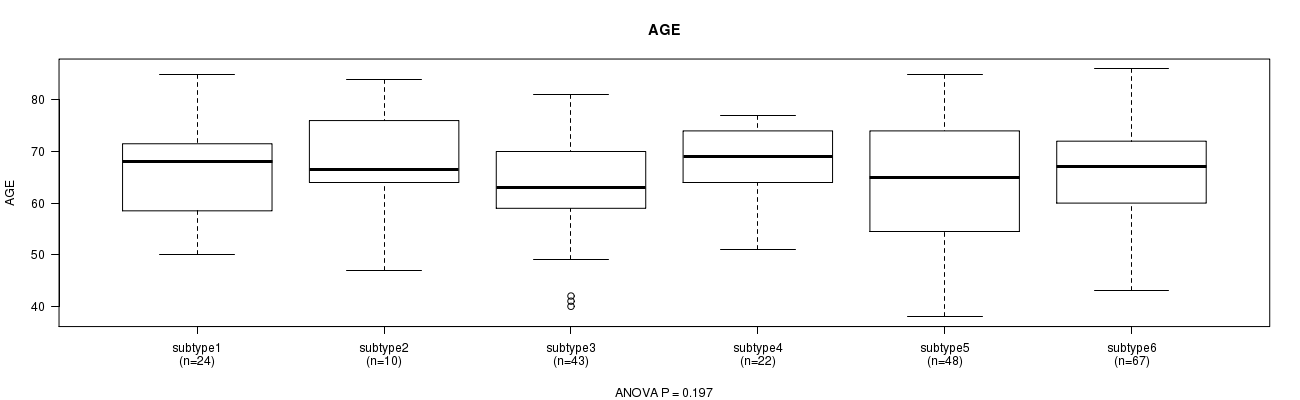
P value = 0.197 (ANOVA)
Table S45. Clustering Approach #5: 'RNAseq cHierClus subtypes' versus Clinical Feature #2: 'AGE'
| nPatients | Mean (Std.Dev) | |
|---|---|---|
| ALL | 214 | 65.5 (9.7) |
| subtype1 | 24 | 66.6 (9.3) |
| subtype2 | 10 | 68.1 (10.8) |
| subtype3 | 43 | 62.7 (9.6) |
| subtype4 | 22 | 67.9 (7.1) |
| subtype5 | 48 | 64.2 (11.7) |
| subtype6 | 67 | 66.5 (8.8) |
Figure S40. Get High-res Image Clustering Approach #5: 'RNAseq cHierClus subtypes' versus Clinical Feature #2: 'AGE'
P value = 6.45e-06 (Chi-square test)
Table S46. Clustering Approach #5: 'RNAseq cHierClus subtypes' versus Clinical Feature #3: 'GENDER'
| nPatients | FEMALE | MALE |
|---|---|---|
| ALL | 110 | 130 |
| subtype1 | 15 | 10 |
| subtype2 | 6 | 6 |
| subtype3 | 31 | 18 |
| subtype4 | 17 | 6 |
| subtype5 | 24 | 32 |
| subtype6 | 17 | 58 |
Figure S41. Get High-res Image Clustering Approach #5: 'RNAseq cHierClus subtypes' versus Clinical Feature #3: 'GENDER'
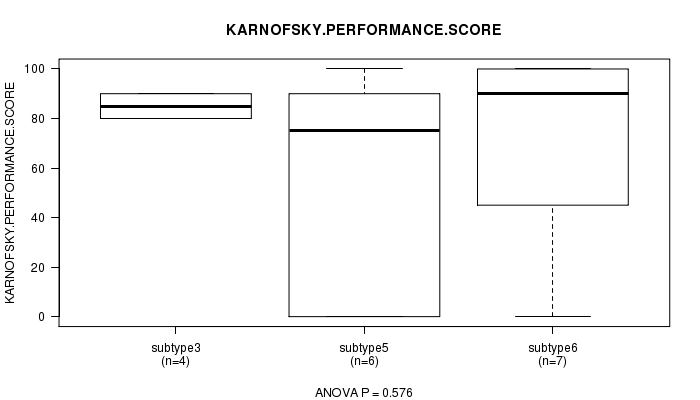
P value = 0.576 (ANOVA)
Table S47. Clustering Approach #5: 'RNAseq cHierClus subtypes' versus Clinical Feature #4: 'KARNOFSKY.PERFORMANCE.SCORE'
| nPatients | Mean (Std.Dev) | |
|---|---|---|
| ALL | 18 | 69.4 (39.0) |
| subtype3 | 4 | 85.0 (5.8) |
| subtype4 | 1 | 90.0 (NA) |
| subtype5 | 6 | 56.7 (45.0) |
| subtype6 | 7 | 68.6 (47.1) |
Figure S42. Get High-res Image Clustering Approach #5: 'RNAseq cHierClus subtypes' versus Clinical Feature #4: 'KARNOFSKY.PERFORMANCE.SCORE'
P value = 0.000331 (Chi-square test)
Table S48. Clustering Approach #5: 'RNAseq cHierClus subtypes' versus Clinical Feature #5: 'HISTOLOGICAL.TYPE'
| nPatients | LUNG ACINAR ADENOCARCINOMA | LUNG ADENOCARCINOMA MIXED SUBTYPE | LUNG ADENOCARCINOMA- NOT OTHERWISE SPECIFIED (NOS) | LUNG BRONCHIOLOALVEOLAR CARCINOMA MUCINOUS | LUNG BRONCHIOLOALVEOLAR CARCINOMA NONMUCINOUS | LUNG CLEAR CELL ADENOCARCINOMA | LUNG MICROPAPILLARY ADENOCARCINOMA | LUNG MUCINOUS ADENOCARCINOMA | LUNG PAPILLARY ADENOCARCINOMA | LUNG SOLID PATTERN PREDOMINANT ADENOCARCINOMA | MUCINOUS (COLLOID) ADENOCARCINOMA |
|---|---|---|---|---|---|---|---|---|---|---|---|
| ALL | 3 | 52 | 156 | 3 | 8 | 2 | 2 | 2 | 9 | 1 | 2 |
| subtype1 | 0 | 10 | 11 | 0 | 0 | 0 | 0 | 0 | 2 | 0 | 2 |
| subtype2 | 0 | 3 | 6 | 2 | 0 | 0 | 0 | 1 | 0 | 0 | 0 |
| subtype3 | 1 | 8 | 36 | 0 | 1 | 1 | 0 | 0 | 1 | 1 | 0 |
| subtype4 | 0 | 10 | 11 | 0 | 0 | 0 | 0 | 0 | 2 | 0 | 0 |
| subtype5 | 0 | 9 | 41 | 0 | 1 | 1 | 1 | 0 | 3 | 0 | 0 |
| subtype6 | 2 | 12 | 51 | 1 | 6 | 0 | 1 | 1 | 1 | 0 | 0 |
Figure S43. Get High-res Image Clustering Approach #5: 'RNAseq cHierClus subtypes' versus Clinical Feature #5: 'HISTOLOGICAL.TYPE'

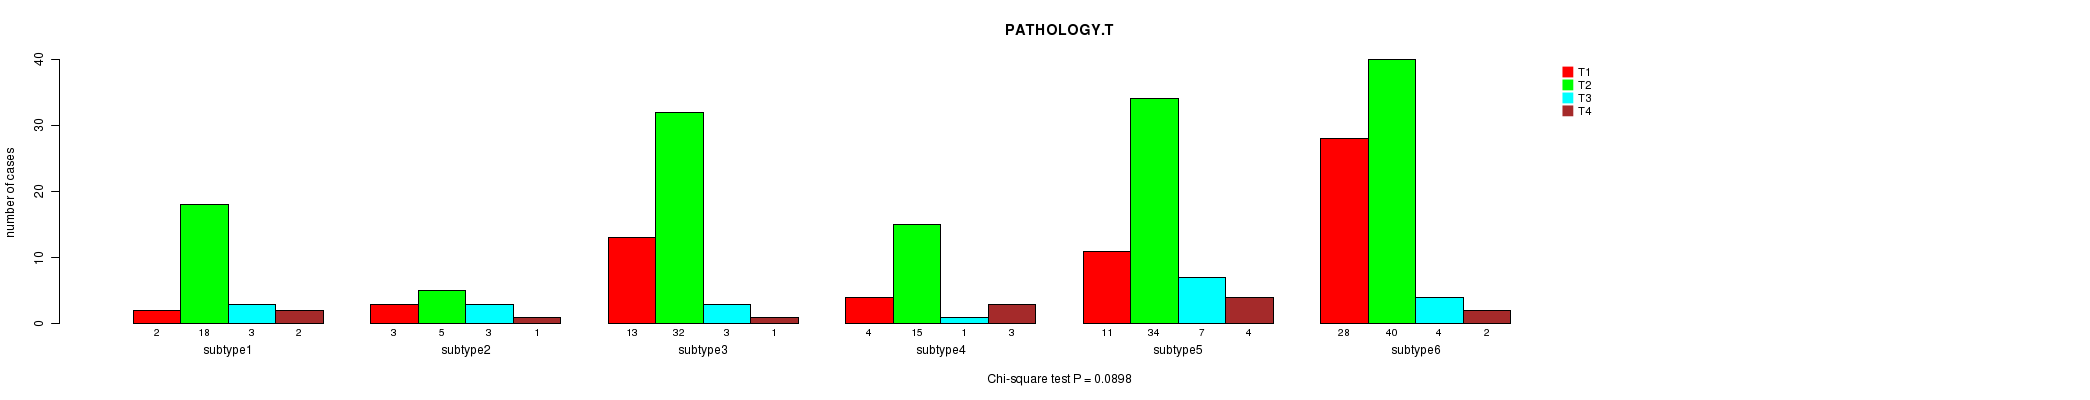
P value = 0.0898 (Chi-square test)
Table S49. Clustering Approach #5: 'RNAseq cHierClus subtypes' versus Clinical Feature #6: 'PATHOLOGY.T'
| nPatients | T1 | T2 | T3 | T4 |
|---|---|---|---|---|
| ALL | 61 | 144 | 21 | 13 |
| subtype1 | 2 | 18 | 3 | 2 |
| subtype2 | 3 | 5 | 3 | 1 |
| subtype3 | 13 | 32 | 3 | 1 |
| subtype4 | 4 | 15 | 1 | 3 |
| subtype5 | 11 | 34 | 7 | 4 |
| subtype6 | 28 | 40 | 4 | 2 |
Figure S44. Get High-res Image Clustering Approach #5: 'RNAseq cHierClus subtypes' versus Clinical Feature #6: 'PATHOLOGY.T'
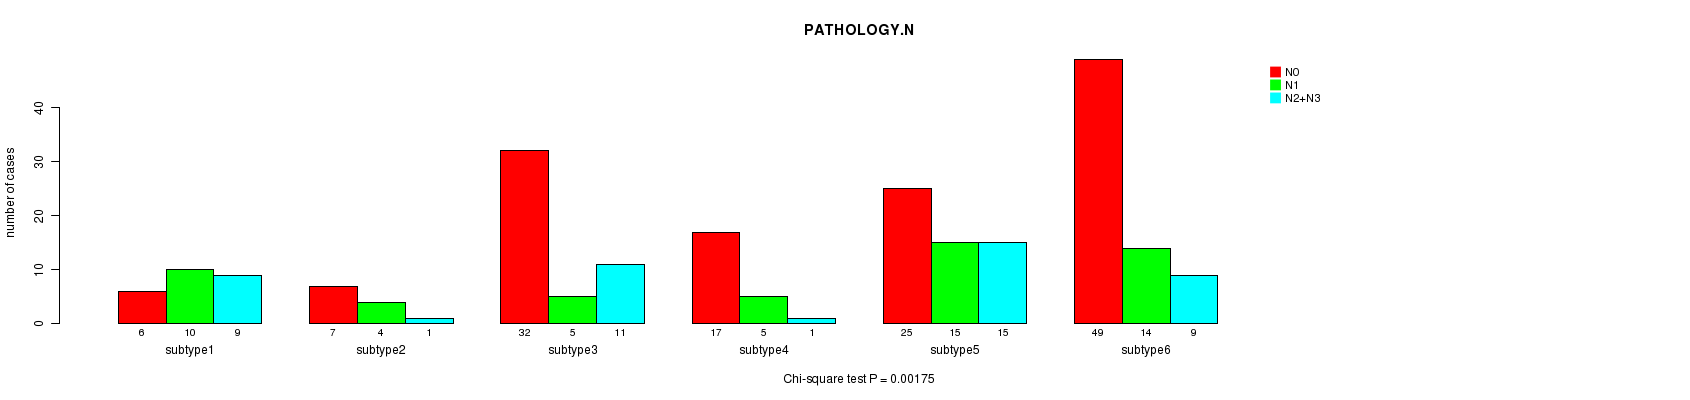
P value = 0.00175 (Chi-square test)
Table S50. Clustering Approach #5: 'RNAseq cHierClus subtypes' versus Clinical Feature #7: 'PATHOLOGY.N'
| nPatients | N0 | N1 | N2+N3 |
|---|---|---|---|
| ALL | 136 | 53 | 46 |
| subtype1 | 6 | 10 | 9 |
| subtype2 | 7 | 4 | 1 |
| subtype3 | 32 | 5 | 11 |
| subtype4 | 17 | 5 | 1 |
| subtype5 | 25 | 15 | 15 |
| subtype6 | 49 | 14 | 9 |
Figure S45. Get High-res Image Clustering Approach #5: 'RNAseq cHierClus subtypes' versus Clinical Feature #7: 'PATHOLOGY.N'
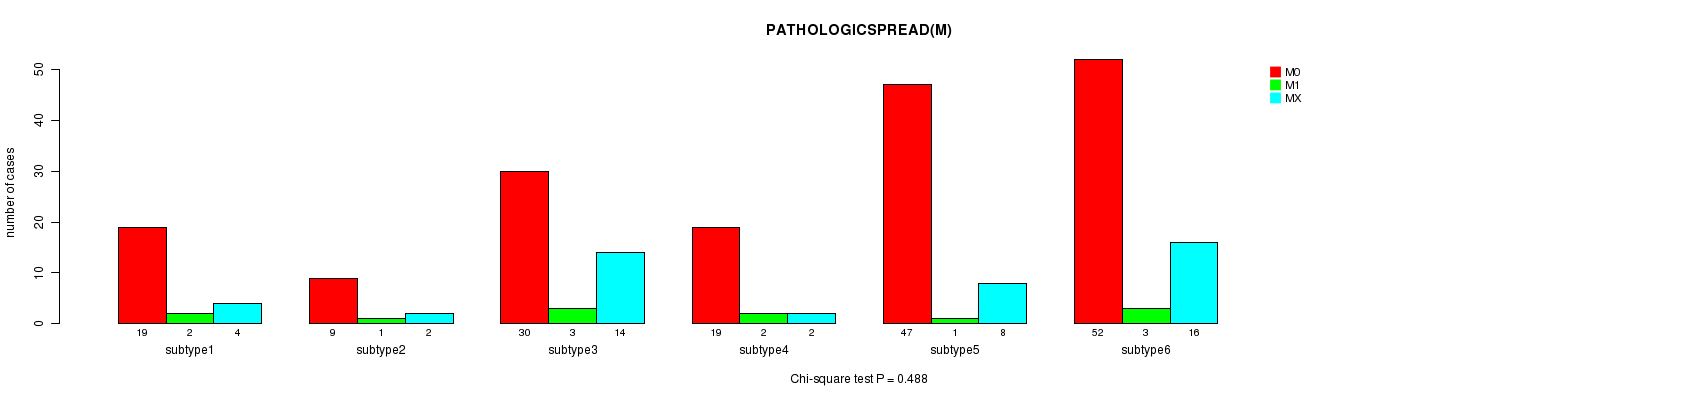
P value = 0.488 (Chi-square test)
Table S51. Clustering Approach #5: 'RNAseq cHierClus subtypes' versus Clinical Feature #8: 'PATHOLOGICSPREAD(M)'
| nPatients | M0 | M1 | MX |
|---|---|---|---|
| ALL | 176 | 12 | 46 |
| subtype1 | 19 | 2 | 4 |
| subtype2 | 9 | 1 | 2 |
| subtype3 | 30 | 3 | 14 |
| subtype4 | 19 | 2 | 2 |
| subtype5 | 47 | 1 | 8 |
| subtype6 | 52 | 3 | 16 |
Figure S46. Get High-res Image Clustering Approach #5: 'RNAseq cHierClus subtypes' versus Clinical Feature #8: 'PATHOLOGICSPREAD(M)'
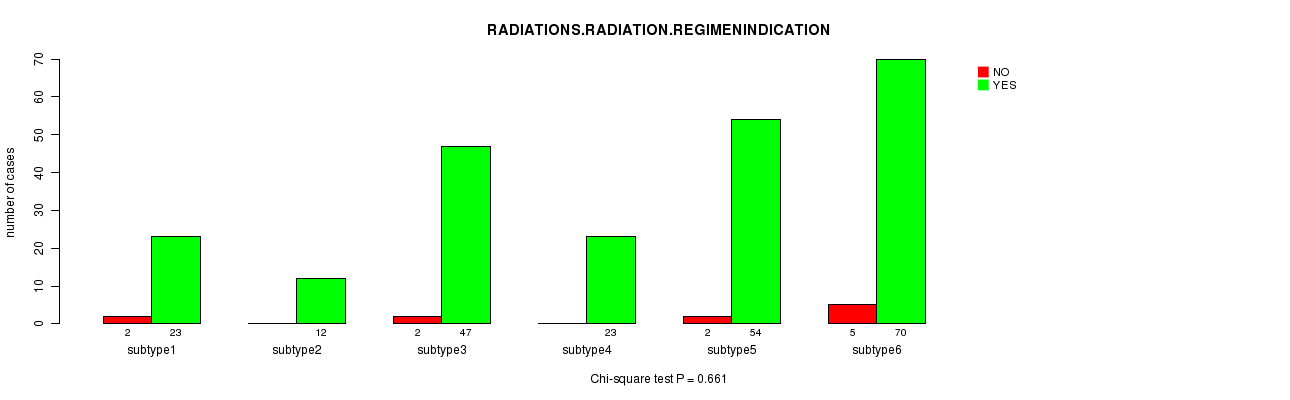
P value = 0.661 (Chi-square test)
Table S52. Clustering Approach #5: 'RNAseq cHierClus subtypes' versus Clinical Feature #9: 'RADIATIONS.RADIATION.REGIMENINDICATION'
| nPatients | NO | YES |
|---|---|---|
| ALL | 229 | 11 |
| subtype1 | 23 | 2 |
| subtype2 | 12 | 0 |
| subtype3 | 47 | 2 |
| subtype4 | 23 | 0 |
| subtype5 | 54 | 2 |
| subtype6 | 70 | 5 |
Figure S47. Get High-res Image Clustering Approach #5: 'RNAseq cHierClus subtypes' versus Clinical Feature #9: 'RADIATIONS.RADIATION.REGIMENINDICATION'
P value = 0.166 (Chi-square test)
Table S53. Clustering Approach #5: 'RNAseq cHierClus subtypes' versus Clinical Feature #10: 'NEOADJUVANT.THERAPY'
| nPatients | NO | YES |
|---|---|---|
| ALL | 203 | 37 |
| subtype1 | 21 | 4 |
| subtype2 | 9 | 3 |
| subtype3 | 44 | 5 |
| subtype4 | 23 | 0 |
| subtype5 | 44 | 12 |
| subtype6 | 62 | 13 |
Figure S48. Get High-res Image Clustering Approach #5: 'RNAseq cHierClus subtypes' versus Clinical Feature #10: 'NEOADJUVANT.THERAPY'
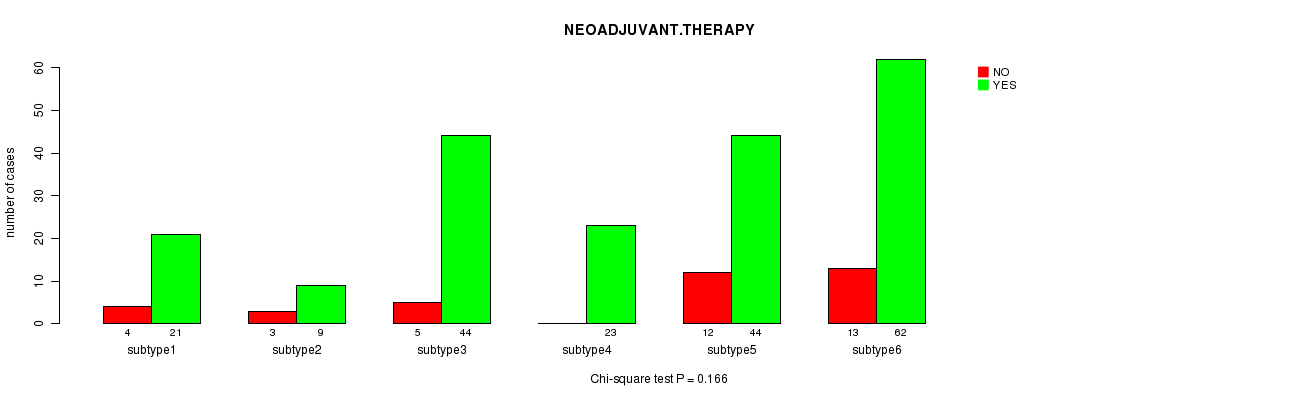
Table S54. Get Full Table Description of clustering approach #6: 'MIRseq CNMF subtypes'
| Cluster Labels | 1 | 2 | 3 |
|---|---|---|---|
| Number of samples | 39 | 29 | 32 |
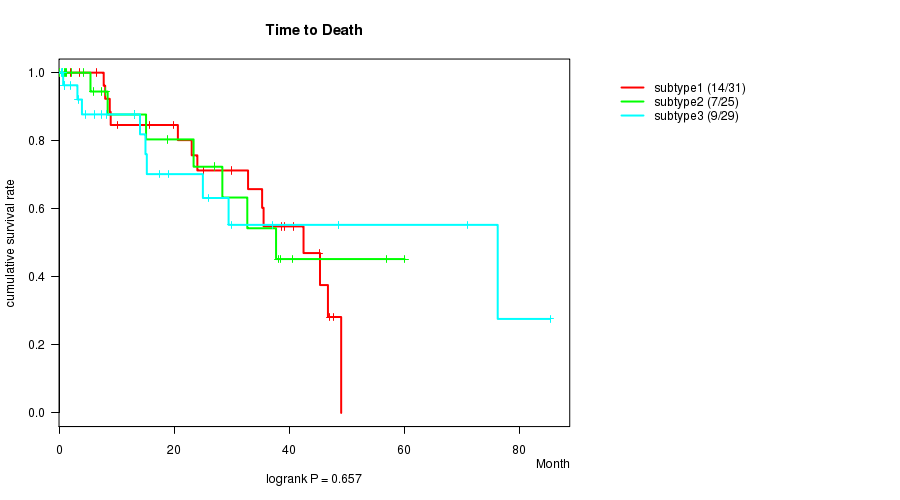
P value = 0.657 (logrank test)
Table S55. Clustering Approach #6: 'MIRseq CNMF subtypes' versus Clinical Feature #1: 'Time to Death'
| nPatients | nDeath | Duration Range (Median), Month | |
|---|---|---|---|
| ALL | 85 | 30 | 0.0 - 85.3 (17.4) |
| subtype1 | 31 | 14 | 0.0 - 49.0 (25.0) |
| subtype2 | 25 | 7 | 0.0 - 60.0 (13.2) |
| subtype3 | 29 | 9 | 0.5 - 85.3 (14.1) |
Figure S49. Get High-res Image Clustering Approach #6: 'MIRseq CNMF subtypes' versus Clinical Feature #1: 'Time to Death'
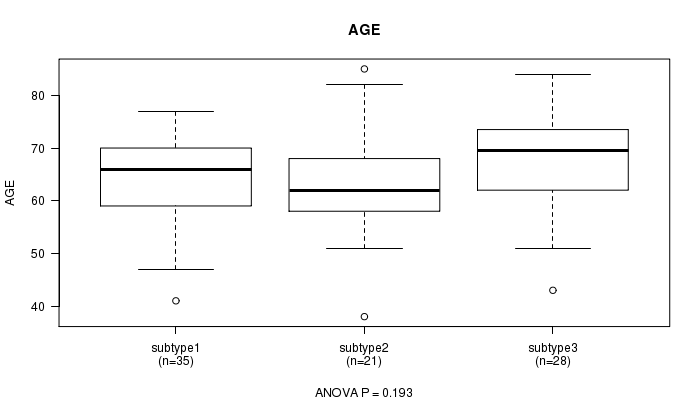
P value = 0.193 (ANOVA)
Table S56. Clustering Approach #6: 'MIRseq CNMF subtypes' versus Clinical Feature #2: 'AGE'
| nPatients | Mean (Std.Dev) | |
|---|---|---|
| ALL | 84 | 65.3 (9.6) |
| subtype1 | 35 | 64.5 (8.8) |
| subtype2 | 21 | 63.2 (10.7) |
| subtype3 | 28 | 67.9 (9.3) |
Figure S50. Get High-res Image Clustering Approach #6: 'MIRseq CNMF subtypes' versus Clinical Feature #2: 'AGE'
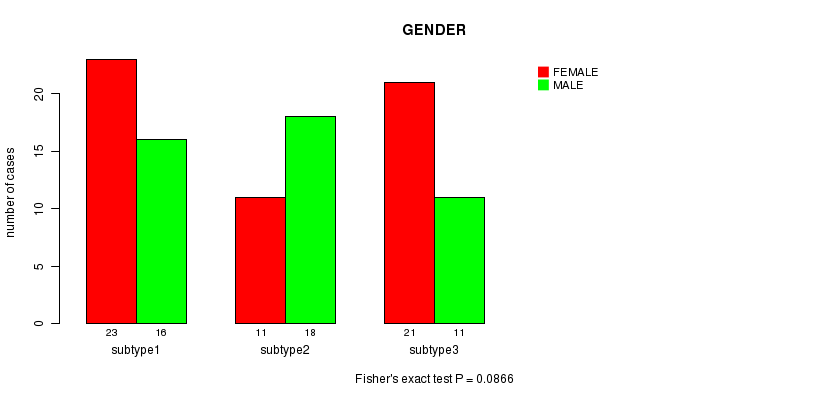
P value = 0.0866 (Fisher's exact test)
Table S57. Clustering Approach #6: 'MIRseq CNMF subtypes' versus Clinical Feature #3: 'GENDER'
| nPatients | FEMALE | MALE |
|---|---|---|
| ALL | 45 | 55 |
| subtype1 | 16 | 23 |
| subtype2 | 18 | 11 |
| subtype3 | 11 | 21 |
Figure S51. Get High-res Image Clustering Approach #6: 'MIRseq CNMF subtypes' versus Clinical Feature #3: 'GENDER'
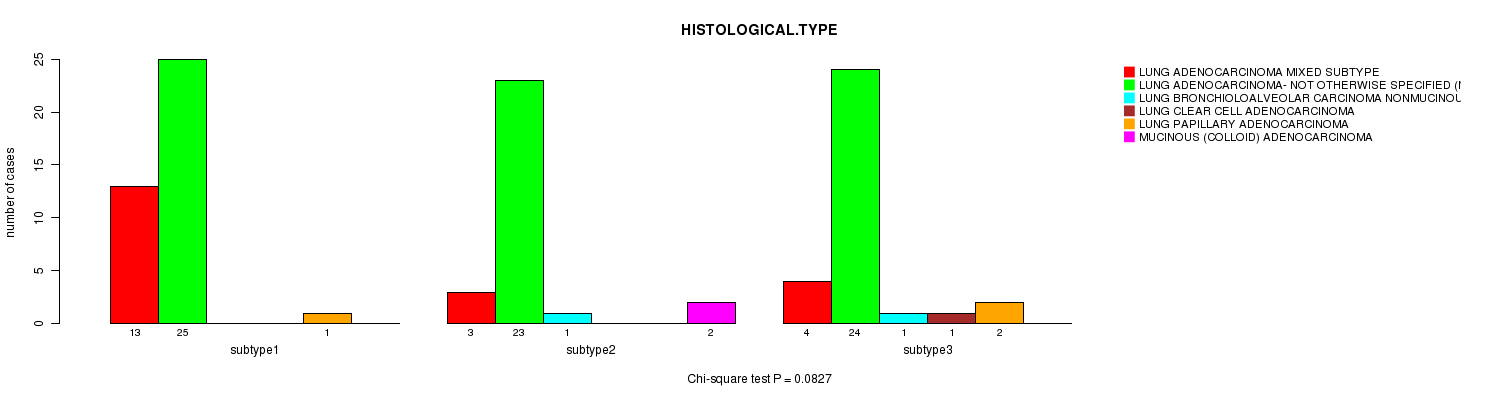
P value = 0.0827 (Chi-square test)
Table S58. Clustering Approach #6: 'MIRseq CNMF subtypes' versus Clinical Feature #5: 'HISTOLOGICAL.TYPE'
| nPatients | LUNG ADENOCARCINOMA MIXED SUBTYPE | LUNG ADENOCARCINOMA- NOT OTHERWISE SPECIFIED (NOS) | LUNG BRONCHIOLOALVEOLAR CARCINOMA NONMUCINOUS | LUNG CLEAR CELL ADENOCARCINOMA | LUNG PAPILLARY ADENOCARCINOMA | MUCINOUS (COLLOID) ADENOCARCINOMA |
|---|---|---|---|---|---|---|
| ALL | 20 | 72 | 2 | 1 | 3 | 2 |
| subtype1 | 13 | 25 | 0 | 0 | 1 | 0 |
| subtype2 | 3 | 23 | 1 | 0 | 0 | 2 |
| subtype3 | 4 | 24 | 1 | 1 | 2 | 0 |
Figure S52. Get High-res Image Clustering Approach #6: 'MIRseq CNMF subtypes' versus Clinical Feature #5: 'HISTOLOGICAL.TYPE'
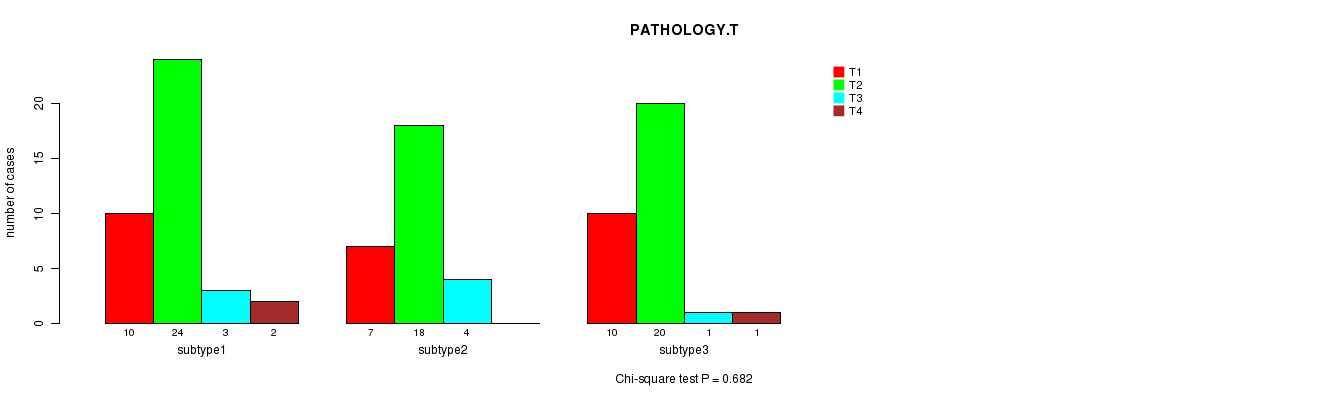
P value = 0.682 (Chi-square test)
Table S59. Clustering Approach #6: 'MIRseq CNMF subtypes' versus Clinical Feature #6: 'PATHOLOGY.T'
| nPatients | T1 | T2 | T3 | T4 |
|---|---|---|---|---|
| ALL | 27 | 62 | 8 | 3 |
| subtype1 | 10 | 24 | 3 | 2 |
| subtype2 | 7 | 18 | 4 | 0 |
| subtype3 | 10 | 20 | 1 | 1 |
Figure S53. Get High-res Image Clustering Approach #6: 'MIRseq CNMF subtypes' versus Clinical Feature #6: 'PATHOLOGY.T'
P value = 0.509 (Chi-square test)
Table S60. Clustering Approach #6: 'MIRseq CNMF subtypes' versus Clinical Feature #7: 'PATHOLOGY.N'
| nPatients | N0 | N1 | N2+N3 |
|---|---|---|---|
| ALL | 58 | 22 | 18 |
| subtype1 | 19 | 9 | 10 |
| subtype2 | 18 | 7 | 4 |
| subtype3 | 21 | 6 | 4 |
Figure S54. Get High-res Image Clustering Approach #6: 'MIRseq CNMF subtypes' versus Clinical Feature #7: 'PATHOLOGY.N'
P value = 0.144 (Chi-square test)
Table S61. Clustering Approach #6: 'MIRseq CNMF subtypes' versus Clinical Feature #8: 'PATHOLOGICSPREAD(M)'
| nPatients | M0 | M1 | MX |
|---|---|---|---|
| ALL | 81 | 5 | 13 |
| subtype1 | 32 | 2 | 4 |
| subtype2 | 22 | 0 | 7 |
| subtype3 | 27 | 3 | 2 |
Figure S55. Get High-res Image Clustering Approach #6: 'MIRseq CNMF subtypes' versus Clinical Feature #8: 'PATHOLOGICSPREAD(M)'
P value = 0.552 (Fisher's exact test)
Table S62. Clustering Approach #6: 'MIRseq CNMF subtypes' versus Clinical Feature #9: 'RADIATIONS.RADIATION.REGIMENINDICATION'
| nPatients | NO | YES |
|---|---|---|
| ALL | 96 | 4 |
| subtype1 | 37 | 2 |
| subtype2 | 29 | 0 |
| subtype3 | 30 | 2 |
Figure S56. Get High-res Image Clustering Approach #6: 'MIRseq CNMF subtypes' versus Clinical Feature #9: 'RADIATIONS.RADIATION.REGIMENINDICATION'
P value = 1 (Fisher's exact test)
Table S63. Clustering Approach #6: 'MIRseq CNMF subtypes' versus Clinical Feature #10: 'NEOADJUVANT.THERAPY'
| nPatients | NO | YES |
|---|---|---|
| ALL | 88 | 12 |
| subtype1 | 34 | 5 |
| subtype2 | 26 | 3 |
| subtype3 | 28 | 4 |
Figure S57. Get High-res Image Clustering Approach #6: 'MIRseq CNMF subtypes' versus Clinical Feature #10: 'NEOADJUVANT.THERAPY'
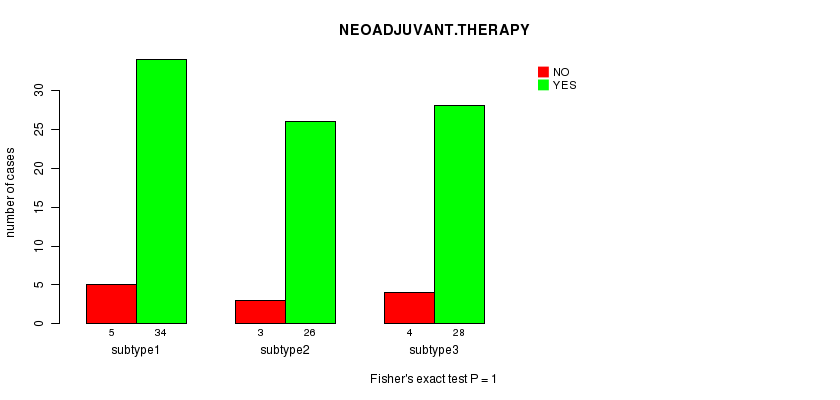
Table S64. Get Full Table Description of clustering approach #7: 'MIRseq cHierClus subtypes'
| Cluster Labels | 1 | 2 | 3 |
|---|---|---|---|
| Number of samples | 40 | 31 | 29 |
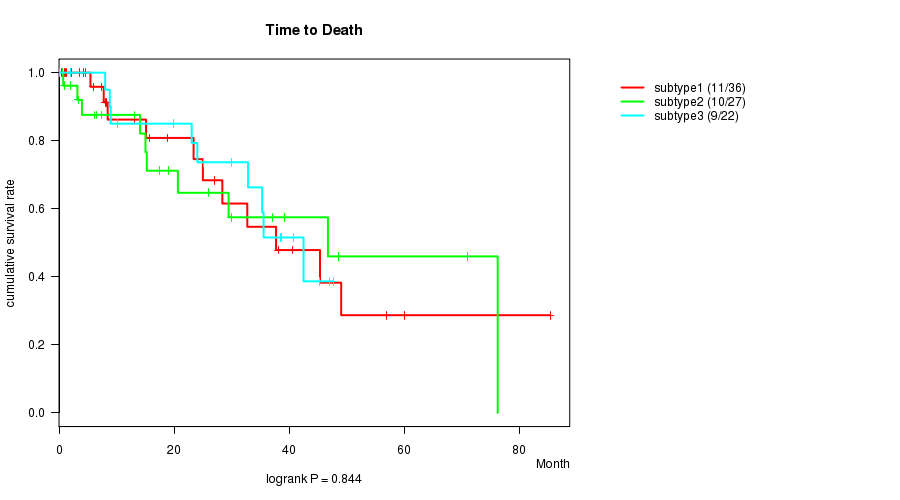
P value = 0.844 (logrank test)
Table S65. Clustering Approach #7: 'MIRseq cHierClus subtypes' versus Clinical Feature #1: 'Time to Death'
| nPatients | nDeath | Duration Range (Median), Month | |
|---|---|---|---|
| ALL | 85 | 30 | 0.0 - 85.3 (17.4) |
| subtype1 | 36 | 11 | 0.0 - 85.3 (8.4) |
| subtype2 | 27 | 10 | 0.6 - 76.2 (15.2) |
| subtype3 | 22 | 9 | 0.0 - 47.6 (27.5) |
Figure S58. Get High-res Image Clustering Approach #7: 'MIRseq cHierClus subtypes' versus Clinical Feature #1: 'Time to Death'
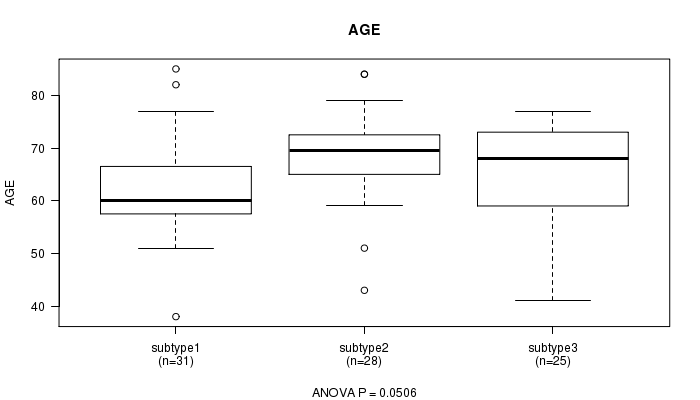
P value = 0.0506 (ANOVA)
Table S66. Clustering Approach #7: 'MIRseq cHierClus subtypes' versus Clinical Feature #2: 'AGE'
| nPatients | Mean (Std.Dev) | |
|---|---|---|
| ALL | 84 | 65.3 (9.6) |
| subtype1 | 31 | 62.4 (9.5) |
| subtype2 | 28 | 68.4 (8.7) |
| subtype3 | 25 | 65.5 (9.7) |
Figure S59. Get High-res Image Clustering Approach #7: 'MIRseq cHierClus subtypes' versus Clinical Feature #2: 'AGE'
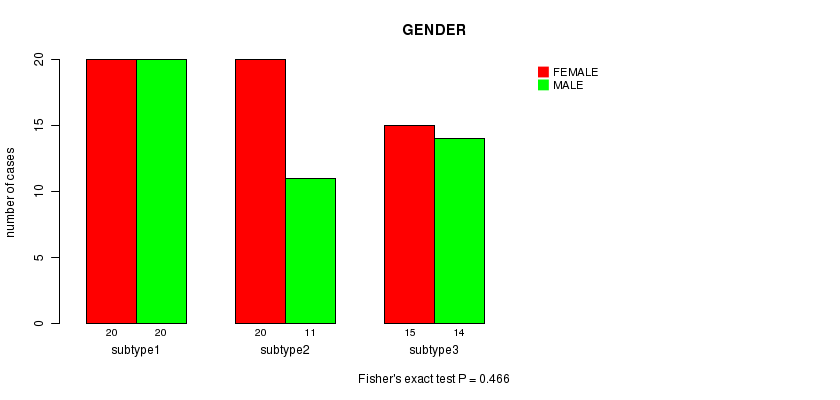
P value = 0.466 (Fisher's exact test)
Table S67. Clustering Approach #7: 'MIRseq cHierClus subtypes' versus Clinical Feature #3: 'GENDER'
| nPatients | FEMALE | MALE |
|---|---|---|
| ALL | 45 | 55 |
| subtype1 | 20 | 20 |
| subtype2 | 11 | 20 |
| subtype3 | 14 | 15 |
Figure S60. Get High-res Image Clustering Approach #7: 'MIRseq cHierClus subtypes' versus Clinical Feature #3: 'GENDER'
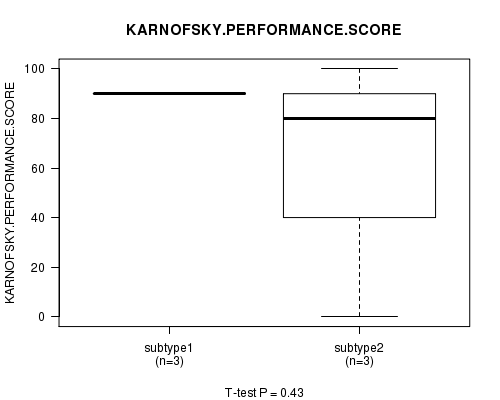
P value = 0.43 (ANOVA)
Table S68. Clustering Approach #7: 'MIRseq cHierClus subtypes' versus Clinical Feature #4: 'KARNOFSKY.PERFORMANCE.SCORE'
| nPatients | Mean (Std.Dev) | |
|---|---|---|
| ALL | 6 | 75.0 (37.3) |
| subtype1 | 3 | 90.0 (0.0) |
| subtype2 | 3 | 60.0 (52.9) |
Figure S61. Get High-res Image Clustering Approach #7: 'MIRseq cHierClus subtypes' versus Clinical Feature #4: 'KARNOFSKY.PERFORMANCE.SCORE'
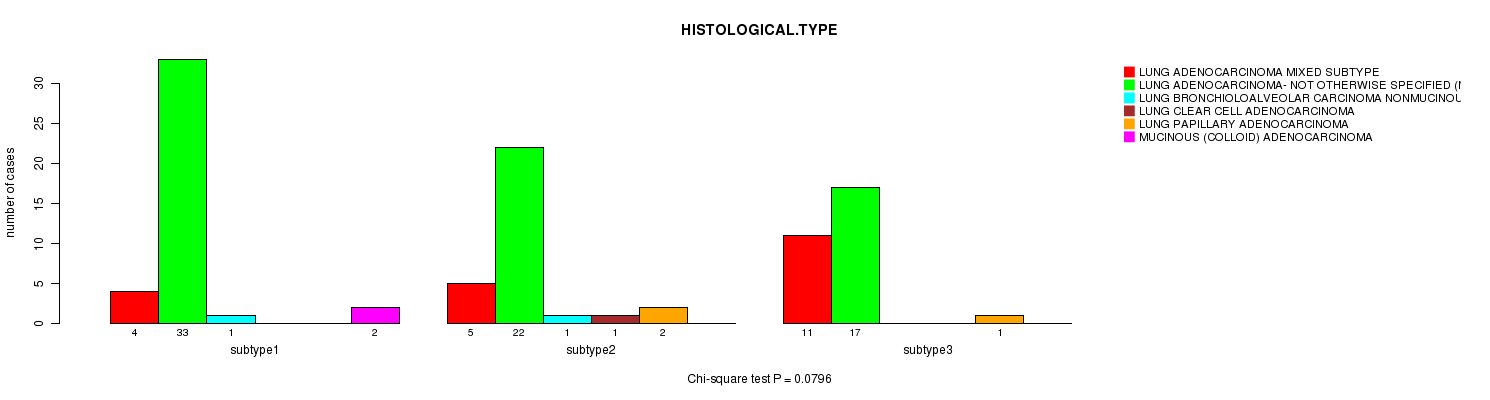
P value = 0.0796 (Chi-square test)
Table S69. Clustering Approach #7: 'MIRseq cHierClus subtypes' versus Clinical Feature #5: 'HISTOLOGICAL.TYPE'
| nPatients | LUNG ADENOCARCINOMA MIXED SUBTYPE | LUNG ADENOCARCINOMA- NOT OTHERWISE SPECIFIED (NOS) | LUNG BRONCHIOLOALVEOLAR CARCINOMA NONMUCINOUS | LUNG CLEAR CELL ADENOCARCINOMA | LUNG PAPILLARY ADENOCARCINOMA | MUCINOUS (COLLOID) ADENOCARCINOMA |
|---|---|---|---|---|---|---|
| ALL | 20 | 72 | 2 | 1 | 3 | 2 |
| subtype1 | 4 | 33 | 1 | 0 | 0 | 2 |
| subtype2 | 5 | 22 | 1 | 1 | 2 | 0 |
| subtype3 | 11 | 17 | 0 | 0 | 1 | 0 |
Figure S62. Get High-res Image Clustering Approach #7: 'MIRseq cHierClus subtypes' versus Clinical Feature #5: 'HISTOLOGICAL.TYPE'
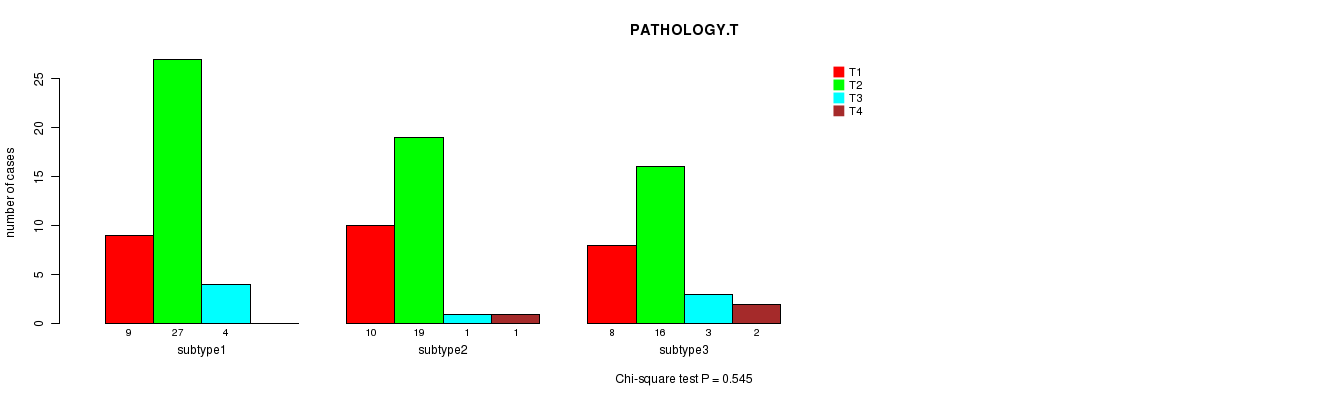
P value = 0.545 (Chi-square test)
Table S70. Clustering Approach #7: 'MIRseq cHierClus subtypes' versus Clinical Feature #6: 'PATHOLOGY.T'
| nPatients | T1 | T2 | T3 | T4 |
|---|---|---|---|---|
| ALL | 27 | 62 | 8 | 3 |
| subtype1 | 9 | 27 | 4 | 0 |
| subtype2 | 10 | 19 | 1 | 1 |
| subtype3 | 8 | 16 | 3 | 2 |
Figure S63. Get High-res Image Clustering Approach #7: 'MIRseq cHierClus subtypes' versus Clinical Feature #6: 'PATHOLOGY.T'
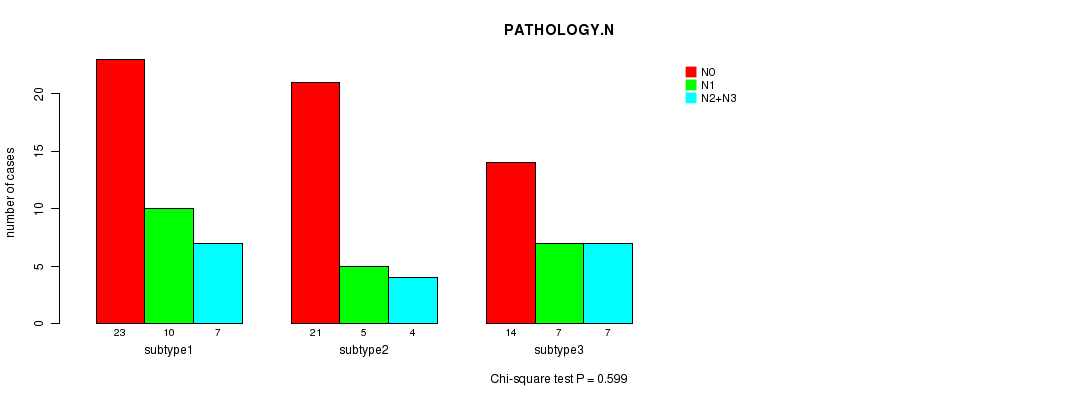
P value = 0.599 (Chi-square test)
Table S71. Clustering Approach #7: 'MIRseq cHierClus subtypes' versus Clinical Feature #7: 'PATHOLOGY.N'
| nPatients | N0 | N1 | N2+N3 |
|---|---|---|---|
| ALL | 58 | 22 | 18 |
| subtype1 | 23 | 10 | 7 |
| subtype2 | 21 | 5 | 4 |
| subtype3 | 14 | 7 | 7 |
Figure S64. Get High-res Image Clustering Approach #7: 'MIRseq cHierClus subtypes' versus Clinical Feature #7: 'PATHOLOGY.N'
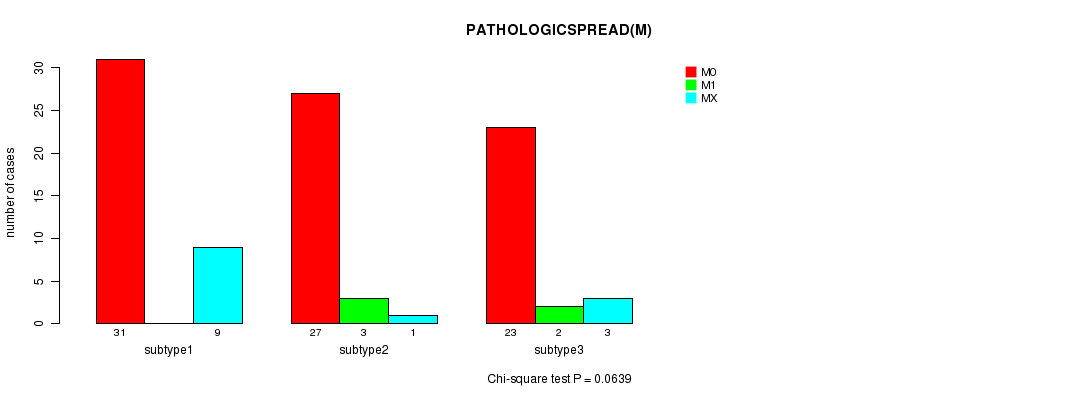
P value = 0.0639 (Chi-square test)
Table S72. Clustering Approach #7: 'MIRseq cHierClus subtypes' versus Clinical Feature #8: 'PATHOLOGICSPREAD(M)'
| nPatients | M0 | M1 | MX |
|---|---|---|---|
| ALL | 81 | 5 | 13 |
| subtype1 | 31 | 0 | 9 |
| subtype2 | 27 | 3 | 1 |
| subtype3 | 23 | 2 | 3 |
Figure S65. Get High-res Image Clustering Approach #7: 'MIRseq cHierClus subtypes' versus Clinical Feature #8: 'PATHOLOGICSPREAD(M)'
P value = 0.821 (Fisher's exact test)
Table S73. Clustering Approach #7: 'MIRseq cHierClus subtypes' versus Clinical Feature #9: 'RADIATIONS.RADIATION.REGIMENINDICATION'
| nPatients | NO | YES |
|---|---|---|
| ALL | 96 | 4 |
| subtype1 | 39 | 1 |
| subtype2 | 29 | 2 |
| subtype3 | 28 | 1 |
Figure S66. Get High-res Image Clustering Approach #7: 'MIRseq cHierClus subtypes' versus Clinical Feature #9: 'RADIATIONS.RADIATION.REGIMENINDICATION'
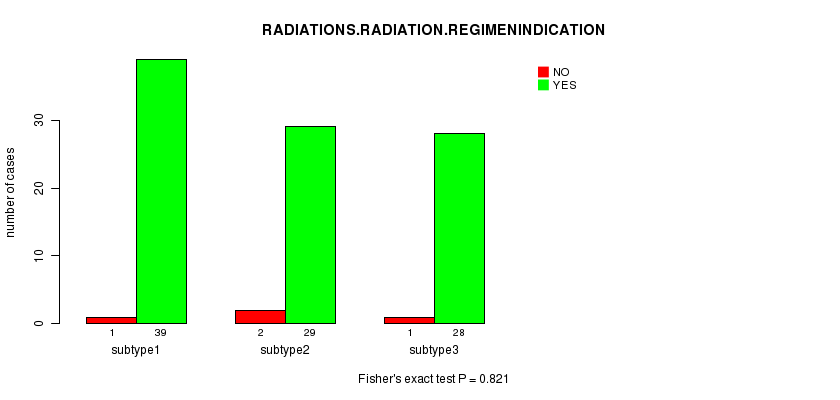
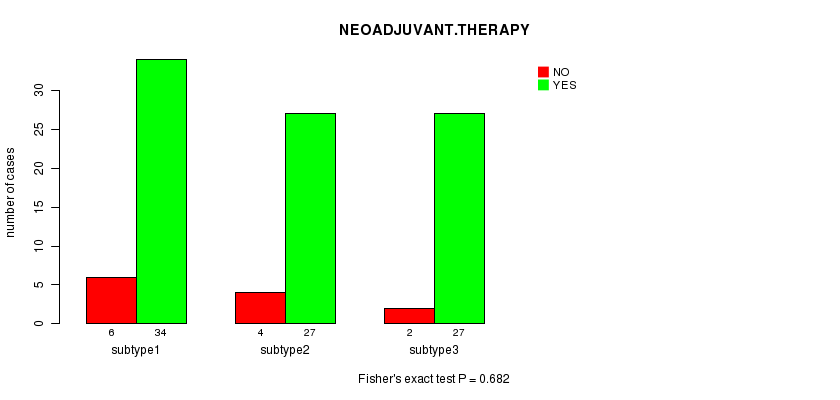
P value = 0.682 (Fisher's exact test)
Table S74. Clustering Approach #7: 'MIRseq cHierClus subtypes' versus Clinical Feature #10: 'NEOADJUVANT.THERAPY'
| nPatients | NO | YES |
|---|---|---|
| ALL | 88 | 12 |
| subtype1 | 34 | 6 |
| subtype2 | 27 | 4 |
| subtype3 | 27 | 2 |
Figure S67. Get High-res Image Clustering Approach #7: 'MIRseq cHierClus subtypes' versus Clinical Feature #10: 'NEOADJUVANT.THERAPY'
-
Cluster data file = LUAD.mergedcluster.txt
-
Clinical data file = LUAD.clin.merged.picked.txt
-
Number of patients = 283
-
Number of clustering approaches = 7
-
Number of selected clinical features = 10
-
Exclude small clusters that include fewer than K patients, K = 3
consensus non-negative matrix factorization clustering approach (Brunet et al. 2004)
Resampling-based clustering method (Monti et al. 2003)
For survival clinical features, the Kaplan-Meier survival curves of tumors with and without gene mutations were plotted and the statistical significance P values were estimated by logrank test (Bland and Altman 2004) using the 'survdiff' function in R
For continuous numerical clinical features, one-way analysis of variance (Howell 2002) was applied to compare the clinical values between tumor subtypes using 'anova' function in R
For binary clinical features, two-tailed Fisher's exact tests (Fisher 1922) were used to estimate the P values using the 'fisher.test' function in R
For multi-class clinical features (nominal or ordinal), Chi-square tests (Greenwood and Nikulin 1996) were used to estimate the P values using the 'chisq.test' function in R
This is an experimental feature. The full results of the analysis summarized in this report can be downloaded from the TCGA Data Coordination Center.