This report serves to describe the mutational landscape and properties of a given individual set, as well as rank genes and genesets according to mutational significance. MutSig v2.0 was used to generate the results found in this report.
Working with individual set: PRAD.
Number of patients in set: 83
The input for this pipeline is a set of individuals with the following files associated for each:
1. An annotated .maf file describing the mutations called for the respective individual, and their properties.
2. A .wig file that contains information about the coverage of the sample.
Significantly mutated genes (q ≤ 0.1): 93
Mutations seen in COSMIC: 28
Significantly mutated genes in COSMIC territory: 7
Genes with clustered mutations (&le 3 aa apart): 23
Significantly mutated genesets: 13
Significantly mutated genesets: (excluding sig. mutated genes): 0
Table 1. Get Full Table Table representing breakdown of mutations by type.
| type | count |
|---|---|
| Frame_Shift_Del | 150 |
| Frame_Shift_Ins | 77 |
| In_Frame_Del | 51 |
| In_Frame_Ins | 13 |
| Missense_Mutation | 3277 |
| Nonsense_Mutation | 185 |
| Nonstop_Mutation | 2 |
| Silent | 1489 |
| Splice_Site | 102 |
| Translation_Start_Site | 13 |
| Total | 5359 |
Table 2. Get Full Table A breakdown of mutation rates per category discovered for this individual set.
| category | n | N | rate | rate_per_mb | relative_rate | exp_ns_s_ratio |
|---|---|---|---|---|---|---|
| *CpG->T | 839 | 138713067 | 6e-06 | 6 | 3.9 | 2.1 |
| *Np(A/C/T)->transit | 898 | 1965699488 | 4.6e-07 | 0.46 | 0.29 | 2 |
| *ApG->G | 107 | 381313535 | 2.8e-07 | 0.28 | 0.18 | 2.1 |
| transver | 1443 | 2485726090 | 5.8e-07 | 0.58 | 0.37 | 5 |
| indel+null | 580 | 2485726090 | 2.3e-07 | 0.23 | 0.15 | NaN |
| double_null | 3 | 2485726090 | 1.2e-09 | 0.0012 | 0.00078 | NaN |
| Total | 3870 | 2485726090 | 1.6e-06 | 1.6 | 1 | 3.5 |
The x axis represents the samples. The y axis represents the exons, one row per exon, and they are sorted by average coverage across samples. For exons with exactly the same average coverage, they are sorted next by the %GC of the exon. (The secondary sort is especially useful for the zero-coverage exons at the bottom).
Figure 1.
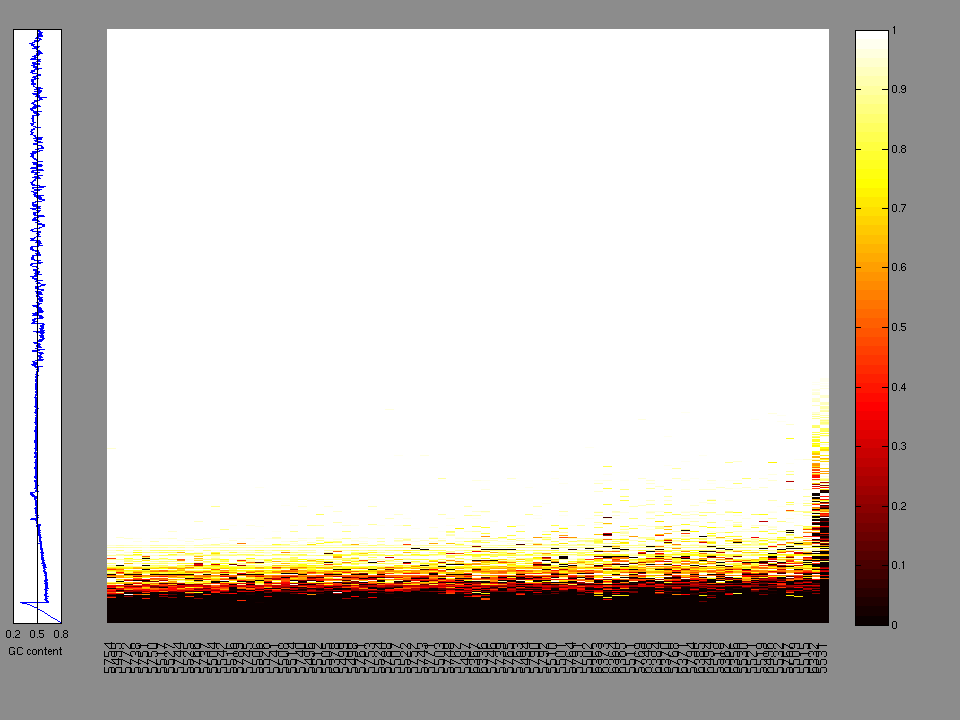
Figure 2.
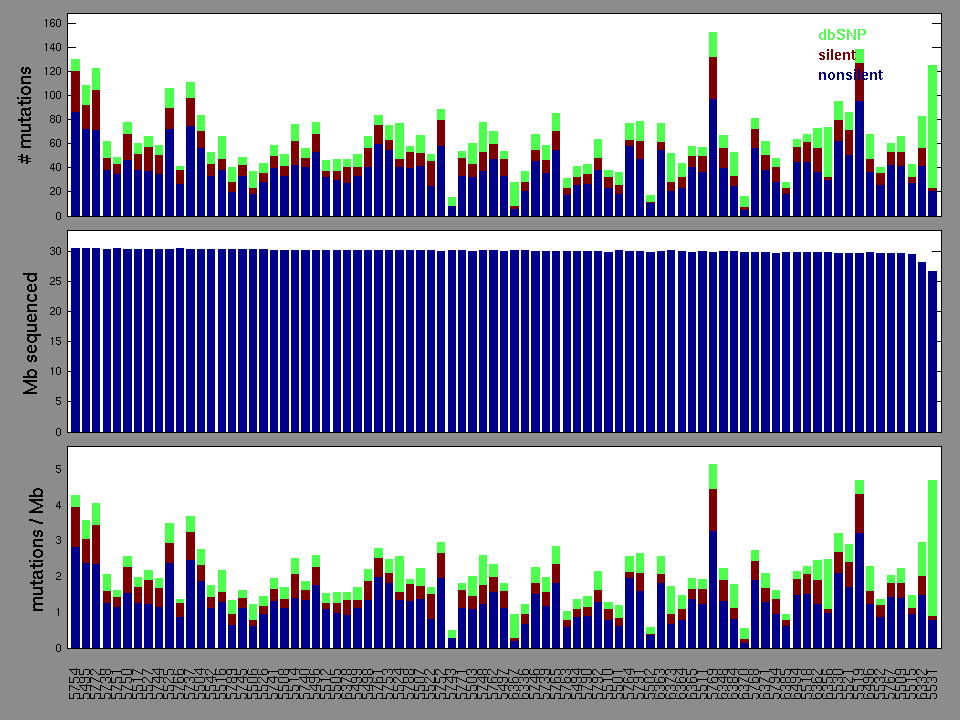
Figure 3. Get High-res Image The matrix in the center of the figure represents individual mutations in patient samples, color-coded by type of mutation, for the significantly mutated genes. The rate of synonymous and non-synonymous mutations is displayed at the top of the matrix. The barplot on the left of the matrix shows the number of mutations in each gene. The percentages represent the fraction of tumors with at least one mutation in the specified gene. The barplot to the right of the matrix displays the q-values for the most significantly mutated genes. The purple boxplots below the matrix (only displayed if required columns are present in the provided MAF) represent the distributions of allelic fractions observed in each sample. The plot at the bottom represents the base substitution distribution of individual samples, using the same categories that were used to calculate significance.
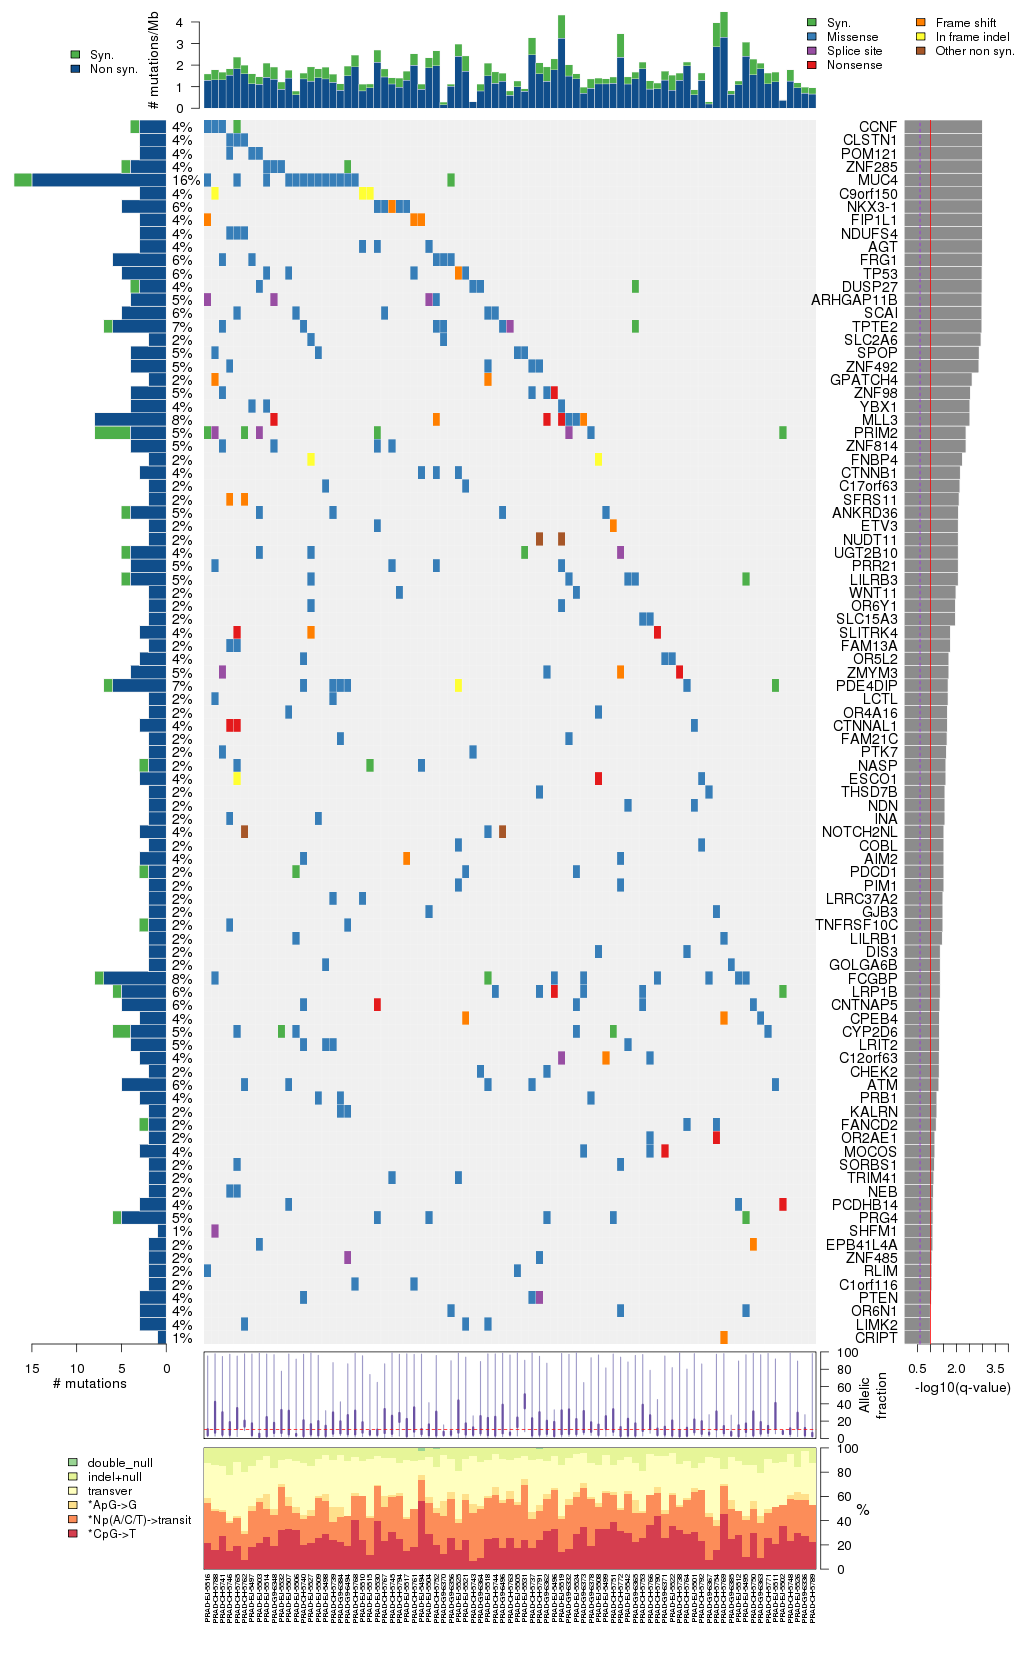
Table 3. Get Full Table A Ranked List of Significantly Mutated Genes. Number of significant genes found: 93. Number of genes displayed: 35
| rank | gene | description | N | n | npat | nsite | nsil | n1 | n2 | n3 | n4 | n5 | n6 | p_classic | p_ns_s | p_ks | p_cons | p_joint | p | q |
|---|---|---|---|---|---|---|---|---|---|---|---|---|---|---|---|---|---|---|---|---|
| 1 | CCNF | cyclin F | 199411 | 3 | 3 | 1 | 1 | 0 | 0 | 0 | 3 | 0 | 0 | 0.00099 | 0.79 | 2e-07 | 0.029 | 0 | <1.00e-15 | <4.53e-12 |
| 2 | CLSTN1 | calsyntenin 1 | 242387 | 3 | 3 | 1 | 0 | 0 | 0 | 0 | 3 | 0 | 0 | 0.0022 | 0.6 | 2e-07 | 0.07 | 0 | <1.00e-15 | <4.53e-12 |
| 3 | POM121 | POM121 membrane glycoprotein (rat) | 216520 | 3 | 3 | 1 | 0 | 0 | 0 | 0 | 3 | 0 | 0 | 0.0012 | 0.48 | 6e-07 | 0.35 | 0 | <1.00e-15 | <4.53e-12 |
| 4 | ZNF285 | 148155 | 4 | 3 | 2 | 1 | 0 | 0 | 2 | 2 | 0 | 0 | 0.00028 | 0.74 | 1.8e-06 | 1.8e-06 | 0 | <1.00e-15 | <4.53e-12 | |
| 5 | MUC4 | mucin 4, cell surface associated | 272535 | 15 | 13 | 9 | 2 | 3 | 4 | 0 | 8 | 0 | 0 | 2.9e-13 | 0.13 | 0.00037 | 0.091 | 0.00096 | 1.01e-14 | 3.66e-11 |
| 6 | C9orf150 | chromosome 9 open reading frame 150 | 47265 | 3 | 3 | 1 | 0 | 0 | 0 | 0 | 0 | 3 | 0 | 4.1e-08 | 1 | 3e-06 | 1 | 3.8e-06 | 4.73e-12 | 1.43e-08 |
| 7 | NKX3-1 | NK3 homeobox 1 | 43527 | 5 | 5 | 5 | 0 | 0 | 2 | 0 | 2 | 1 | 0 | 2.2e-10 | 0.26 | 0.11 | 0.0093 | 0.024 | 1.39e-10 | 3.60e-07 |
| 8 | FIP1L1 | FIP1 like 1 (S. cerevisiae) | 152119 | 3 | 3 | 1 | 0 | 0 | 0 | 0 | 0 | 3 | 0 | 8.3e-06 | 1 | 2e-07 | 1 | 1.2e-06 | 2.61e-10 | 5.92e-07 |
| 9 | NDUFS4 | NADH dehydrogenase (ubiquinone) Fe-S protein 4, 18kDa (NADH-coenzyme Q reductase) | 45401 | 3 | 3 | 1 | 0 | 0 | 0 | 0 | 3 | 0 | 0 | 3.6e-06 | 0.58 | 6.4e-06 | 0.33 | 7e-06 | 6.36e-10 | 1.28e-06 |
| 10 | AGT | angiotensinogen (serpin peptidase inhibitor, clade A, member 8) | 122342 | 3 | 3 | 1 | 0 | 0 | 0 | 0 | 3 | 0 | 0 | 0.00012 | 0.53 | 6e-07 | 1 | 1.8e-06 | 5.11e-09 | 9.27e-06 |
| 11 | FRG1 | FSHD region gene 1 | 67208 | 6 | 5 | 4 | 0 | 0 | 2 | 0 | 3 | 1 | 0 | 8.5e-10 | 0.32 | 0.31 | 1 | 0.5 | 9.59e-09 | 0.000016 |
| 12 | TP53 | tumor protein p53 | 105521 | 5 | 5 | 5 | 0 | 3 | 0 | 0 | 1 | 1 | 0 | 2.4e-07 | 0.33 | 0.074 | 0.0014 | 0.0048 | 2.48e-08 | 0.000037 |
| 13 | DUSP27 | dual specificity phosphatase 27 (putative) | 264959 | 3 | 3 | 1 | 1 | 0 | 0 | 0 | 3 | 0 | 0 | 0.00078 | 0.82 | 4e-07 | 0.92 | 1.6e-06 | 2.68e-08 | 0.000037 |
| 14 | ARHGAP11B | Rho GTPase activating protein 11B | 68637 | 4 | 4 | 2 | 0 | 0 | 0 | 0 | 1 | 3 | 0 | 4.2e-08 | 0.25 | NaN | NaN | NaN | 4.18e-08 | 0.000054 |
| 15 | SCAI | 157950 | 5 | 5 | 2 | 0 | 0 | 0 | 0 | 5 | 0 | 0 | 1.4e-07 | 0.45 | 0.012 | 0.4 | 0.023 | 6.63e-08 | 0.000076 | |
| 16 | TPTE2 | transmembrane phosphoinositide 3-phosphatase and tensin homolog 2 | 136261 | 6 | 6 | 6 | 1 | 1 | 2 | 0 | 2 | 1 | 0 | 3.3e-09 | 0.48 | 0.8 | 0.55 | 1 | 6.74e-08 | 0.000076 |
| 17 | SLC2A6 | solute carrier family 2 (facilitated glucose transporter), member 6 | 97622 | 2 | 2 | 1 | 0 | 0 | 0 | 0 | 2 | 0 | 0 | 0.0011 | 0.61 | 0.0011 | 0.000023 | 6.4e-06 | 1.36e-07 | 0.00014 |
| 18 | SPOP | speckle-type POZ protein | 96345 | 4 | 4 | 3 | 0 | 0 | 0 | 1 | 3 | 0 | 0 | 1.9e-06 | 0.39 | 0.0072 | 0.27 | 0.0091 | 3.27e-07 | 0.00033 |
| 19 | ZNF492 | zinc finger protein 492 | 123622 | 4 | 4 | 3 | 0 | 0 | 3 | 0 | 1 | 0 | 0 | 0.000013 | 0.28 | 0.00036 | 0.55 | 0.0016 | 3.83e-07 | 0.00037 |
| 20 | GPATCH4 | G patch domain containing 4 | 97579 | 2 | 2 | 1 | 0 | 0 | 0 | 0 | 0 | 2 | 0 | 0.00019 | 1 | 0.00086 | 0.28 | 0.00051 | 1.68e-06 | 0.0015 |
| 21 | ZNF98 | zinc finger protein 98 (F7175) | 122162 | 4 | 4 | 4 | 0 | 0 | 1 | 0 | 2 | 1 | 0 | 1.3e-07 | 0.45 | 0.71 | 0.97 | 1 | 2.20e-06 | 0.0019 |
| 22 | YBX1 | Y box binding protein 1 | 68945 | 4 | 3 | 2 | 0 | 0 | 2 | 0 | 2 | 0 | 0 | 0.00021 | 0.32 | 0.014 | 0.00087 | 0.00073 | 2.60e-06 | 0.0021 |
| 23 | MLL3 | myeloid/lymphoid or mixed-lineage leukemia 3 | 1228308 | 8 | 7 | 7 | 0 | 0 | 1 | 0 | 2 | 4 | 1 | 1.7e-06 | 0.23 | 0.06 | 0.73 | 0.098 | 2.72e-06 | 0.0021 |
| 24 | PRIM2 | primase, DNA, polypeptide 2 (58kDa) | 120943 | 4 | 4 | 2 | 4 | 0 | 0 | 0 | 1 | 3 | 0 | 4.3e-06 | 1 | NaN | NaN | NaN | 4.34e-06 | 0.0033 |
| 25 | ZNF814 | zinc finger protein 814 | 168858 | 4 | 4 | 2 | 0 | 0 | 2 | 0 | 2 | 0 | 0 | 0.000023 | 0.34 | 0.0026 | 0.99 | 0.013 | 4.61e-06 | 0.0033 |
| 26 | FNBP4 | formin binding protein 4 | 236598 | 2 | 2 | 1 | 0 | 0 | 0 | 0 | 0 | 2 | 0 | 0.0013 | 1 | 0.00035 | 0.95 | 0.00035 | 7.04e-06 | 0.0049 |
| 27 | CTNNB1 | catenin (cadherin-associated protein), beta 1, 88kDa | 199245 | 3 | 3 | 3 | 0 | 0 | 1 | 0 | 2 | 0 | 0 | 0.00073 | 0.46 | 0.00068 | 0.24 | 0.00082 | 9.08e-06 | 0.0061 |
| 28 | C17orf63 | chromosome 17 open reading frame 63 | 5972 | 2 | 2 | 1 | 0 | 0 | 0 | 0 | 2 | 0 | 0 | 9.9e-06 | 0.65 | NaN | NaN | NaN | 9.89e-06 | 0.0064 |
| 29 | SFRS11 | splicing factor, arginine/serine-rich 11 | 124634 | 2 | 2 | 1 | 0 | 0 | 0 | 0 | 0 | 2 | 0 | 0.0011 | 1 | 0.00066 | 0.8 | 0.00066 | 0.000011 | 0.0069 |
| 30 | ANKRD36 | ankyrin repeat domain 36 | 204931 | 4 | 4 | 2 | 1 | 0 | 0 | 0 | 4 | 0 | 0 | 0.000019 | 0.71 | 0.019 | 0.86 | 0.043 | 0.000012 | 0.0074 |
| 31 | ETV3 | ets variant gene 3 | 36841 | 2 | 2 | 2 | 0 | 0 | 1 | 0 | 0 | 1 | 0 | 0.0003 | 0.65 | 0.0023 | 0.78 | 0.0029 | 0.000013 | 0.0075 |
| 32 | NUDT11 | nudix (nucleoside diphosphate linked moiety X)-type motif 11 | 32705 | 2 | 2 | 1 | 0 | 0 | 0 | 0 | 0 | 2 | 0 | 0.000045 | 1 | 0.0022 | 0.93 | 0.02 | 0.000014 | 0.0075 |
| 33 | UGT2B10 | UDP glucuronosyltransferase 2 family, polypeptide B10 | 264942 | 4 | 3 | 3 | 1 | 0 | 0 | 0 | 3 | 1 | 0 | 0.000069 | 0.73 | 0.0077 | 0.33 | 0.014 | 0.000014 | 0.0075 |
| 34 | PRR21 | 58941 | 4 | 4 | 4 | 0 | 1 | 1 | 0 | 2 | 0 | 0 | 3e-06 | 0.26 | 0.2 | 0.93 | 0.31 | 0.000014 | 0.0075 | |
| 35 | LILRB3 | leukocyte immunoglobulin-like receptor, subfamily B (with TM and ITIM domains), member 3 | 120480 | 4 | 4 | 2 | 1 | 0 | 0 | 3 | 1 | 0 | 0 | 5.5e-06 | 0.6 | 0.085 | 0.96 | 0.18 | 0.000015 | 0.0075 |
Note:
N - number of sequenced bases in this gene across the individual set.
n - number of (nonsilent) mutations in this gene across the individual set.
npat - number of patients (individuals) with at least one nonsilent mutation.
nsite - number of unique sites having a non-silent mutation.
nsil - number of silent mutations in this gene across the individual set.
n1 - number of nonsilent mutations of type: *CpG->T .
n2 - number of nonsilent mutations of type: *Np(A/C/T)->transit .
n3 - number of nonsilent mutations of type: *ApG->G .
n4 - number of nonsilent mutations of type: transver .
n5 - number of nonsilent mutations of type: indel+null .
null - mutation category that includes nonsense, frameshift, splice-site mutations
p_classic = p-value for the observed amount of nonsilent mutations being elevated in this gene
p_ns_s = p-value for the observed nonsilent/silent ratio being elevated in this gene
p = p-value (overall)
q = q-value, False Discovery Rate (Benjamini-Hochberg procedure)
In this analysis, COSMIC is used as a filter to increase power by restricting the territory of each gene. Cosmic version: v48.
Table 4. Get Full Table Significantly mutated genes (COSMIC territory only). To access the database please go to: COSMIC. Number of significant genes found: 7. Number of genes displayed: 10
| rank | gene | description | n | cos | n_cos | N_cos | cos_ev | p | q |
|---|---|---|---|---|---|---|---|---|---|
| 1 | TP53 | tumor protein p53 | 5 | 308 | 5 | 25564 | 1608 | 8e-10 | 3.6e-06 |
| 2 | CHEK2 | CHK2 checkpoint homolog (S. pombe) | 2 | 2 | 2 | 166 | 2 | 3.3e-08 | 0.000075 |
| 3 | CTNNB1 | catenin (cadherin-associated protein), beta 1, 88kDa | 3 | 101 | 3 | 8383 | 1229 | 3.7e-07 | 0.00055 |
| 4 | ACSM2B | acyl-CoA synthetase medium-chain family member 2B | 1 | 1 | 1 | 83 | 1 | 0.00013 | 0.084 |
| 5 | BRE | brain and reproductive organ-expressed (TNFRSF1A modulator) | 1 | 1 | 1 | 83 | 1 | 0.00013 | 0.084 |
| 6 | KCNH1 | potassium voltage-gated channel, subfamily H (eag-related), member 1 | 1 | 1 | 1 | 83 | 1 | 0.00013 | 0.084 |
| 7 | PTEN | phosphatase and tensin homolog (mutated in multiple advanced cancers 1) | 3 | 728 | 3 | 60424 | 15 | 0.00013 | 0.084 |
| 8 | CHAT | choline acetyltransferase | 2 | 2 | 1 | 166 | 1 | 0.00026 | 0.13 |
| 9 | CYP4F2 | cytochrome P450, family 4, subfamily F, polypeptide 2 | 1 | 2 | 1 | 166 | 2 | 0.00026 | 0.13 |
| 10 | PIK3CA | phosphoinositide-3-kinase, catalytic, alpha polypeptide | 2 | 184 | 2 | 15272 | 355 | 0.00028 | 0.13 |
Note:
n - number of (nonsilent) mutations in this gene across the individual set.
cos = number of unique mutated sites in this gene in COSMIC
n_cos = overlap between n and cos.
N_cos = number of individuals times cos.
cos_ev = total evidence: number of reports in COSMIC for mutations seen in this gene.
p = p-value for seeing the observed amount of overlap in this gene)
q = q-value, False Discovery Rate (Benjamini-Hochberg procedure)
Table 5. Get Full Table Genes with Clustered Mutations
| num | gene | desc | n | mindist | nmuts0 | nmuts3 | nmuts12 | npairs0 | npairs3 | npairs12 |
|---|---|---|---|---|---|---|---|---|---|---|
| 1655 | MUC4 | mucin 4, cell surface associated | 15 | 0 | 13 | 23 | 23 | 13 | 23 | 23 |
| 480 | CDC27 | cell division cycle 27 homolog (S. cerevisiae) | 10 | 0 | 6 | 8 | 9 | 6 | 8 | 9 |
| 2272 | SCAI | 5 | 0 | 6 | 6 | 6 | 6 | 6 | 6 | |
| 92 | AGT | angiotensinogen (serpin peptidase inhibitor, clade A, member 8) | 3 | 0 | 3 | 3 | 3 | 3 | 3 | 3 |
| 144 | ANKRD36 | ankyrin repeat domain 36 | 4 | 0 | 3 | 3 | 3 | 3 | 3 | 3 |
| 464 | CCNF | cyclin F | 3 | 0 | 3 | 3 | 3 | 3 | 3 | 3 |
| 563 | CLSTN1 | calsyntenin 1 | 3 | 0 | 3 | 3 | 3 | 3 | 3 | 3 |
| 624 | CROCC | ciliary rootlet coiled-coil, rootletin | 5 | 0 | 3 | 3 | 3 | 3 | 3 | 3 |
| 665 | CYP2D6 | cytochrome P450, family 2, subfamily D, polypeptide 6 | 4 | 0 | 3 | 3 | 3 | 3 | 3 | 3 |
| 779 | DUSP27 | dual specificity phosphatase 27 (putative) | 3 | 0 | 3 | 3 | 3 | 3 | 3 | 3 |
Note:
n - number of mutations in this gene in the individual set.
mindist - distance (in aa) between closest pair of mutations in this gene
npairs3 - how many pairs of mutations are within 3 aa of each other.
npairs12 - how many pairs of mutations are within 12 aa of each other.
Table 6. Get Full Table A Ranked List of Significantly Mutated Genesets. (Source: MSigDB GSEA Cannonical Pathway Set).Number of significant genesets found: 13. Number of genesets displayed: 10
| rank | geneset | description | genes | N_genes | mut_tally | N | n | npat | nsite | nsil | n1 | n2 | n3 | n4 | n5 | n6 | p_ns_s | p | q |
|---|---|---|---|---|---|---|---|---|---|---|---|---|---|---|---|---|---|---|---|
| 1 | SA_G1_AND_S_PHASES | Cdk2, 4, and 6 bind cyclin D in G1, while cdk2/cyclin E promotes the G1/S transition. | ARF1, ARF3, CCND1, CDK2, CDK4, CDKN1A, CDKN1B, CDKN2A, CFL1, E2F1, E2F2, MDM2, NXT1, PRB1, TP53 | 15 | CDKN1B(2), PRB1(3), TP53(5) | 1062488 | 10 | 10 | 10 | 0 | 3 | 1 | 0 | 3 | 3 | 0 | 0.12 | 1.8e-07 | 0.00011 |
| 2 | HSA00564_GLYCEROPHOSPHOLIPID_METABOLISM | Genes involved in glycerophospholipid metabolism | ACHE, AGPAT1, AGPAT2, AGPAT3, AGPAT4, AGPAT6, ARD1A, CDIPT, CDS1, CDS2, CHAT, CHKA, CHKB, CHPT1, CRLS1, DGKA, DGKB, DGKD, DGKE, DGKG, DGKH, DGKI, DGKQ, DGKZ, ESCO1, ESCO2, ETNK1, ETNK2, GNPAT, GPAM, GPD1, GPD1L, GPD2, LCAT, LYCAT, LYPLA1, LYPLA2, LYPLA3, MYST3, MYST4, NAT5, NAT6, PCYT1A, PCYT1B, PEMT, PHOSPHO1, PISD, PLA2G10, PLA2G12A, PLA2G12B, PLA2G1B, PLA2G2A, PLA2G2D, PLA2G2E, PLA2G2F, PLA2G3, PLA2G4A, PLA2G5, PLA2G6, PLD1, PLD2, PNPLA3, PPAP2A, PPAP2B, PPAP2C, PTDSS1, PTDSS2, SH3GLB1 | 64 | AGPAT2(1), AGPAT3(1), CHAT(2), DGKD(1), DGKH(1), DGKI(1), DGKQ(2), ESCO1(3), GNPAT(1), MYST3(1), PEMT(1), PLA2G2A(1), PLA2G4A(1), PLA2G5(1), PLD1(1), PTDSS1(1) | 8241571 | 20 | 19 | 20 | 2 | 2 | 4 | 1 | 9 | 4 | 0 | 0.11 | 2.8e-06 | 0.00087 |
| 3 | PLK3PATHWAY | Active Plk3 phosphorylates CDC25c, blocking the G2/M transition, and phosphorylates p53 to induce apoptosis. | ATM, ATR, CDC25C, CHEK1, CHEK2, CNK, TP53, YWHAH | 7 | ATM(5), CHEK2(2), TP53(5) | 1994178 | 12 | 11 | 11 | 0 | 3 | 6 | 0 | 2 | 1 | 0 | 0.032 | 0.000016 | 0.0033 |
| 4 | SA_REG_CASCADE_OF_CYCLIN_EXPR | Expression of cyclins regulates progression through the cell cycle by activating cyclin-dependent kinases. | CCNA1, CCNA2, CCND1, CCNE1, CCNE2, CDK2, CDK4, CDKN1B, CDKN2A, E2F1, E2F2, E2F4, PRB1 | 13 | CCNA1(1), CCNE2(1), CDKN1B(2), PRB1(3) | 1130432 | 7 | 7 | 7 | 0 | 0 | 2 | 0 | 3 | 2 | 0 | 0.25 | 0.00015 | 0.023 |
| 5 | P53HYPOXIAPATHWAY | Hypoxia induces p53 accumulation and consequent apoptosis with p53-mediated cell cycle arrest, which is present under conditions of DNA damage. | ABCB1, AKT1, ATM, BAX, CDKN1A, CPB2, CSNK1A1, CSNK1D, FHL2, GADD45A, HIC1, HIF1A, HSPA1A, HSPCA, IGFBP3, MAPK8, MDM2, NFKBIB, NQO1, TP53 | 19 | ABCB1(2), AKT1(1), ATM(5), TP53(5) | 2602579 | 13 | 12 | 13 | 0 | 4 | 6 | 0 | 2 | 1 | 0 | 0.015 | 0.0003 | 0.037 |
| 6 | HSA00530_AMINOSUGARS_METABOLISM | Genes involved in aminosugars metabolism | AMDHD2, CHIA, CHIT1, CMAS, CTBS, CYB5R1, CYB5R3, GFPT1, GFPT2, GNE, GNPDA1, GNPDA2, GNPNAT1, HEXA, HEXB, HK1, HK2, HK3, LHPP, MTMR1, MTMR2, MTMR6, NAGK, NANS, NPL, PGM3, PHPT1, RENBP, UAP1 | 29 | AMDHD2(1), CHIA(1), GFPT2(1), GNPNAT1(1), HEXB(2), PGM3(1), RENBP(1) | 3576644 | 8 | 8 | 8 | 0 | 2 | 1 | 0 | 2 | 3 | 0 | 0.18 | 0.00044 | 0.043 |
| 7 | P53PATHWAY | p53 induces cell cycle arrest or apoptosis under conditions of DNA damage. | APAF1, ATM, BAX, BCL2, CCND1, CCNE1, CDK2, CDK4, CDKN1A, E2F1, GADD45A, MDM2, PCNA, RB1, TIMP3, TP53 | 16 | APAF1(1), ATM(5), TP53(5) | 2266716 | 11 | 10 | 11 | 0 | 3 | 5 | 0 | 2 | 1 | 0 | 0.034 | 0.00049 | 0.043 |
| 8 | ATRBRCAPATHWAY | BRCA1 and 2 block cell cycle progression in response to DNA damage and promote double-stranded break repair; mutations induce breast cancer susceptibility. | ATM, ATR, BRCA1, BRCA2, CHEK1, CHEK2, FANCA, FANCC, FANCD2, FANCE, FANCF, FANCG, HUS1, MRE11A, NBS1, RAD1, RAD17, RAD50, RAD51, RAD9A, TP53, TREX1 | 21 | ATM(5), BRCA2(3), CHEK2(2), FANCD2(2), FANCG(1), TP53(5) | 5495234 | 18 | 15 | 16 | 1 | 3 | 6 | 0 | 6 | 3 | 0 | 0.061 | 0.00073 | 0.052 |
| 9 | TERTPATHWAY | hTERC, the RNA subunit of telomerase, and hTERT, the catalytic protein subunit, are required for telomerase activity and are overexpressed in many cancers. | HDAC1, MAX, MYC, SP1, SP3, TP53, WT1, ZNF42 | 7 | SP1(1), TP53(5) | 879118 | 6 | 6 | 6 | 0 | 3 | 1 | 0 | 1 | 1 | 0 | 0.16 | 0.00076 | 0.052 |
| 10 | RBPATHWAY | The ATM protein kinase recognizes DNA damage and blocks cell cycle progression by phosphorylating chk1 and p53, which normally inhibits Rb to allow G1/S transitions. | ATM, CDC2, CDC25A, CDC25B, CDC25C, CDK2, CDK4, CHEK1, MYT1, RB1, TP53, WEE1, YWHAH | 12 | ATM(5), TP53(5) | 2195302 | 10 | 9 | 10 | 1 | 3 | 4 | 0 | 2 | 1 | 0 | 0.19 | 0.0013 | 0.074 |
Table 7. Get Full Table A Ranked List of Significantly Mutated Genesets (Excluding Significantly Mutated Genes). Number of significant genesets found: 0. Number of genesets displayed: 10
| rank | geneset | description | genes | N_genes | mut_tally | N | n | npat | nsite | nsil | n1 | n2 | n3 | n4 | n5 | n6 | p_ns_s | p | q |
|---|---|---|---|---|---|---|---|---|---|---|---|---|---|---|---|---|---|---|---|
| 1 | HSA00530_AMINOSUGARS_METABOLISM | Genes involved in aminosugars metabolism | AMDHD2, CHIA, CHIT1, CMAS, CTBS, CYB5R1, CYB5R3, GFPT1, GFPT2, GNE, GNPDA1, GNPDA2, GNPNAT1, HEXA, HEXB, HK1, HK2, HK3, LHPP, MTMR1, MTMR2, MTMR6, NAGK, NANS, NPL, PGM3, PHPT1, RENBP, UAP1 | 29 | AMDHD2(1), CHIA(1), GFPT2(1), GNPNAT1(1), HEXB(2), PGM3(1), RENBP(1) | 3576644 | 8 | 8 | 8 | 0 | 2 | 1 | 0 | 2 | 3 | 0 | 0.18 | 0.00044 | 0.27 |
| 2 | AMINOSUGARS_METABOLISM | CMAS, CYB5R3, GCK, GFPT1, GNE, GNPDA1, GNPDA2, HEXA, HEXB, HK1, HK2, HK3, PGM3, RENBP, UAP1 | 15 | GCK(1), HEXB(2), PGM3(1), RENBP(1) | 2107943 | 5 | 5 | 5 | 0 | 1 | 0 | 0 | 1 | 3 | 0 | 0.32 | 0.0026 | 0.73 | |
| 3 | SMALL_LIGAND_GPCRS | C9orf47, CNR1, CNR2, DNMT1, EDG1, EDG2, EDG5, EDG6, MTNR1A, MTNR1B, PTAFR, PTGDR, PTGER1, PTGER2, PTGER4, PTGFR, PTGIR, TBXA2R | 13 | DNMT1(3), MTNR1A(1), PTGER2(1), TBXA2R(2) | 1410721 | 7 | 7 | 7 | 1 | 3 | 2 | 0 | 1 | 1 | 0 | 0.19 | 0.0044 | 0.73 | |
| 4 | HSA03060_PROTEIN_EXPORT | Genes involved in protein export | OXA1L, SEC61A2, SRP19, SRP54, SRP68, SRP72, SRP9, SRPR | 8 | SEC61A2(1), SRP68(1), SRPR(1) | 933462 | 3 | 3 | 3 | 0 | 0 | 0 | 0 | 1 | 2 | 0 | 0.51 | 0.0069 | 0.73 |
| 5 | HSA00670_ONE_CARBON_POOL_BY_FOLATE | Genes involved in one carbon pool by folate | ALDH1L1, AMT, ATIC, DHFR, FTCD, GART, MTFMT, MTHFD1, MTHFD1L, MTHFD2, MTHFR, MTHFS, MTR, SHMT1, SHMT2, TYMS | 16 | DHFR(1), FTCD(2), GART(1), MTHFD1(1), MTHFD1L(1), MTHFR(1) | 2365631 | 7 | 7 | 7 | 0 | 0 | 2 | 0 | 2 | 3 | 0 | 0.21 | 0.007 | 0.73 |
| 6 | TRKAPATHWAY | Nerve growth factor (NGF) promotes neuronal survival and proliferation by binding its receptor TrkA, which activates PI3K/AKT, Ras, and the MAP kinase pathway. | AKT1, DPM2, GRB2, HRAS, KLK2, NGFB, NTRK1, PIK3CA, PIK3R1, PLCG1, PRKCA, PRKCB1, SHC1, SOS1 | 12 | AKT1(1), KLK2(1), NTRK1(2), PIK3CA(2) | 1940556 | 6 | 6 | 6 | 0 | 0 | 4 | 1 | 0 | 1 | 0 | 0.13 | 0.0093 | 0.73 |
| 7 | ETCPATHWAY | Energy is extracted from carbohydrates via oxidation and transferred to the mitochondrial electron transport chain, which couples ATP synthesis to the reduction of oxygen to water. | ATP5A1, CYCS, GPD2, MTCO1, NDUFA1, SDHA, SDHB, SDHC, SDHD, UQCRC1 | 9 | ATP5A1(1), SDHD(1), UQCRC1(1) | 823298 | 3 | 3 | 3 | 0 | 0 | 2 | 0 | 0 | 1 | 0 | 0.46 | 0.01 | 0.73 |
| 8 | HSA00564_GLYCEROPHOSPHOLIPID_METABOLISM | Genes involved in glycerophospholipid metabolism | ACHE, AGPAT1, AGPAT2, AGPAT3, AGPAT4, AGPAT6, ARD1A, CDIPT, CDS1, CDS2, CHAT, CHKA, CHKB, CHPT1, CRLS1, DGKA, DGKB, DGKD, DGKE, DGKG, DGKH, DGKI, DGKQ, DGKZ, ESCO1, ESCO2, ETNK1, ETNK2, GNPAT, GPAM, GPD1, GPD1L, GPD2, LCAT, LYCAT, LYPLA1, LYPLA2, LYPLA3, MYST3, MYST4, NAT5, NAT6, PCYT1A, PCYT1B, PEMT, PHOSPHO1, PISD, PLA2G10, PLA2G12A, PLA2G12B, PLA2G1B, PLA2G2A, PLA2G2D, PLA2G2E, PLA2G2F, PLA2G3, PLA2G4A, PLA2G5, PLA2G6, PLD1, PLD2, PNPLA3, PPAP2A, PPAP2B, PPAP2C, PTDSS1, PTDSS2, SH3GLB1 | 63 | AGPAT2(1), AGPAT3(1), CHAT(2), DGKD(1), DGKH(1), DGKI(1), DGKQ(2), GNPAT(1), MYST3(1), PEMT(1), PLA2G2A(1), PLA2G4A(1), PLA2G5(1), PLD1(1), PTDSS1(1) | 8029753 | 17 | 16 | 17 | 2 | 2 | 4 | 1 | 8 | 2 | 0 | 0.14 | 0.011 | 0.73 |
| 9 | HSA00830_RETINOL_METABOLISM | Genes involved in retinol metabolism | ALDH1A1, ALDH1A2, BCMO1, RDH5 | 4 | ALDH1A2(1), BCMO1(2) | 483292 | 3 | 3 | 2 | 0 | 0 | 2 | 0 | 1 | 0 | 0 | 0.37 | 0.011 | 0.73 |
| 10 | SIG_IL4RECEPTOR_IN_B_LYPHOCYTES | Genes related to IL4 rceptor signaling in B lymphocytes | AKT1, AKT2, AKT3, BAD, BCL2, GRB2, GSK3A, GSK3B, IL4R, IRS1, IRS2, JAK1, JAK3, MAP4K1, MAPK1, MAPK3, PDK1, PIK3CA, PIK3CD, PIK3R1, PPP1R13B, RAF1, SHC1, SOCS1, SOS1, SOS2, STAT6 | 27 | AKT1(1), GSK3A(1), IL4R(1), IRS1(1), IRS2(2), JAK1(3), MAP4K1(1), PDK1(1), PIK3CA(2), PPP1R13B(1) | 4578581 | 14 | 12 | 14 | 2 | 1 | 3 | 1 | 6 | 3 | 0 | 0.33 | 0.016 | 1 |
In brief, we tabulate the number of mutations and the number of covered bases for each gene. The counts are broken down by mutation context category: four context categories that are discovered by MutSig, and one for indel and 'null' mutations, which include indels, nonsense mutations, splice-site mutations, and non-stop (read-through) mutations. For each gene, we calculate the probability of seeing the observed constellation of mutations, i.e. the product P1 x P2 x ... x Pm, or a more extreme one, given the background mutation rates calculated across the dataset. [1]
This is an experimental feature. The full results of the analysis summarized in this report can be downloaded from the TCGA Data Coordination Center.