This pipeline computes the correlation between significant arm-level copy number variations (cnvs) and selected clinical features.
Testing the association between copy number variation 28 arm-level results and 5 clinical features across 166 patients, 4 significant findings detected with Q value < 0.25.
-
4p gain cnv correlated to 'Time to Death'.
-
4q gain cnv correlated to 'Time to Death'.
-
11p loss cnv correlated to 'Time to Death'.
-
11q loss cnv correlated to 'Time to Death'.
Table 1. Get Full Table Overview of the association between significant copy number variation of 28 arm-level results and 5 clinical features. Shown in the table are P values (Q values). Thresholded by Q value < 0.25, 4 significant findings detected.
|
Clinical Features |
Time to Death |
AGE | GENDER |
HISTOLOGICAL TYPE |
NEOADJUVANT THERAPY |
||
| nCNV (%) | nWild-Type | logrank test | t-test | Fisher's exact test | Fisher's exact test | Fisher's exact test | |
| 4p gain | 3 (2%) | 163 |
0.00014 (0.0193) |
0.122 (1.00) |
1 (1.00) |
0.756 (1.00) |
1 (1.00) |
| 4q gain | 3 (2%) | 163 |
0.00014 (0.0193) |
0.122 (1.00) |
1 (1.00) |
0.756 (1.00) |
1 (1.00) |
| 11p loss | 3 (2%) | 163 |
4.32e-08 (6.05e-06) |
0.102 (1.00) |
0.193 (1.00) |
0.756 (1.00) |
1 (1.00) |
| 11q loss | 4 (2%) | 162 |
4.32e-08 (6.05e-06) |
0.0592 (1.00) |
0.0691 (1.00) |
0.307 (1.00) |
1 (1.00) |
| 1q gain | 5 (3%) | 161 |
0.855 (1.00) |
0.193 (1.00) |
0.622 (1.00) |
0.323 (1.00) |
1 (1.00) |
| 5p gain | 6 (4%) | 160 |
0.00937 (1.00) |
0.0846 (1.00) |
1 (1.00) |
0.339 (1.00) |
1 (1.00) |
| 5q gain | 6 (4%) | 160 |
0.00937 (1.00) |
0.0846 (1.00) |
1 (1.00) |
0.339 (1.00) |
1 (1.00) |
| 7p gain | 6 (4%) | 160 |
0.743 (1.00) |
0.111 (1.00) |
1 (1.00) |
0.339 (1.00) |
1 (1.00) |
| 7q gain | 8 (5%) | 158 |
0.743 (1.00) |
0.0596 (1.00) |
0.443 (1.00) |
0.117 (1.00) |
1 (1.00) |
| 12p gain | 6 (4%) | 160 |
0.743 (1.00) |
0.403 (1.00) |
1 (1.00) |
0.339 (1.00) |
1 (1.00) |
| 12q gain | 6 (4%) | 160 |
0.743 (1.00) |
0.403 (1.00) |
1 (1.00) |
0.339 (1.00) |
1 (1.00) |
| 14q gain | 3 (2%) | 163 |
0.793 (1.00) |
0.629 (1.00) |
0.559 (1.00) |
0.756 (1.00) |
1 (1.00) |
| 16p gain | 6 (4%) | 160 |
0.793 (1.00) |
0.568 (1.00) |
0.185 (1.00) |
0.595 (1.00) |
1 (1.00) |
| 16q gain | 4 (2%) | 162 |
0.793 (1.00) |
0.402 (1.00) |
0.578 (1.00) |
0.832 (1.00) |
1 (1.00) |
| 17p gain | 6 (4%) | 160 |
0.743 (1.00) |
0.555 (1.00) |
0.185 (1.00) |
0.736 (1.00) |
1 (1.00) |
| 17q gain | 7 (4%) | 159 |
0.743 (1.00) |
0.773 (1.00) |
0.193 (1.00) |
0.848 (1.00) |
1 (1.00) |
| 20p gain | 4 (2%) | 162 |
0.743 (1.00) |
0.43 (1.00) |
0.578 (1.00) |
0.252 (1.00) |
1 (1.00) |
| 20q gain | 3 (2%) | 163 |
0.743 (1.00) |
0.6 (1.00) |
0.559 (1.00) |
0.756 (1.00) |
1 (1.00) |
| 2p loss | 5 (3%) | 161 |
1 (1.00) |
0.405 (1.00) |
1 (1.00) |
0.581 (1.00) |
1 (1.00) |
| 2q loss | 4 (2%) | 162 |
1 (1.00) |
0.0928 (1.00) |
1 (1.00) |
0.307 (1.00) |
1 (1.00) |
| 9q loss | 4 (2%) | 162 |
1 (1.00) |
0.08 (1.00) |
1 (1.00) |
0.502 (1.00) |
1 (1.00) |
| 10q loss | 3 (2%) | 163 |
0.855 (1.00) |
0.388 (1.00) |
0.193 (1.00) |
0.129 (1.00) |
1 (1.00) |
| 13q loss | 7 (4%) | 159 |
0.00225 (0.306) |
0.517 (1.00) |
0.405 (1.00) |
0.168 (1.00) |
1 (1.00) |
| 17p loss | 3 (2%) | 163 |
0.793 (1.00) |
0.871 (1.00) |
0.559 (1.00) |
0.756 (1.00) |
1 (1.00) |
| 18p loss | 3 (2%) | 163 |
1 (1.00) |
0.927 (1.00) |
0.559 (1.00) |
1 (1.00) |
1 (1.00) |
| 18q loss | 3 (2%) | 163 |
1 (1.00) |
0.927 (1.00) |
0.559 (1.00) |
1 (1.00) |
1 (1.00) |
| 21q loss | 3 (2%) | 163 |
1 (1.00) |
0.0278 (1.00) |
0.193 (1.00) |
1 (1.00) |
1 (1.00) |
| 22q loss | 25 (15%) | 141 |
0.855 (1.00) |
0.949 (1.00) |
1 (1.00) |
0.293 (1.00) |
1 (1.00) |
P value = 0.00014 (logrank test), Q value = 0.019
Table S1. Gene #2: '4p gain mutation analysis' versus Clinical Feature #1: 'Time to Death'
| nPatients | nDeath | Duration Range (Median), Month | |
|---|---|---|---|
| ALL | 166 | 1 | 0.1 - 66.1 (8.1) |
| 4P GAIN MUTATED | 3 | 1 | 6.9 - 39.8 (30.7) |
| 4P GAIN WILD-TYPE | 163 | 0 | 0.1 - 66.1 (8.1) |
Figure S1. Get High-res Image Gene #2: '4p gain mutation analysis' versus Clinical Feature #1: 'Time to Death'

P value = 0.00014 (logrank test), Q value = 0.019
Table S2. Gene #3: '4q gain mutation analysis' versus Clinical Feature #1: 'Time to Death'
| nPatients | nDeath | Duration Range (Median), Month | |
|---|---|---|---|
| ALL | 166 | 1 | 0.1 - 66.1 (8.1) |
| 4Q GAIN MUTATED | 3 | 1 | 6.9 - 39.8 (30.7) |
| 4Q GAIN WILD-TYPE | 163 | 0 | 0.1 - 66.1 (8.1) |
Figure S2. Get High-res Image Gene #3: '4q gain mutation analysis' versus Clinical Feature #1: 'Time to Death'
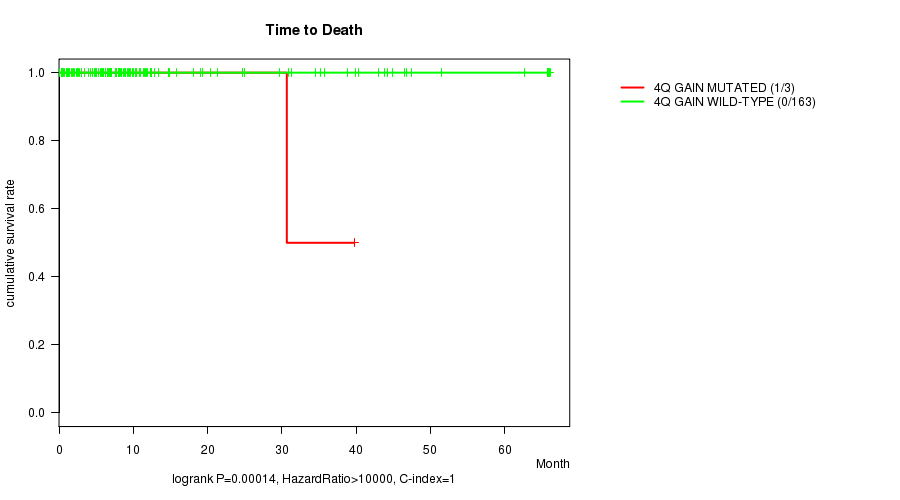
P value = 4.32e-08 (logrank test), Q value = 6e-06
Table S3. Gene #21: '11p loss mutation analysis' versus Clinical Feature #1: 'Time to Death'
| nPatients | nDeath | Duration Range (Median), Month | |
|---|---|---|---|
| ALL | 166 | 1 | 0.1 - 66.1 (8.1) |
| 11P LOSS MUTATED | 3 | 1 | 0.4 - 30.7 (6.9) |
| 11P LOSS WILD-TYPE | 163 | 0 | 0.1 - 66.1 (8.1) |
Figure S3. Get High-res Image Gene #21: '11p loss mutation analysis' versus Clinical Feature #1: 'Time to Death'

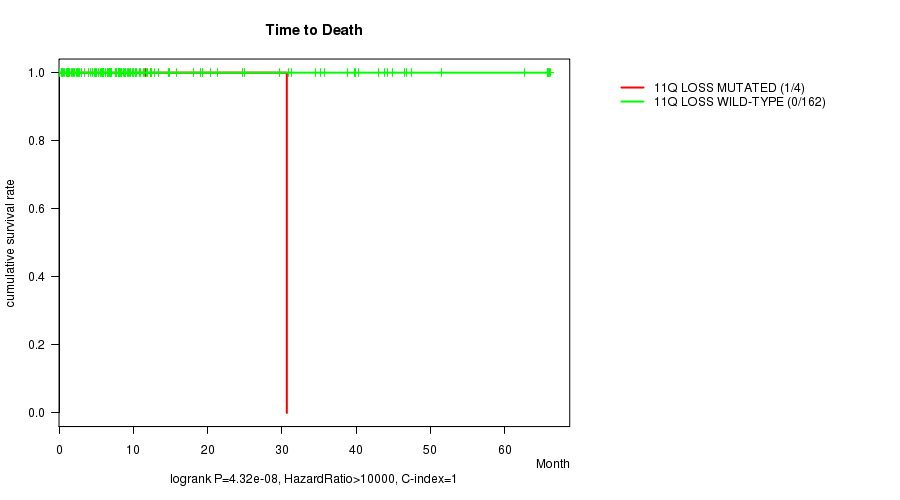
P value = 4.32e-08 (logrank test), Q value = 6e-06
Table S4. Gene #22: '11q loss mutation analysis' versus Clinical Feature #1: 'Time to Death'
| nPatients | nDeath | Duration Range (Median), Month | |
|---|---|---|---|
| ALL | 166 | 1 | 0.1 - 66.1 (8.1) |
| 11Q LOSS MUTATED | 4 | 1 | 0.4 - 30.7 (9.3) |
| 11Q LOSS WILD-TYPE | 162 | 0 | 0.1 - 66.1 (8.1) |
Figure S4. Get High-res Image Gene #22: '11q loss mutation analysis' versus Clinical Feature #1: 'Time to Death'
-
Mutation data file = broad_values_by_arm.mutsig.cluster.txt
-
Clinical data file = THCA.clin.merged.picked.txt
-
Number of patients = 166
-
Number of significantly arm-level cnvs = 28
-
Number of selected clinical features = 5
-
Exclude genes that fewer than K tumors have mutations, K = 3
For survival clinical features, the Kaplan-Meier survival curves of tumors with and without gene mutations were plotted and the statistical significance P values were estimated by logrank test (Bland and Altman 2004) using the 'survdiff' function in R
For continuous numerical clinical features, two-tailed Student's t test with unequal variance (Lehmann and Romano 2005) was applied to compare the clinical values between tumors with and without gene mutations using 't.test' function in R
For binary or multi-class clinical features (nominal or ordinal), two-tailed Fisher's exact tests (Fisher 1922) were used to estimate the P values using the 'fisher.test' function in R
For multiple hypothesis correction, Q value is the False Discovery Rate (FDR) analogue of the P value (Benjamini and Hochberg 1995), defined as the minimum FDR at which the test may be called significant. We used the 'Benjamini and Hochberg' method of 'p.adjust' function in R to convert P values into Q values.
This is an experimental feature. The full results of the analysis summarized in this report can be downloaded from the TCGA Data Coordination Center.