This report serves to describe the mutational landscape and properties of a given individual set, as well as rank genes and genesets according to mutational significance. MutSig v1.5 was used to generate the results found in this report.
Working with individual set: UCEC.
Number of patients in set: 248
The input for this pipeline is a set of individuals with the following files associated for each:
1. An annotated .maf file describing the mutations called for the respective individual, and their properties.
2. A .wig file that contains information about the coverage of the sample.
Significantly mutated genes (q ≤ 0.1): 157
Mutations seen in COSMIC: 1006
Significantly mutated genes in COSMIC territory: 47
Genes with clustered mutations (&le 3 aa apart): 2333
Significantly mutated genesets: 75
Significantly mutated genesets: (excluding sig. mutated genes): 0
Table 1. Get Full Table Table representing breakdown of mutations by type.
| type | count |
|---|---|
| Frame_Shift_Del | 1071 |
| Frame_Shift_Ins | 475 |
| In_Frame_Del | 765 |
| In_Frame_Ins | 146 |
| Missense_Mutation | 115579 |
| Nonsense_Mutation | 11940 |
| Nonstop_Mutation | 138 |
| Silent | 40149 |
| Splice_Site | 2655 |
| Total | 172918 |
Table 2. Get Full Table A breakdown of mutation rates per category discovered for this individual set.
| category | n | N | rate | rate_per_mb | relative_rate | exp_ns_s_ratio |
|---|---|---|---|---|---|---|
| *CpG->T | 38705 | 409266464 | 0.000095 | 95 | 5.4 | 2.1 |
| *Cp(A/C/T)->mut | 51453 | 3453658664 | 0.000015 | 15 | 0.85 | 3.3 |
| A->mut | 24338 | 3744388816 | 6.5e-06 | 6.5 | 0.37 | 3.9 |
| *CpG->(G/A) | 1083 | 409266464 | 2.6e-06 | 2.6 | 0.15 | 2.7 |
| indel+null | 16306 | 7607313944 | 2.1e-06 | 2.1 | 0.12 | NaN |
| double_null | 884 | 7607313944 | 1.2e-07 | 0.12 | 0.0067 | NaN |
| Total | 132769 | 7607313944 | 0.000017 | 17 | 1 | 3.5 |
The x axis represents the samples. The y axis represents the exons, one row per exon, and they are sorted by average coverage across samples. For exons with exactly the same average coverage, they are sorted next by the %GC of the exon. (The secondary sort is especially useful for the zero-coverage exons at the bottom).
Figure 1.
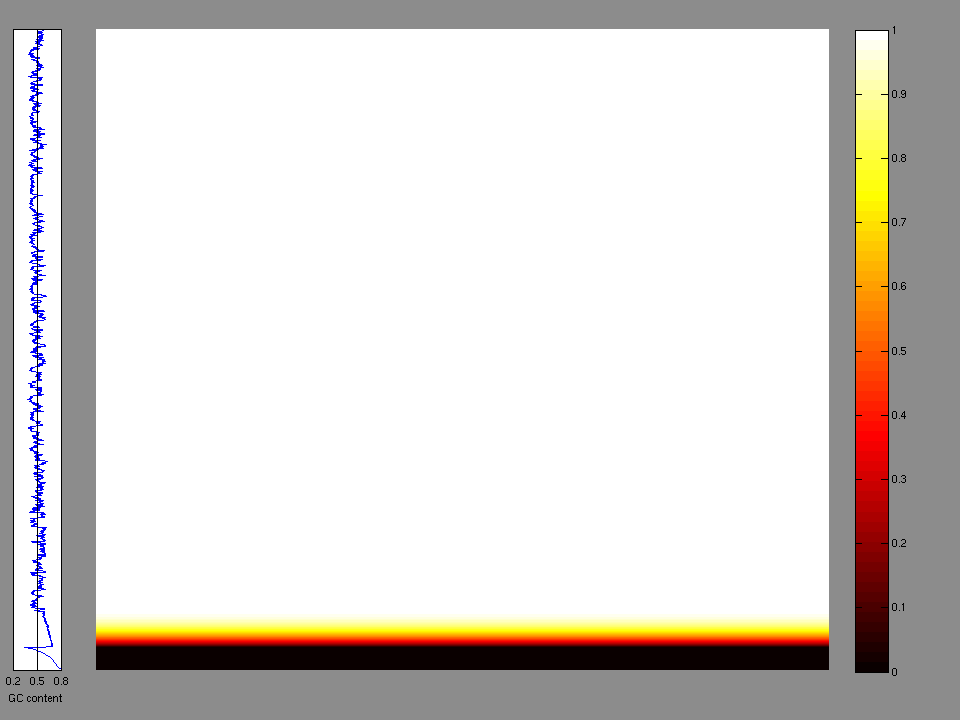
Figure 2.
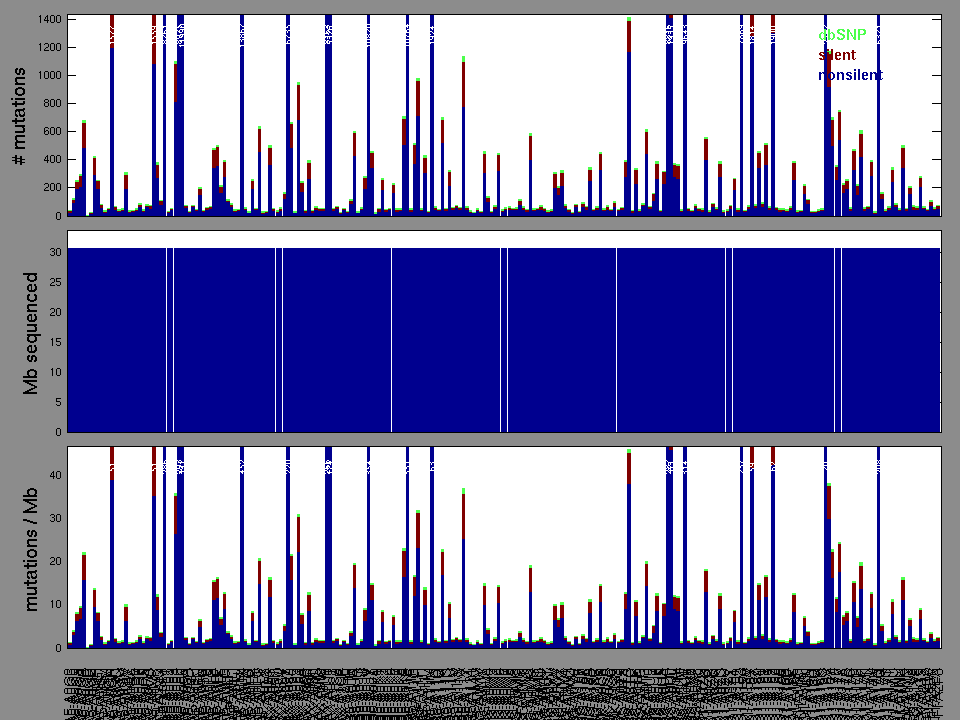
Figure 3. Get High-res Image The matrix in the center of the figure represents individual mutations in patient samples, color-coded by type of mutation, for the significantly mutated genes. The rate of synonymous and non-synonymous mutations is displayed at the top of the matrix. The barplot on the left of the matrix shows the number of mutations in each gene. The percentages represent the fraction of tumors with at least one mutation in the specified gene. The barplot to the right of the matrix displays the q-values for the most significantly mutated genes. The purple boxplots below the matrix (only displayed if required columns are present in the provided MAF) represent the distributions of allelic fractions observed in each sample. The plot at the bottom represents the base substitution distribution of individual samples, using the same categories that were used to calculate significance.
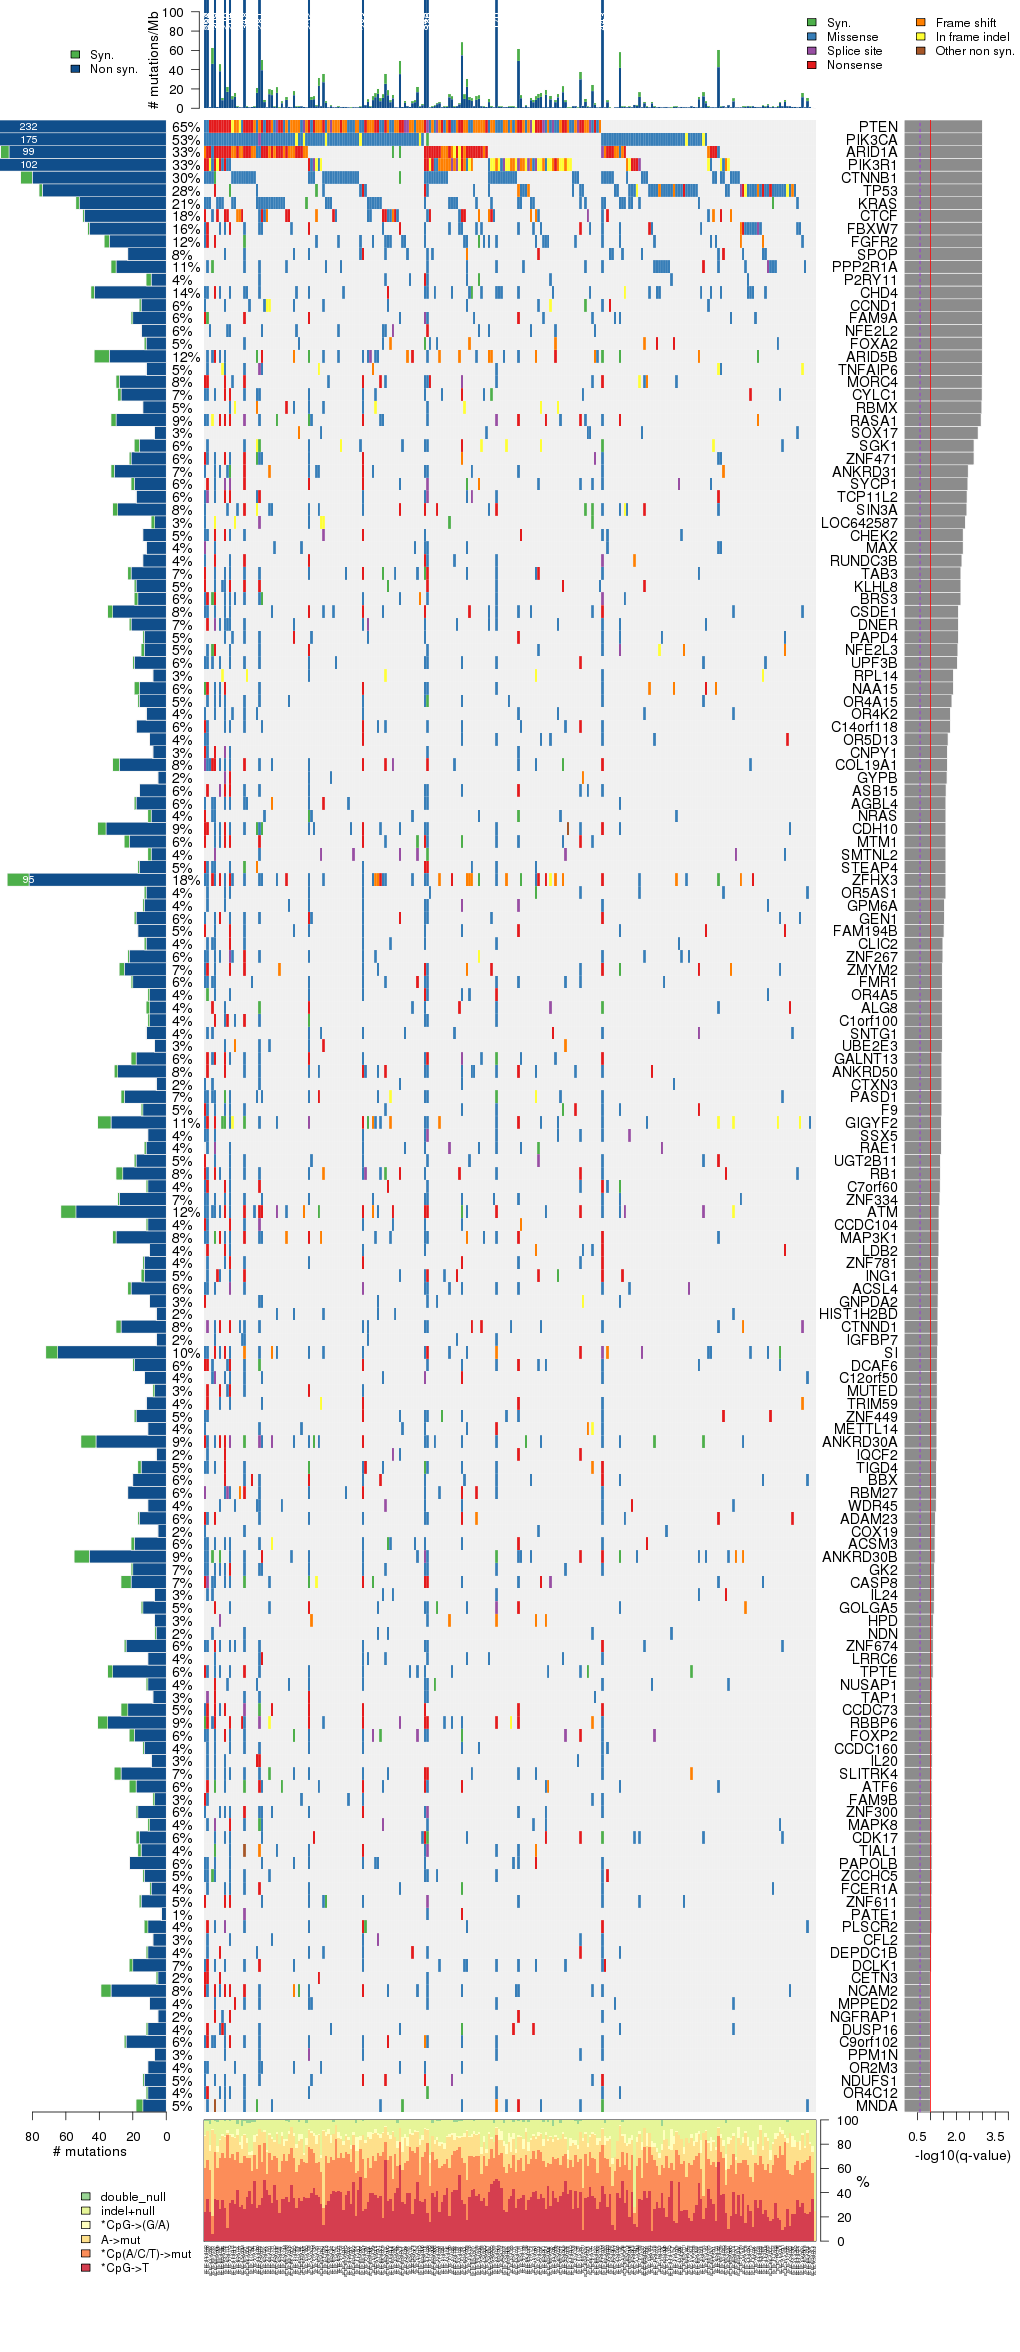
Table 3. Get Full Table A Ranked List of Significantly Mutated Genes. Number of significant genes found: 157. Number of genes displayed: 35
| rank | gene | description | N | n | npat | nsite | nsil | n1 | n2 | n3 | n4 | n5 | n6 | p_ns_s | p | q |
|---|---|---|---|---|---|---|---|---|---|---|---|---|---|---|---|---|
| 1 | PTEN | phosphatase and tensin homolog (mutated in multiple advanced cancers 1) | 309504 | 227 | 161 | 134 | 5 | 19 | 29 | 21 | 33 | 98 | 27 | 4.9e-12 | <1.00e-15 | <1.83e-12 |
| 2 | PIK3CA | phosphoinositide-3-kinase, catalytic, alpha polypeptide | 815176 | 172 | 132 | 76 | 3 | 31 | 61 | 68 | 3 | 9 | 0 | 2.1e-11 | <1.00e-15 | <1.83e-12 |
| 3 | ARID1A | AT rich interactive domain 1A (SWI-like) | 1428976 | 94 | 83 | 79 | 5 | 2 | 7 | 5 | 1 | 65 | 14 | 0.00015 | <1.00e-15 | <1.83e-12 |
| 4 | PIK3R1 | phosphoinositide-3-kinase, regulatory subunit 1 (alpha) | 585280 | 100 | 83 | 77 | 2 | 4 | 4 | 13 | 1 | 63 | 15 | 0.0021 | <1.00e-15 | <1.83e-12 |
| 5 | CTNNB1 | catenin (cadherin-associated protein), beta 1, 88kDa | 595696 | 80 | 74 | 25 | 7 | 5 | 61 | 14 | 0 | 0 | 0 | 0.0034 | <1.00e-15 | <1.83e-12 |
| 6 | TP53 | tumor protein p53 | 317688 | 74 | 69 | 50 | 2 | 23 | 18 | 15 | 1 | 17 | 0 | 2.8e-06 | <1.00e-15 | <1.83e-12 |
| 7 | KRAS | v-Ki-ras2 Kirsten rat sarcoma viral oncogene homolog | 175336 | 52 | 52 | 11 | 2 | 1 | 46 | 4 | 1 | 0 | 0 | 0.0067 | <1.00e-15 | <1.83e-12 |
| 8 | CTCF | CCCTC-binding factor (zinc finger protein) | 551552 | 49 | 45 | 39 | 1 | 8 | 4 | 7 | 0 | 28 | 2 | 0.00095 | <1.00e-15 | <1.83e-12 |
| 9 | FBXW7 | F-box and WD repeat domain containing 7 | 640832 | 46 | 39 | 30 | 1 | 22 | 12 | 2 | 1 | 8 | 1 | 0.00048 | <1.00e-15 | <1.83e-12 |
| 10 | FGFR2 | fibroblast growth factor receptor 2 (bacteria-expressed kinase, keratinocyte growth factor receptor, craniofacial dysostosis 1, Crouzon syndrome, Pfeiffer syndrome, Jackson-Weiss syndrome) | 691920 | 34 | 31 | 19 | 3 | 3 | 5 | 13 | 9 | 3 | 1 | 0.0097 | <1.00e-15 | <1.83e-12 |
| 11 | SPOP | speckle-type POZ protein | 287928 | 23 | 21 | 18 | 0 | 5 | 8 | 6 | 0 | 4 | 0 | 0.0041 | 1.11e-15 | 1.85e-12 |
| 12 | PPP2R1A | protein phosphatase 2 (formerly 2A), regulatory subunit A , alpha isoform | 453840 | 30 | 27 | 18 | 3 | 10 | 17 | 1 | 0 | 2 | 0 | 0.0023 | 5.44e-15 | 8.29e-12 |
| 13 | P2RY11 | purinergic receptor P2Y, G-protein coupled, 11 | 5704 | 9 | 9 | 9 | 3 | 3 | 4 | 0 | 1 | 1 | 0 | 0.3 | 6.34e-12 | 8.91e-09 |
| 14 | CHD4 | chromodomain helicase DNA binding protein 4 | 1460720 | 43 | 35 | 38 | 2 | 16 | 16 | 8 | 0 | 2 | 1 | 0.0046 | 2.01e-10 | 2.63e-07 |
| 15 | CCND1 | cyclin D1 | 222952 | 15 | 15 | 13 | 1 | 1 | 7 | 3 | 0 | 4 | 0 | 0.084 | 3.17e-10 | 3.86e-07 |
| 16 | FAM9A | family with sequence similarity 9, member A | 255688 | 20 | 14 | 20 | 1 | 2 | 12 | 1 | 0 | 4 | 1 | 0.096 | 1.12e-09 | 1.28e-06 |
| 17 | NFE2L2 | nuclear factor (erythroid-derived 2)-like 2 | 449872 | 15 | 15 | 12 | 0 | 2 | 3 | 5 | 3 | 2 | 0 | 0.016 | 5.83e-09 | 6.27e-06 |
| 18 | FOXA2 | forkhead box A2 | 227912 | 12 | 12 | 12 | 1 | 1 | 3 | 2 | 0 | 6 | 0 | 0.27 | 7.77e-09 | 7.90e-06 |
| 19 | ARID5B | AT rich interactive domain 5B (MRF1-like) | 894536 | 34 | 29 | 34 | 9 | 5 | 5 | 8 | 2 | 13 | 1 | 0.57 | 9.03e-09 | 8.69e-06 |
| 20 | TNFAIP6 | tumor necrosis factor, alpha-induced protein 6 | 212784 | 12 | 12 | 8 | 0 | 2 | 4 | 0 | 0 | 6 | 0 | 0.18 | 1.20e-08 | 0.000011 |
| 21 | MORC4 | MORC family CW-type zinc finger 4 | 685472 | 28 | 20 | 26 | 2 | 6 | 10 | 1 | 0 | 11 | 0 | 0.083 | 2.65e-08 | 0.000023 |
| 22 | CYLC1 | cylicin, basic protein of sperm head cytoskeleton 1 | 490048 | 27 | 18 | 27 | 2 | 0 | 16 | 7 | 0 | 4 | 0 | 0.13 | 3.37e-08 | 0.000028 |
| 23 | RBMX | RNA binding motif protein, X-linked | 313224 | 14 | 13 | 8 | 0 | 1 | 4 | 2 | 0 | 7 | 0 | 0.3 | 9.23e-08 | 0.000073 |
| 24 | RASA1 | RAS p21 protein activator (GTPase activating protein) 1 | 807488 | 30 | 22 | 28 | 3 | 5 | 9 | 4 | 0 | 11 | 1 | 0.084 | 1.52e-07 | 0.00012 |
| 25 | SOX17 | SRY (sex determining region Y)-box 17 | 91512 | 7 | 7 | 3 | 0 | 0 | 6 | 0 | 0 | 1 | 0 | 0.15 | 6.26e-07 | 0.00046 |
| 26 | SGK1 | serum/glucocorticoid regulated kinase 1 | 480376 | 16 | 15 | 14 | 3 | 2 | 5 | 1 | 1 | 7 | 0 | 0.52 | 1.51e-06 | 0.0011 |
| 27 | ZNF471 | zinc finger protein 471 | 470456 | 21 | 15 | 16 | 1 | 0 | 12 | 3 | 0 | 6 | 0 | 0.13 | 1.67e-06 | 0.0011 |
| 28 | ANKRD31 | ankyrin repeat domain 31 | 553040 | 31 | 17 | 31 | 2 | 1 | 17 | 9 | 0 | 3 | 1 | 0.066 | 3.81e-06 | 0.0025 |
| 29 | SYCP1 | synaptonemal complex protein 1 | 757640 | 19 | 16 | 19 | 2 | 1 | 7 | 2 | 0 | 6 | 3 | 0.43 | 4.23e-06 | 0.0027 |
| 30 | TCP11L2 | t-complex 11 (mouse)-like 2 | 395808 | 18 | 14 | 18 | 0 | 3 | 5 | 3 | 0 | 7 | 0 | 0.011 | 4.82e-06 | 0.0029 |
| 31 | SIN3A | SIN3 homolog A, transcription regulator (yeast) | 967696 | 29 | 21 | 27 | 3 | 5 | 7 | 7 | 0 | 10 | 0 | 0.13 | 5.09e-06 | 0.0030 |
| 32 | LOC642587 | 79112 | 7 | 7 | 4 | 2 | 1 | 1 | 0 | 0 | 5 | 0 | 0.8 | 6.10e-06 | 0.0035 | |
| 33 | CHEK2 | CHK2 checkpoint homolog (S. pombe) | 351912 | 14 | 13 | 13 | 0 | 0 | 4 | 5 | 0 | 5 | 0 | 0.039 | 8.14e-06 | 0.0045 |
| 34 | MAX | MYC associated factor X | 209064 | 12 | 11 | 8 | 0 | 3 | 3 | 5 | 0 | 1 | 0 | 0.048 | 8.32e-06 | 0.0045 |
| 35 | RUNDC3B | RUN domain containing 3B | 340752 | 14 | 11 | 12 | 0 | 1 | 4 | 3 | 0 | 6 | 0 | 0.044 | 9.98e-06 | 0.0052 |
Note:
N - number of sequenced bases in this gene across the individual set.
n - number of (nonsilent) mutations in this gene across the individual set.
npat - number of patients (individuals) with at least one nonsilent mutation.
nsite - number of unique sites having a non-silent mutation.
nsil - number of silent mutations in this gene across the individual set.
n1 - number of nonsilent mutations of type: *CpG->T .
n2 - number of nonsilent mutations of type: *Cp(A/C/T)->mut .
n3 - number of nonsilent mutations of type: A->mut .
n4 - number of nonsilent mutations of type: *CpG->(G/A) .
n5 - number of nonsilent mutations of type: indel+null .
null - mutation category that includes nonsense, frameshift, splice-site mutations
p_classic = p-value for the observed amount of nonsilent mutations being elevated in this gene
p_ns_s = p-value for the observed nonsilent/silent ratio being elevated in this gene
p = p-value (overall)
q = q-value, False Discovery Rate (Benjamini-Hochberg procedure)
In this analysis, COSMIC is used as a filter to increase power by restricting the territory of each gene. Cosmic version: v48.
Table 4. Get Full Table Significantly mutated genes (COSMIC territory only). To access the database please go to: COSMIC. Number of significant genes found: 47. Number of genes displayed: 10
| rank | gene | description | n | cos | n_cos | N_cos | cos_ev | p | q |
|---|---|---|---|---|---|---|---|---|---|
| 1 | PIK3R1 | phosphoinositide-3-kinase, regulatory subunit 1 (alpha) | 100 | 33 | 39 | 8184 | 111 | 0 | 0 |
| 2 | KRAS | v-Ki-ras2 Kirsten rat sarcoma viral oncogene homolog | 52 | 51 | 48 | 12648 | 554391 | 0 | 0 |
| 3 | PIK3CA | phosphoinositide-3-kinase, catalytic, alpha polypeptide | 172 | 184 | 150 | 45632 | 35669 | 0 | 0 |
| 4 | CTNNB1 | catenin (cadherin-associated protein), beta 1, 88kDa | 80 | 101 | 67 | 25048 | 23813 | 0 | 0 |
| 5 | FGFR2 | fibroblast growth factor receptor 2 (bacteria-expressed kinase, keratinocyte growth factor receptor, craniofacial dysostosis 1, Crouzon syndrome, Pfeiffer syndrome, Jackson-Weiss syndrome) | 34 | 49 | 24 | 12152 | 113 | 0 | 0 |
| 6 | FBXW7 | F-box and WD repeat domain containing 7 | 46 | 91 | 29 | 22568 | 852 | 0 | 0 |
| 7 | PTEN | phosphatase and tensin homolog (mutated in multiple advanced cancers 1) | 227 | 728 | 218 | 180544 | 14938 | 0 | 0 |
| 8 | TP53 | tumor protein p53 | 74 | 308 | 72 | 76384 | 24186 | 0 | 0 |
| 9 | NRAS | neuroblastoma RAS viral (v-ras) oncogene homolog | 9 | 28 | 6 | 6944 | 6490 | 4e-09 | 2e-06 |
| 10 | RB1 | retinoblastoma 1 (including osteosarcoma) | 26 | 267 | 11 | 66216 | 30 | 4.3e-08 | 0.000019 |
Note:
n - number of (nonsilent) mutations in this gene across the individual set.
cos = number of unique mutated sites in this gene in COSMIC
n_cos = overlap between n and cos.
N_cos = number of individuals times cos.
cos_ev = total evidence: number of reports in COSMIC for mutations seen in this gene.
p = p-value for seeing the observed amount of overlap in this gene)
q = q-value, False Discovery Rate (Benjamini-Hochberg procedure)
Table 5. Get Full Table Genes with Clustered Mutations
| num | gene | desc | n | mindist | nmuts0 | nmuts3 | nmuts12 | npairs0 | npairs3 | npairs12 |
|---|---|---|---|---|---|---|---|---|---|---|
| 11550 | PTEN | phosphatase and tensin homolog (mutated in multiple advanced cancers 1) | 227 | 0 | 1569 | 2050 | 2930 | 1569 | 2050 | 2930 |
| 7591 | KRAS | v-Ki-ras2 Kirsten rat sarcoma viral oncogene homolog | 52 | 0 | 661 | 949 | 994 | 661 | 949 | 994 |
| 10793 | PIK3CA | phosphoinositide-3-kinase, catalytic, alpha polypeptide | 172 | 0 | 573 | 1075 | 1553 | 573 | 1075 | 1553 |
| 3516 | CTNNB1 | catenin (cadherin-associated protein), beta 1, 88kDa | 80 | 0 | 434 | 1165 | 2176 | 434 | 1165 | 2176 |
| 14928 | TP53 | tumor protein p53 | 74 | 0 | 89 | 167 | 417 | 89 | 167 | 417 |
| 5243 | FGFR2 | fibroblast growth factor receptor 2 (bacteria-expressed kinase, keratinocyte growth factor receptor, craniofacial dysostosis 1, Crouzon syndrome, Pfeiffer syndrome, Jackson-Weiss syndrome) | 34 | 0 | 56 | 56 | 78 | 56 | 56 | 78 |
| 5154 | FBXW7 | F-box and WD repeat domain containing 7 | 46 | 0 | 50 | 53 | 68 | 50 | 53 | 68 |
| 11062 | POLE | polymerase (DNA directed), epsilon | 47 | 0 | 39 | 42 | 60 | 39 | 42 | 60 |
| 11232 | PPP2R1A | protein phosphatase 2 (formerly 2A), regulatory subunit A , alpha isoform | 30 | 0 | 37 | 48 | 77 | 37 | 48 | 77 |
| 15264 | TTN | titin | 525 | 0 | 35 | 53 | 104 | 35 | 53 | 104 |
Note:
n - number of mutations in this gene in the individual set.
mindist - distance (in aa) between closest pair of mutations in this gene
npairs3 - how many pairs of mutations are within 3 aa of each other.
npairs12 - how many pairs of mutations are within 12 aa of each other.
Table 6. Get Full Table A Ranked List of Significantly Mutated Genesets. (Source: MSigDB GSEA Cannonical Pathway Set).Number of significant genesets found: 75. Number of genesets displayed: 10
| rank | geneset | description | genes | N_genes | mut_tally | N | n | npat | nsite | nsil | n1 | n2 | n3 | n4 | n5 | n6 | p_ns_s | p | q |
|---|---|---|---|---|---|---|---|---|---|---|---|---|---|---|---|---|---|---|---|
| 1 | ARFPATHWAY | Cyclin-dependent kinase inhibitor 2A is a tumor suppressor that induces G1 arrest and can activate the p53 pathway, leading to G2/M arrest. | ABL1, CDKN2A, E2F1, MDM2, MYC, PIK3CA, PIK3R1, POLR1A, POLR1B, POLR1C, POLR1D, RAC1, RB1, TBX2, TP53, TWIST1 | 16 | ABL1(8), CDKN2A(2), E2F1(9), MDM2(4), MYC(8), PIK3CA(172), PIK3R1(100), POLR1A(16), POLR1B(16), POLR1C(2), POLR1D(3), RAC1(1), RB1(26), TBX2(2), TP53(74), TWIST1(1) | 7247552 | 444 | 223 | 300 | 50 | 87 | 115 | 119 | 6 | 99 | 18 | 3.94e-10 | <1.00e-15 | <1.31e-14 |
| 2 | MTORPATHWAY | Mammalian target of rapamycin (mTOR) senses mitogenic factors and nutrients, including ATP, and induces cell proliferation. | AKT1, EIF3S10, EIF4A1, EIF4A2, EIF4B, EIF4E, EIF4EBP1, EIF4G1, EIF4G2, EIF4G3, FKBP1A, FRAP1, MKNK1, PDK2, PDPK1, PIK3CA, PIK3R1, PPP2CA, PTEN, RPS6, RPS6KB1, TSC1, TSC2 | 21 | AKT1(4), EIF4A1(5), EIF4A2(9), EIF4B(7), EIF4E(2), EIF4G1(15), EIF4G2(7), EIF4G3(24), FKBP1A(1), MKNK1(3), PDK2(5), PDPK1(3), PIK3CA(172), PIK3R1(100), PPP2CA(6), PTEN(227), RPS6(7), RPS6KB1(5), TSC1(13), TSC2(15) | 10458408 | 630 | 218 | 417 | 44 | 90 | 141 | 126 | 38 | 191 | 44 | <1.00e-15 | <1.00e-15 | <1.31e-14 |
| 3 | IGF1MTORPATHWAY | Growth factor IGF-1 activates AKT, Gsk3-beta, and mTOR to promote muscle hypertrophy. | AKT1, EIF2B5, EIF2S1, EIF2S2, EIF2S3, EIF4E, EIF4EBP1, FRAP1, GSK3B, IGF1, IGF1R, INPPL1, PDK2, PDPK1, PIK3CA, PIK3R1, PPP2CA, PTEN, RPS6, RPS6KB1 | 19 | AKT1(4), EIF2B5(5), EIF2S1(2), EIF2S2(9), EIF2S3(6), EIF4E(2), GSK3B(13), IGF1(5), IGF1R(13), INPPL1(19), PDK2(5), PDPK1(3), PIK3CA(172), PIK3R1(100), PPP2CA(6), PTEN(227), RPS6(7), RPS6KB1(5) | 7335096 | 603 | 217 | 388 | 46 | 79 | 131 | 117 | 40 | 194 | 42 | <1.00e-15 | <1.00e-15 | <1.31e-14 |
| 4 | METPATHWAY | The hepatocyte growth factor receptor c-Met stimulates proliferation and alters cell motility and adhesion on binding the ligand HGF. | ACTA1, CRK, CRKL, DOCK1, ELK1, FOS, GAB1, GRB2, GRF2, HGF, HRAS, ITGA1, ITGB1, JUN, MAP2K1, MAP2K2, MAP4K1, MAPK1, MAPK3, MAPK8, MET, PAK1, PIK3CA, PIK3R1, PTEN, PTK2, PTK2B, PTPN11, PXN, RAF1, RAP1A, RAP1B, RASA1, SOS1, SRC, STAT3 | 35 | ACTA1(5), CRK(2), CRKL(6), DOCK1(24), ELK1(3), FOS(3), GAB1(8), GRB2(3), HGF(14), HRAS(1), ITGA1(17), ITGB1(8), JUN(1), MAP2K1(2), MAP2K2(5), MAP4K1(11), MAPK1(2), MAPK3(3), MAPK8(10), MET(17), PAK1(3), PIK3CA(172), PIK3R1(100), PTEN(227), PTK2(12), PTK2B(16), PTPN11(8), PXN(6), RAF1(8), RAP1A(4), RAP1B(2), RASA1(30), SOS1(13), SRC(3), STAT3(10) | 17110264 | 759 | 217 | 538 | 93 | 134 | 188 | 148 | 37 | 208 | 44 | 3.89e-15 | <1.00e-15 | <1.31e-14 |
| 5 | SIG_INSULIN_RECEPTOR_PATHWAY_IN_CARDIAC_MYOCYTES | Genes related to the insulin receptor pathway | AKT1, AKT2, AKT3, BRD4, CAP1, CBL, CDC42, CDKN2A, F2RL2, FLOT1, FLOT2, FOXO1A, GRB2, GSK3A, GSK3B, IGFBP1, INPPL1, IRS1, IRS2, IRS4, LNPEP, MAPK1, MAPK3, PARD3, PARD6A, PDK1, PIK3CA, PIK3CD, PIK3R1, PPYR1, PSCD3, PTEN, PTPN1, RAF1, RPS6KA1, RPS6KA2, RPS6KA3, RPS6KB1, SERPINB6, SFN, SHC1, SLC2A4, SORBS1, SOS1, SOS2, YWHAB, YWHAE, YWHAG, YWHAH, YWHAQ, YWHAZ | 47 | AKT1(4), AKT2(6), AKT3(11), BRD4(10), CAP1(7), CBL(12), CDC42(4), CDKN2A(2), F2RL2(2), FLOT2(2), GRB2(3), GSK3A(10), GSK3B(13), IGFBP1(4), INPPL1(19), IRS1(13), IRS4(21), LNPEP(10), MAPK1(2), MAPK3(3), PARD3(19), PDK1(2), PIK3CA(172), PIK3CD(12), PIK3R1(100), PPYR1(8), PTEN(227), PTPN1(5), RAF1(8), RPS6KA1(1), RPS6KA2(14), RPS6KA3(19), RPS6KB1(5), SERPINB6(3), SHC1(7), SLC2A4(9), SORBS1(18), SOS1(13), SOS2(17), YWHAE(4), YWHAG(3), YWHAH(3), YWHAQ(1), YWHAZ(1) | 21082232 | 829 | 217 | 605 | 120 | 160 | 197 | 174 | 40 | 214 | 44 | 5.04e-12 | <1.00e-15 | <1.31e-14 |
| 6 | EIF4PATHWAY | The eIF-4F complex recognizes 5' mRNA caps, recruits RNA helicases, and maintains mRNA-ribosome bridging. | AKT1, EIF4A1, EIF4A2, EIF4E, EIF4EBP1, EIF4G1, EIF4G2, EIF4G3, FRAP1, GHR, IRS1, MAPK1, MAPK14, MAPK3, MKNK1, PABPC1, PDK2, PDPK1, PIK3CA, PIK3R1, PRKCA, PRKCB1, PTEN, RPS6KB1 | 22 | AKT1(4), EIF4A1(5), EIF4A2(9), EIF4E(2), EIF4G1(15), EIF4G2(7), EIF4G3(24), GHR(8), IRS1(13), MAPK1(2), MAPK14(4), MAPK3(3), MKNK1(3), PABPC1(11), PDK2(5), PDPK1(3), PIK3CA(172), PIK3R1(100), PRKCA(10), PTEN(227), RPS6KB1(5) | 10435840 | 632 | 216 | 418 | 49 | 91 | 134 | 133 | 39 | 191 | 44 | <1.00e-15 | <1.00e-15 | <1.31e-14 |
| 7 | SIG_PIP3_SIGNALING_IN_CARDIAC_MYOCTES | Genes related to PIP3 signaling in cardiac myocytes | AKT1, AKT2, AKT3, BAD, BCL2L1, CDC42, CDK2, CDKN1B, CDKN2A, CREB1, CREB3, CREB5, EBP, ERBB4, F2RL2, FOXO3A, FRAP1, GAB1, GADD45A, GRB2, GSK3A, GSK3B, IFI27, IGF1, IGFBP1, INPPL1, IRS1, IRS2, IRS4, MET, MYC, NOLC1, P101-PI3K, PAK1, PAK2, PAK3, PAK4, PAK6, PAK7, PARD3, PARD6A, PDK1, PIK3CA, PIK3CD, PPP1R13B, PREX1, PSCD3, PTEN, PTK2, PTPN1, RPS6KA1, RPS6KA2, RPS6KA3, RPS6KB1, SFN, SHC1, SLC2A4, SOS1, SOS2, TSC1, TSC2, YWHAB, YWHAE, YWHAG, YWHAH, YWHAQ, YWHAZ | 62 | AKT1(4), AKT2(6), AKT3(11), BAD(2), BCL2L1(4), CDC42(4), CDK2(2), CDKN1B(7), CDKN2A(2), CREB1(6), CREB5(5), EBP(2), ERBB4(27), F2RL2(2), GAB1(8), GRB2(3), GSK3A(10), GSK3B(13), IGF1(5), IGFBP1(4), INPPL1(19), IRS1(13), IRS4(21), MET(17), MYC(8), NOLC1(14), PAK1(3), PAK2(3), PAK3(17), PAK6(4), PAK7(9), PARD3(19), PDK1(2), PIK3CA(172), PIK3CD(12), PPP1R13B(9), PREX1(25), PTEN(227), PTK2(12), PTPN1(5), RPS6KA1(1), RPS6KA2(14), RPS6KA3(19), RPS6KB1(5), SHC1(7), SLC2A4(9), SOS1(13), SOS2(17), TSC1(13), TSC2(15), YWHAE(4), YWHAG(3), YWHAH(3), YWHAQ(1), YWHAZ(1) | 27949352 | 863 | 216 | 660 | 148 | 188 | 253 | 185 | 41 | 166 | 30 | 9.72e-12 | <1.00e-15 | <1.31e-14 |
| 8 | PTENPATHWAY | PTEN suppresses AKT-induced cell proliferation and antagonizes the action of PI3K. | AKT1, BCAR1, CDKN1B, FOXO3A, GRB2, ILK, ITGB1, MAPK1, MAPK3, PDK2, PDPK1, PIK3CA, PIK3R1, PTEN, PTK2, SHC1, SOS1, TNFSF6 | 16 | AKT1(4), BCAR1(8), CDKN1B(7), GRB2(3), ILK(5), ITGB1(8), MAPK1(2), MAPK3(3), PDK2(5), PDPK1(3), PIK3CA(172), PIK3R1(100), PTEN(227), PTK2(12), SHC1(7), SOS1(13) | 7174392 | 579 | 213 | 364 | 30 | 72 | 121 | 124 | 37 | 183 | 42 | <1.00e-15 | <1.00e-15 | <1.31e-14 |
| 9 | SIG_PIP3_SIGNALING_IN_B_LYMPHOCYTES | Genes related to PIP3 signaling in B lymphocytes | AKT1, AKT2, AKT3, BCR, BTK, CD19, CDKN2A, DAPP1, FLOT1, FLOT2, FOXO3A, GAB1, ITPR1, ITPR2, ITPR3, LYN, NR0B2, P101-PI3K, PDK1, PHF11, PIK3CA, PITX2, PLCG2, PPP1R13B, PREX1, PSCD3, PTEN, PTPRC, RPS6KA1, RPS6KA2, RPS6KA3, RPS6KB1, SAG, SYK, TEC, VAV1 | 32 | AKT1(4), AKT2(6), AKT3(11), BCR(6), BTK(12), CD19(4), CDKN2A(2), DAPP1(9), FLOT2(2), GAB1(8), ITPR1(36), ITPR2(35), ITPR3(21), LYN(9), NR0B2(2), PDK1(2), PHF11(5), PIK3CA(172), PITX2(12), PLCG2(29), PPP1R13B(9), PREX1(25), PTEN(227), PTPRC(17), RPS6KA1(1), RPS6KA2(14), RPS6KA3(19), RPS6KB1(5), SAG(10), SYK(4), TEC(8), VAV1(12) | 20541344 | 738 | 212 | 540 | 128 | 147 | 231 | 144 | 38 | 149 | 29 | 5.04e-10 | <1.00e-15 | <1.31e-14 |
| 10 | ST_PHOSPHOINOSITIDE_3_KINASE_PATHWAY | The phosphoinositide-3 kinase pathway produces the lipid second messenger PIP3 and regulates cell growth, survival, and movement. | A1BG, AKT1, AKT2, AKT3, BAD, BTK, CDKN2A, CSL4, DAF, DAPP1, FOXO1A, GRB2, GSK3A, GSK3B, IARS, IGFBP1, INPP5D, P14, PDK1, PIK3CA, PPP1R13B, PSCD3, PTEN, RPS6KA1, RPS6KA2, RPS6KA3, RPS6KB1, SFN, SHC1, SOS1, SOS2, TEC, YWHAB, YWHAE, YWHAG, YWHAH, YWHAQ, YWHAZ | 33 | A1BG(3), AKT1(4), AKT2(6), AKT3(11), BAD(2), BTK(12), CDKN2A(2), DAPP1(9), GRB2(3), GSK3A(10), GSK3B(13), IARS(8), IGFBP1(4), INPP5D(9), PDK1(2), PIK3CA(172), PPP1R13B(9), PTEN(227), RPS6KA1(1), RPS6KA2(14), RPS6KA3(19), RPS6KB1(5), SHC1(7), SOS1(13), SOS2(17), TEC(8), YWHAE(4), YWHAG(3), YWHAH(3), YWHAQ(1), YWHAZ(1) | 13352320 | 602 | 211 | 404 | 65 | 112 | 161 | 131 | 37 | 133 | 28 | 1.22e-15 | <1.00e-15 | <1.31e-14 |
Table 7. Get Full Table A Ranked List of Significantly Mutated Genesets (Excluding Significantly Mutated Genes). Number of significant genesets found: 0. Number of genesets displayed: 10
| rank | geneset | description | genes | N_genes | mut_tally | N | n | npat | nsite | nsil | n1 | n2 | n3 | n4 | n5 | n6 | p_ns_s | p | q |
|---|---|---|---|---|---|---|---|---|---|---|---|---|---|---|---|---|---|---|---|
| 1 | IL17PATHWAY | Activated T cells secrete IL-17, which stimulates fibroblasts and other cells to secrete inflammatory and hematopoietic cytokines. | CD2, CD34, CD3D, CD3E, CD3G, CD3Z, CD4, CD58, CD8A, CSF3, IL17, IL3, IL6, IL8, KITLG, TRA@, TRB@ | 13 | CD2(4), CD34(1), CD3D(6), CD3E(2), CD3G(3), CD4(6), CD58(2), CD8A(2), CSF3(1), IL3(2), IL6(5), IL8(3), KITLG(3) | 2324752 | 40 | 27 | 40 | 9 | 6 | 20 | 4 | 0 | 10 | 0 | 0.18 | 0.063 | 1 |
| 2 | VOBESITYPATHWAY | The adipose tissue of obese individuals overexpresses a key glucocorticoid-metabolizing enzyme, activating inactive circulating corticosteroids and inducing insulin resistance. | APM1, HSD11B1, LPL, NR3C1, PPARG, RETN, RXRA, TNF | 7 | HSD11B1(6), LPL(16), NR3C1(18), PPARG(6), RETN(1), RXRA(3) | 2006320 | 50 | 24 | 49 | 9 | 12 | 20 | 7 | 1 | 10 | 0 | 0.027 | 0.11 | 1 |
| 3 | TCRMOLECULE | T Cell Receptor and CD3 Complex | CD3D, CD3E, CD3G, CD3Z, TRA@, TRB@ | 3 | CD3D(6), CD3E(2), CD3G(3) | 437720 | 11 | 7 | 11 | 1 | 1 | 7 | 0 | 0 | 3 | 0 | 0.18 | 0.13 | 1 |
| 4 | HSA00627_1,4_DICHLOROBENZENE_DEGRADATION | Genes involved in 1,4-dichlorobenzene degradation | CMBL | 1 | CMBL(3) | 187984 | 3 | 3 | 3 | 1 | 0 | 1 | 0 | 1 | 1 | 0 | 0.81 | 0.14 | 1 |
| 5 | HSA00031_INOSITOL_METABOLISM | Genes involved in inositol metabolism | ALDH6A1, TPI1 | 2 | ALDH6A1(6), TPI1(2) | 594208 | 8 | 7 | 8 | 1 | 0 | 3 | 1 | 0 | 4 | 0 | 0.28 | 0.17 | 1 |
| 6 | HIFPATHWAY | Under normal conditions, hypoxia inducible factor HIF-1 is degraded; under hypoxic conditions, it activates transcription of genes controlled by hpoxic response elements (HREs). | ARNT, ASPH, COPS5, CREB1, EDN1, EP300, EPO, HIF1A, HSPCA, JUN, LDHA, NOS3, P4HB, VEGF, VHL | 13 | ARNT(5), ASPH(13), COPS5(5), CREB1(6), EDN1(4), EP300(32), EPO(2), HIF1A(16), JUN(1), LDHA(8), NOS3(11), P4HB(6), VHL(3) | 6388976 | 112 | 46 | 111 | 16 | 32 | 32 | 26 | 2 | 20 | 0 | 0.00048 | 0.22 | 1 |
| 7 | IL5PATHWAY | Pro-inflammatory IL-5 is secretes by activated T cells, eosinophils, and mast cells, and stimulates the proliferation and activation of eosinophils in bone marrow. | CCL11, CCR3, CD4, HLA-DRA, HLA-DRB1, IL1B, IL4, IL5, IL5RA, IL6 | 9 | CCR3(4), CD4(6), IL1B(2), IL4(1), IL5(2), IL5RA(9), IL6(5) | 1760056 | 29 | 21 | 27 | 8 | 3 | 13 | 3 | 0 | 10 | 0 | 0.31 | 0.22 | 1 |
| 8 | PEPIPATHWAY | Proepithelin (PEPI) induces epithelial cells to secrete IL-8, which promotes elastase secretion by neutrophils. | ELA1, ELA2, ELA2A, ELA2B, ELA3B, GRN, IL8, SLPI | 3 | GRN(5), IL8(3), SLPI(2) | 635128 | 10 | 10 | 9 | 0 | 2 | 5 | 2 | 0 | 1 | 0 | 0.057 | 0.25 | 1 |
| 9 | LDLPATHWAY | Low density lipoproteins (LDL) are present in blood plasma, contain cholesterol and triglycerides, and contribute to atherogenic plaque formation. | ACAT1, CCL2, CSF1, IL6, LDLR, LPL | 6 | ACAT1(6), CSF1(6), IL6(5), LDLR(6), LPL(16) | 1950272 | 39 | 23 | 39 | 7 | 10 | 15 | 9 | 0 | 5 | 0 | 0.057 | 0.3 | 1 |
| 10 | TCAPOPTOSISPATHWAY | HIV infection upregulates Fas ligand in macrophages and CD4 in helper T cells, leading to widespread Fas-induced T cell apoptosis. | CCR5, CD28, CD3D, CD3E, CD3G, CD3Z, CD4, TNFRSF6, TNFSF6, TRA@, TRB@ | 6 | CCR5(6), CD28(3), CD3D(6), CD3E(2), CD3G(3), CD4(6) | 1218920 | 26 | 16 | 26 | 6 | 3 | 16 | 0 | 0 | 7 | 0 | 0.26 | 0.31 | 1 |
In brief, we tabulate the number of mutations and the number of covered bases for each gene. The counts are broken down by mutation context category: four context categories that are discovered by MutSig, and one for indel and 'null' mutations, which include indels, nonsense mutations, splice-site mutations, and non-stop (read-through) mutations. For each gene, we calculate the probability of seeing the observed constellation of mutations, i.e. the product P1 x P2 x ... x Pm, or a more extreme one, given the background mutation rates calculated across the dataset. [1]
This is an experimental feature. The full results of the analysis summarized in this report can be downloaded from the TCGA Data Coordination Center.