This pipeline computes the correlation between significant arm-level copy number variations (cnvs) and selected clinical features.
Testing the association between copy number variation 80 arm-level results and 5 clinical features across 838 patients, one significant finding detected with Q value < 0.25.
-
16q loss cnv correlated to 'AGE'.
Table 1. Get Full Table Overview of the association between significant copy number variation of 80 arm-level results and 5 clinical features. Shown in the table are P values (Q values). Thresholded by Q value < 0.25, one significant finding detected.
|
Clinical Features |
Time to Death |
AGE | GENDER |
RADIATIONS RADIATION REGIMENINDICATION |
NEOADJUVANT THERAPY |
||
| nCNV (%) | nWild-Type | logrank test | t-test | Fisher's exact test | Fisher's exact test | Fisher's exact test | |
| 16q loss | 362 (43%) | 476 |
0.0269 (1.00) |
0.000381 (0.152) |
1 (1.00) |
0.512 (1.00) |
0.424 (1.00) |
| 1p gain | 90 (11%) | 748 |
0.175 (1.00) |
0.371 (1.00) |
1 (1.00) |
0.025 (1.00) |
0.0483 (1.00) |
| 1q gain | 448 (53%) | 390 |
0.0771 (1.00) |
0.27 (1.00) |
1 (1.00) |
0.289 (1.00) |
0.885 (1.00) |
| 2p gain | 47 (6%) | 791 |
0.768 (1.00) |
0.616 (1.00) |
1 (1.00) |
0.482 (1.00) |
0.755 (1.00) |
| 2q gain | 25 (3%) | 813 |
0.984 (1.00) |
0.947 (1.00) |
1 (1.00) |
0.00679 (1.00) |
0.0946 (1.00) |
| 3p gain | 49 (6%) | 789 |
0.838 (1.00) |
0.0902 (1.00) |
1 (1.00) |
0.604 (1.00) |
0.759 (1.00) |
| 3q gain | 93 (11%) | 745 |
0.32 (1.00) |
0.842 (1.00) |
0.608 (1.00) |
1 (1.00) |
0.819 (1.00) |
| 4p gain | 29 (3%) | 809 |
0.0699 (1.00) |
0.475 (1.00) |
1 (1.00) |
0.509 (1.00) |
0.432 (1.00) |
| 4q gain | 27 (3%) | 811 |
0.0264 (1.00) |
0.351 (1.00) |
1 (1.00) |
1 (1.00) |
1 (1.00) |
| 5p gain | 156 (19%) | 682 |
0.0671 (1.00) |
0.0261 (1.00) |
0.677 (1.00) |
0.0362 (1.00) |
0.116 (1.00) |
| 5q gain | 96 (11%) | 742 |
0.226 (1.00) |
0.00259 (1.00) |
1 (1.00) |
0.124 (1.00) |
0.311 (1.00) |
| 6p gain | 93 (11%) | 745 |
0.877 (1.00) |
0.136 (1.00) |
1 (1.00) |
0.0132 (1.00) |
0.209 (1.00) |
| 6q gain | 58 (7%) | 780 |
0.274 (1.00) |
0.0561 (1.00) |
0.477 (1.00) |
0.633 (1.00) |
0.888 (1.00) |
| 7p gain | 150 (18%) | 688 |
0.882 (1.00) |
0.0815 (1.00) |
0.0118 (1.00) |
0.0257 (1.00) |
0.0244 (1.00) |
| 7q gain | 108 (13%) | 730 |
0.471 (1.00) |
0.515 (1.00) |
0.0197 (1.00) |
0.0145 (1.00) |
0.00993 (1.00) |
| 8p gain | 156 (19%) | 682 |
0.744 (1.00) |
0.107 (1.00) |
0.677 (1.00) |
0.676 (1.00) |
1 (1.00) |
| 8q gain | 357 (43%) | 481 |
0.726 (1.00) |
0.0168 (1.00) |
0.507 (1.00) |
0.0485 (1.00) |
0.827 (1.00) |
| 9p gain | 65 (8%) | 773 |
0.487 (1.00) |
0.542 (1.00) |
1 (1.00) |
0.286 (1.00) |
0.347 (1.00) |
| 9q gain | 52 (6%) | 786 |
0.716 (1.00) |
0.297 (1.00) |
1 (1.00) |
0.0624 (1.00) |
0.551 (1.00) |
| 10p gain | 105 (13%) | 733 |
0.818 (1.00) |
0.687 (1.00) |
0.612 (1.00) |
0.325 (1.00) |
0.514 (1.00) |
| 10q gain | 44 (5%) | 794 |
0.718 (1.00) |
0.343 (1.00) |
1 (1.00) |
0.201 (1.00) |
0.0238 (1.00) |
| 11p gain | 62 (7%) | 776 |
0.661 (1.00) |
0.838 (1.00) |
0.501 (1.00) |
0.643 (1.00) |
1 (1.00) |
| 11q gain | 44 (5%) | 794 |
0.0515 (1.00) |
0.828 (1.00) |
1 (1.00) |
0.855 (1.00) |
1 (1.00) |
| 12p gain | 110 (13%) | 728 |
0.792 (1.00) |
0.394 (1.00) |
0.021 (1.00) |
0.228 (1.00) |
0.457 (1.00) |
| 12q gain | 83 (10%) | 755 |
0.164 (1.00) |
0.112 (1.00) |
0.0507 (1.00) |
0.342 (1.00) |
0.81 (1.00) |
| 13q gain | 44 (5%) | 794 |
0.816 (1.00) |
0.923 (1.00) |
1 (1.00) |
0.584 (1.00) |
0.873 (1.00) |
| 14q gain | 75 (9%) | 763 |
0.25 (1.00) |
0.531 (1.00) |
1 (1.00) |
0.322 (1.00) |
0.615 (1.00) |
| 15q gain | 43 (5%) | 795 |
0.615 (1.00) |
0.757 (1.00) |
0.379 (1.00) |
0.194 (1.00) |
0.0744 (1.00) |
| 16p gain | 234 (28%) | 604 |
0.613 (1.00) |
0.027 (1.00) |
1 (1.00) |
0.414 (1.00) |
0.263 (1.00) |
| 16q gain | 53 (6%) | 785 |
0.186 (1.00) |
0.77 (1.00) |
0.446 (1.00) |
1 (1.00) |
0.143 (1.00) |
| 17p gain | 44 (5%) | 794 |
0.612 (1.00) |
0.473 (1.00) |
0.0091 (1.00) |
1 (1.00) |
1 (1.00) |
| 17q gain | 117 (14%) | 721 |
0.8 (1.00) |
0.902 (1.00) |
0.0259 (1.00) |
0.814 (1.00) |
0.0978 (1.00) |
| 18p gain | 82 (10%) | 756 |
0.0614 (1.00) |
0.0343 (1.00) |
0.606 (1.00) |
0.0397 (1.00) |
0.904 (1.00) |
| 18q gain | 70 (8%) | 768 |
0.136 (1.00) |
0.407 (1.00) |
0.546 (1.00) |
0.107 (1.00) |
0.606 (1.00) |
| 19p gain | 65 (8%) | 773 |
0.13 (1.00) |
0.26 (1.00) |
0.15 (1.00) |
0.0476 (1.00) |
0.687 (1.00) |
| 19q gain | 80 (10%) | 758 |
0.0206 (1.00) |
0.659 (1.00) |
0.209 (1.00) |
0.405 (1.00) |
0.807 (1.00) |
| 20p gain | 229 (27%) | 609 |
0.0458 (1.00) |
0.0869 (1.00) |
0.0683 (1.00) |
0.855 (1.00) |
0.747 (1.00) |
| 20q gain | 263 (31%) | 575 |
0.149 (1.00) |
0.405 (1.00) |
0.149 (1.00) |
0.599 (1.00) |
0.816 (1.00) |
| 21q gain | 98 (12%) | 740 |
0.045 (1.00) |
0.0329 (1.00) |
1 (1.00) |
0.0564 (1.00) |
0.433 (1.00) |
| 22q gain | 38 (5%) | 800 |
0.819 (1.00) |
0.35 (1.00) |
1 (1.00) |
0.846 (1.00) |
1 (1.00) |
| Xq gain | 20 (2%) | 818 |
0.123 (1.00) |
0.109 (1.00) |
1 (1.00) |
0.282 (1.00) |
1 (1.00) |
| 1p loss | 112 (13%) | 726 |
0.235 (1.00) |
0.00888 (1.00) |
1 (1.00) |
0.339 (1.00) |
0.0906 (1.00) |
| 1q loss | 20 (2%) | 818 |
0.997 (1.00) |
0.627 (1.00) |
1 (1.00) |
0.795 (1.00) |
0.814 (1.00) |
| 2p loss | 71 (8%) | 767 |
0.963 (1.00) |
0.198 (1.00) |
1 (1.00) |
0.38 (1.00) |
0.7 (1.00) |
| 2q loss | 85 (10%) | 753 |
0.758 (1.00) |
0.356 (1.00) |
0.61 (1.00) |
0.42 (1.00) |
0.812 (1.00) |
| 3p loss | 89 (11%) | 749 |
0.0182 (1.00) |
0.0418 (1.00) |
0.609 (1.00) |
0.428 (1.00) |
0.559 (1.00) |
| 3q loss | 45 (5%) | 793 |
0.113 (1.00) |
0.0677 (1.00) |
1 (1.00) |
0.0687 (1.00) |
0.873 (1.00) |
| 4p loss | 175 (21%) | 663 |
0.471 (1.00) |
0.265 (1.00) |
1 (1.00) |
0.162 (1.00) |
0.0266 (1.00) |
| 4q loss | 146 (17%) | 692 |
0.492 (1.00) |
0.868 (1.00) |
0.372 (1.00) |
0.283 (1.00) |
0.184 (1.00) |
| 5p loss | 68 (8%) | 770 |
0.124 (1.00) |
0.0875 (1.00) |
0.535 (1.00) |
1 (1.00) |
0.187 (1.00) |
| 5q loss | 119 (14%) | 719 |
0.436 (1.00) |
0.119 (1.00) |
0.623 (1.00) |
0.727 (1.00) |
0.0499 (1.00) |
| 6p loss | 107 (13%) | 731 |
0.267 (1.00) |
0.0795 (1.00) |
0.613 (1.00) |
0.272 (1.00) |
0.914 (1.00) |
| 6q loss | 164 (20%) | 674 |
0.931 (1.00) |
0.00479 (1.00) |
0.218 (1.00) |
0.15 (1.00) |
0.717 (1.00) |
| 7p loss | 46 (5%) | 792 |
0.538 (1.00) |
0.393 (1.00) |
1 (1.00) |
0.283 (1.00) |
0.528 (1.00) |
| 7q loss | 61 (7%) | 777 |
0.135 (1.00) |
0.184 (1.00) |
1 (1.00) |
0.433 (1.00) |
0.678 (1.00) |
| 8p loss | 262 (31%) | 576 |
0.00314 (1.00) |
0.478 (1.00) |
1 (1.00) |
0.725 (1.00) |
1 (1.00) |
| 8q loss | 42 (5%) | 796 |
0.0039 (1.00) |
0.704 (1.00) |
1 (1.00) |
0.853 (1.00) |
0.621 (1.00) |
| 9p loss | 181 (22%) | 657 |
0.00975 (1.00) |
0.938 (1.00) |
0.415 (1.00) |
0.553 (1.00) |
0.0548 (1.00) |
| 9q loss | 139 (17%) | 699 |
0.0173 (1.00) |
0.61 (1.00) |
0.175 (1.00) |
1 (1.00) |
0.0656 (1.00) |
| 10p loss | 70 (8%) | 768 |
0.0761 (1.00) |
0.351 (1.00) |
1 (1.00) |
0.769 (1.00) |
0.195 (1.00) |
| 10q loss | 106 (13%) | 732 |
0.00524 (1.00) |
0.622 (1.00) |
0.612 (1.00) |
0.714 (1.00) |
0.196 (1.00) |
| 11p loss | 132 (16%) | 706 |
0.0256 (1.00) |
0.385 (1.00) |
0.368 (1.00) |
1 (1.00) |
0.323 (1.00) |
| 11q loss | 216 (26%) | 622 |
0.291 (1.00) |
0.636 (1.00) |
0.0542 (1.00) |
0.515 (1.00) |
0.46 (1.00) |
| 12p loss | 65 (8%) | 773 |
0.0923 (1.00) |
0.949 (1.00) |
0.518 (1.00) |
0.545 (1.00) |
0.282 (1.00) |
| 12q loss | 50 (6%) | 788 |
0.22 (1.00) |
0.189 (1.00) |
1 (1.00) |
0.491 (1.00) |
0.448 (1.00) |
| 13q loss | 252 (30%) | 586 |
0.0663 (1.00) |
0.158 (1.00) |
0.464 (1.00) |
0.79 (1.00) |
0.754 (1.00) |
| 14q loss | 125 (15%) | 713 |
0.00889 (1.00) |
0.165 (1.00) |
0.37 (1.00) |
0.82 (1.00) |
0.189 (1.00) |
| 15q loss | 152 (18%) | 686 |
0.233 (1.00) |
0.15 (1.00) |
0.377 (1.00) |
0.398 (1.00) |
0.852 (1.00) |
| 16p loss | 51 (6%) | 787 |
0.691 (1.00) |
0.966 (1.00) |
0.0994 (1.00) |
1 (1.00) |
0.881 (1.00) |
| 17p loss | 352 (42%) | 486 |
0.358 (1.00) |
0.0414 (1.00) |
0.741 (1.00) |
0.161 (1.00) |
0.243 (1.00) |
| 17q loss | 138 (16%) | 700 |
0.641 (1.00) |
0.269 (1.00) |
0.369 (1.00) |
0.913 (1.00) |
0.56 (1.00) |
| 18p loss | 166 (20%) | 672 |
0.0067 (1.00) |
0.00141 (0.562) |
1 (1.00) |
0.759 (1.00) |
0.928 (1.00) |
| 18q loss | 166 (20%) | 672 |
0.0449 (1.00) |
0.00105 (0.42) |
1 (1.00) |
0.609 (1.00) |
0.418 (1.00) |
| 19p loss | 67 (8%) | 771 |
0.584 (1.00) |
0.338 (1.00) |
1 (1.00) |
0.296 (1.00) |
0.507 (1.00) |
| 19q loss | 54 (6%) | 784 |
0.885 (1.00) |
0.906 (1.00) |
1 (1.00) |
0.74 (1.00) |
0.559 (1.00) |
| 20p loss | 48 (6%) | 790 |
0.00149 (0.592) |
0.844 (1.00) |
0.413 (1.00) |
1 (1.00) |
0.217 (1.00) |
| 20q loss | 25 (3%) | 813 |
0.803 (1.00) |
0.935 (1.00) |
1 (1.00) |
0.813 (1.00) |
0.0354 (1.00) |
| 21q loss | 84 (10%) | 754 |
0.989 (1.00) |
0.74 (1.00) |
0.61 (1.00) |
0.893 (1.00) |
0.0551 (1.00) |
| 22q loss | 284 (34%) | 554 |
0.136 (1.00) |
0.871 (1.00) |
0.176 (1.00) |
0.0584 (1.00) |
1 (1.00) |
| Xq loss | 31 (4%) | 807 |
0.0598 (1.00) |
0.596 (1.00) |
0.0406 (1.00) |
0.671 (1.00) |
1 (1.00) |
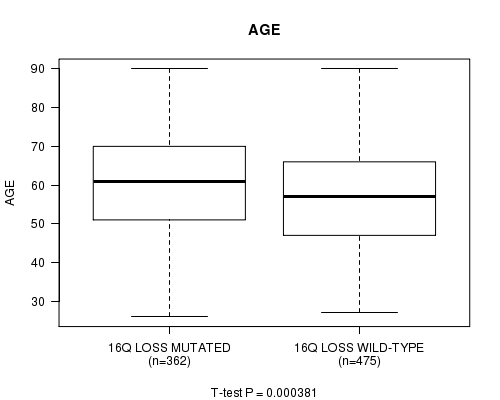
P value = 0.000381 (t-test), Q value = 0.15
Table S1. Gene #69: '16q loss mutation analysis' versus Clinical Feature #2: 'AGE'
| nPatients | Mean (Std.Dev) | |
|---|---|---|
| ALL | 837 | 58.5 (13.2) |
| 16Q LOSS MUTATED | 362 | 60.3 (13.0) |
| 16Q LOSS WILD-TYPE | 475 | 57.1 (13.3) |
Figure S1. Get High-res Image Gene #69: '16q loss mutation analysis' versus Clinical Feature #2: 'AGE'
-
Mutation data file = broad_values_by_arm.mutsig.cluster.txt
-
Clinical data file = BRCA.clin.merged.picked.txt
-
Number of patients = 838
-
Number of significantly arm-level cnvs = 80
-
Number of selected clinical features = 5
-
Exclude genes that fewer than K tumors have mutations, K = 3
For survival clinical features, the Kaplan-Meier survival curves of tumors with and without gene mutations were plotted and the statistical significance P values were estimated by logrank test (Bland and Altman 2004) using the 'survdiff' function in R
For continuous numerical clinical features, two-tailed Student's t test with unequal variance (Lehmann and Romano 2005) was applied to compare the clinical values between tumors with and without gene mutations using 't.test' function in R
For binary or multi-class clinical features (nominal or ordinal), two-tailed Fisher's exact tests (Fisher 1922) were used to estimate the P values using the 'fisher.test' function in R
For multiple hypothesis correction, Q value is the False Discovery Rate (FDR) analogue of the P value (Benjamini and Hochberg 1995), defined as the minimum FDR at which the test may be called significant. We used the 'Benjamini and Hochberg' method of 'p.adjust' function in R to convert P values into Q values.
This is an experimental feature. The full results of the analysis summarized in this report can be downloaded from the TCGA Data Coordination Center.