This pipeline uses various statistical tests to identify mRNAs whose expression levels correlated to selected clinical features.
Testing the association between 17814 genes and 5 clinical features across 529 samples, statistically thresholded by Q value < 0.05, 5 clinical features related to at least one genes.
-
2 genes correlated to 'Time to Death'.
-
RPS26 , PPP1R14D
-
416 genes correlated to 'AGE'.
-
ESR1 , CNTNAP3 , KLK6 , KRT17 , MAGED4B , ...
-
6 genes correlated to 'GENDER'.
-
PI3 , TMEM16C , CACNG1 , RP13-36C9.6 , MAPK4 , ...
-
3 genes correlated to 'RADIATIONS.RADIATION.REGIMENINDICATION'.
-
OR13C4 , CYP3A5 , TMEM92
-
11 genes correlated to 'NEOADJUVANT.THERAPY'.
-
ZCCHC7 , DUSP1 , C2ORF60 , RGS1 , EGR1 , ...
Complete statistical result table is provided in Supplement Table 1
Table 1. Get Full Table This table shows the clinical features, statistical methods used, and the number of genes that are significantly associated with each clinical feature at Q value < 0.05.
| Clinical feature | Statistical test | Significant genes | Associated with | Associated with | ||
|---|---|---|---|---|---|---|
| Time to Death | Cox regression test | N=2 | shorter survival | N=2 | longer survival | N=0 |
| AGE | Spearman correlation test | N=416 | older | N=199 | younger | N=217 |
| GENDER | t test | N=6 | male | N=1 | female | N=5 |
| RADIATIONS RADIATION REGIMENINDICATION | t test | N=3 | yes | N=3 | no | N=0 |
| NEOADJUVANT THERAPY | t test | N=11 | yes | N=5 | no | N=6 |
Table S1. Basic characteristics of clinical feature: 'Time to Death'
| Time to Death | Duration (Months) | 0.1-223.4 (median=24.1) |
| censored | N = 432 | |
| death | N = 65 | |
| Significant markers | N = 2 | |
| associated with shorter survival | 2 | |
| associated with longer survival | 0 |
Table S2. Get Full Table List of 2 genes significantly associated with 'Time to Death' by Cox regression test
| HazardRatio | Wald_P | Q | C_index | |
|---|---|---|---|---|
| RPS26 | 2.7 | 9.669e-08 | 0.0017 | 0.682 |
| PPP1R14D | 2.3 | 2.876e-07 | 0.0051 | 0.592 |
Figure S1. Get High-res Image As an example, this figure shows the association of RPS26 to 'Time to Death'. four curves present the cumulative survival rates of 4 quartile subsets of patients. P value = 9.67e-08 with univariate Cox regression analysis using continuous log-2 expression values.
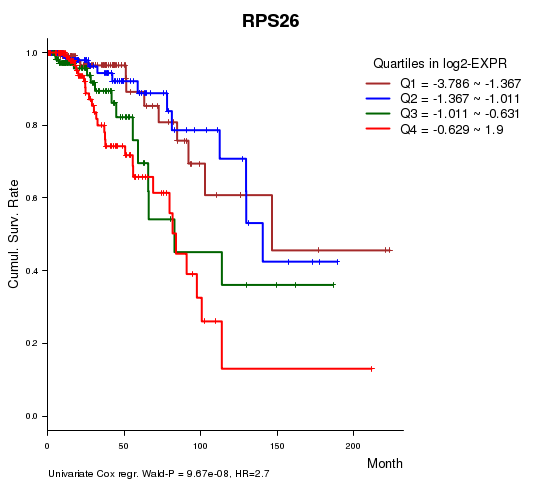
Table S3. Basic characteristics of clinical feature: 'AGE'
| AGE | Mean (SD) | 57.89 (13) |
| Significant markers | N = 416 | |
| pos. correlated | 199 | |
| neg. correlated | 217 |
Table S4. Get Full Table List of top 10 genes significantly correlated to 'AGE' by Spearman correlation test
| SpearmanCorr | corrP | Q | |
|---|---|---|---|
| ESR1 | 0.4166 | 1.252e-23 | 2.23e-19 |
| CNTNAP3 | -0.2966 | 3.358e-12 | 5.98e-08 |
| KLK6 | -0.2949 | 4.491e-12 | 8e-08 |
| KRT17 | -0.2936 | 5.623e-12 | 1e-07 |
| MAGED4B | -0.2927 | 6.562e-12 | 1.17e-07 |
| FOXD2 | 0.2916 | 7.951e-12 | 1.42e-07 |
| NUDT16 | 0.2901 | 1.028e-11 | 1.83e-07 |
| MFGE8 | -0.2885 | 1.332e-11 | 2.37e-07 |
| PPP1R14C | -0.2875 | 1.597e-11 | 2.84e-07 |
| SYT8 | -0.2866 | 1.861e-11 | 3.31e-07 |
Figure S2. Get High-res Image As an example, this figure shows the association of ESR1 to 'AGE'. P value = 1.25e-23 with Spearman correlation analysis. The straight line presents the best linear regression.
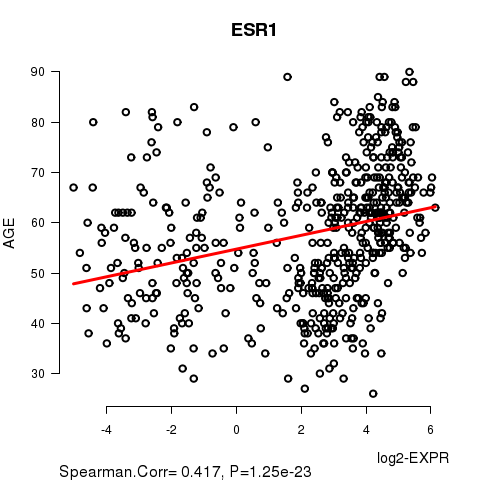
Table S5. Basic characteristics of clinical feature: 'GENDER'
| GENDER | Labels | N |
| FEMALE | 523 | |
| MALE | 6 | |
| Significant markers | N = 6 | |
| Higher in MALE | 1 | |
| Higher in FEMALE | 5 |
Table S6. Get Full Table List of 6 genes differentially expressed by 'GENDER'
| T(pos if higher in 'MALE') | ttestP | Q | AUC | |
|---|---|---|---|---|
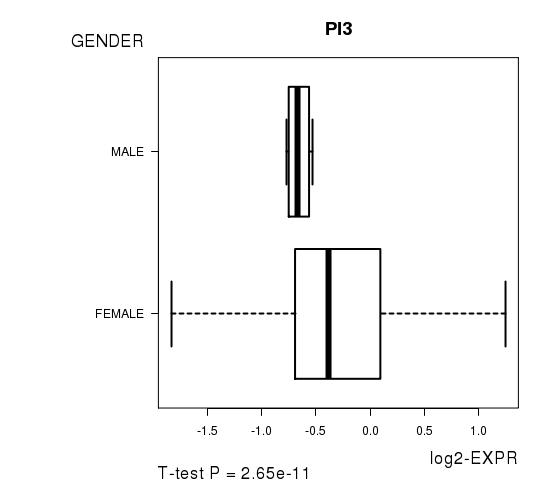
| PI3 | -9.33 | 2.65e-11 | 4.72e-07 | 0.7097 |
| TMEM16C | -14.32 | 1.284e-10 | 2.29e-06 | 0.9261 |
| CACNG1 | 18.44 | 1.71e-08 | 0.000305 | 0.9611 |
| RP13-36C9.6 | -6.28 | 6.727e-07 | 0.012 | 0.6632 |
| MAPK4 | -9.14 | 1.405e-06 | 0.025 | 0.8027 |
| PLA2G3 | -10.62 | 1.769e-06 | 0.0315 | 0.8301 |
Figure S3. Get High-res Image As an example, this figure shows the association of PI3 to 'GENDER'. P value = 2.65e-11 with T-test analysis.
3 genes related to 'RADIATIONS.RADIATION.REGIMENINDICATION'.
Table S7. Basic characteristics of clinical feature: 'RADIATIONS.RADIATION.REGIMENINDICATION'
| RADIATIONS.RADIATION.REGIMENINDICATION | Labels | N |
| NO | 147 | |
| YES | 382 | |
| Significant markers | N = 3 | |
| Higher in YES | 3 | |
| Higher in NO | 0 |
Table S8. Get Full Table List of 3 genes differentially expressed by 'RADIATIONS.RADIATION.REGIMENINDICATION'
| T(pos if higher in 'YES') | ttestP | Q | AUC | |
|---|---|---|---|---|
| OR13C4 | 5.12 | 6.183e-07 | 0.011 | 0.6298 |
| CYP3A5 | 4.9 | 1.325e-06 | 0.0236 | 0.5849 |
| TMEM92 | 4.85 | 1.844e-06 | 0.0328 | 0.606 |
Figure S4. Get High-res Image As an example, this figure shows the association of OR13C4 to 'RADIATIONS.RADIATION.REGIMENINDICATION'. P value = 6.18e-07 with T-test analysis.
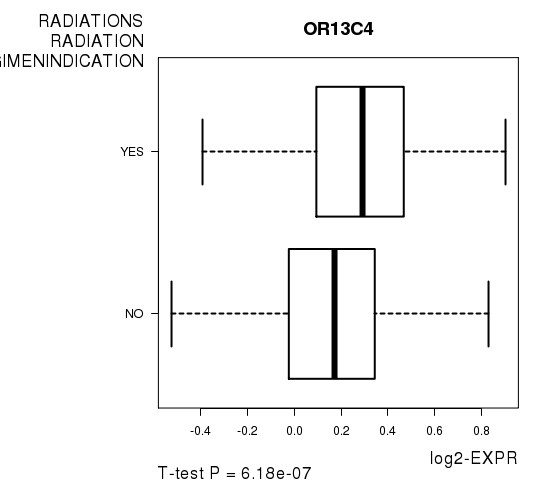
Table S9. Basic characteristics of clinical feature: 'NEOADJUVANT.THERAPY'
| NEOADJUVANT.THERAPY | Labels | N |
| NO | 221 | |
| YES | 308 | |
| Significant markers | N = 11 | |
| Higher in YES | 5 | |
| Higher in NO | 6 |
Table S10. Get Full Table List of top 10 genes differentially expressed by 'NEOADJUVANT.THERAPY'
| T(pos if higher in 'YES') | ttestP | Q | AUC | |
|---|---|---|---|---|
| ZCCHC7 | -5.56 | 4.748e-08 | 0.000846 | 0.6373 |
| DUSP1 | -5.31 | 1.675e-07 | 0.00298 | 0.6317 |
| C2ORF60 | 5.23 | 2.521e-07 | 0.00449 | 0.6204 |
| RGS1 | -5.18 | 3.114e-07 | 0.00555 | 0.6151 |
| EGR1 | -5.05 | 6.156e-07 | 0.011 | 0.6239 |
| EED | 5.05 | 6.223e-07 | 0.0111 | 0.6084 |
| MGC33407 | 5.04 | 7.006e-07 | 0.0125 | 0.6253 |
| OR13C4 | 4.99 | 8.324e-07 | 0.0148 | 0.6189 |
| JUN | -4.89 | 1.355e-06 | 0.0241 | 0.6185 |
| FOS | -4.88 | 1.43e-06 | 0.0255 | 0.6186 |
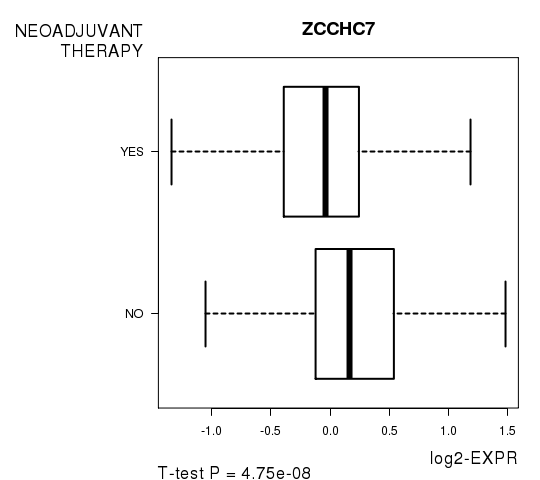
Figure S5. Get High-res Image As an example, this figure shows the association of ZCCHC7 to 'NEOADJUVANT.THERAPY'. P value = 4.75e-08 with T-test analysis.
-
Expresson data file = BRCA.medianexp.txt
-
Clinical data file = BRCA.clin.merged.picked.txt
-
Number of patients = 529
-
Number of genes = 17814
-
Number of clinical features = 5
For survival clinical features, Wald's test in univariate Cox regression analysis with proportional hazards model (Andersen and Gill 1982) was used to estimate the P values using the 'coxph' function in R. Kaplan-Meier survival curves were plot using the four quartile subgroups of patients based on expression levels
For continuous numerical clinical features, Spearman's rank correlation coefficients (Spearman 1904) and two-tailed P values were estimated using 'cor.test' function in R
For two-class clinical features, two-tailed Student's t test with unequal variance (Lehmann and Romano 2005) was applied to compare the log2-expression levels between the two clinical classes using 't.test' function in R
For multiple hypothesis correction, Q value is the False Discovery Rate (FDR) analogue of the P value (Benjamini and Hochberg 1995), defined as the minimum FDR at which the test may be called significant. We used the 'Benjamini and Hochberg' method of 'p.adjust' function in R to convert P values into Q values.
This is an experimental feature. The full results of the analysis summarized in this report can be downloaded from the TCGA Data Coordination Center.