This pipeline uses various statistical tests to identify mRNAs whose expression levels correlated to selected clinical features.
Testing the association between 18253 genes and 5 clinical features across 803 samples, statistically thresholded by Q value < 0.05, 5 clinical features related to at least one genes.
-
4 genes correlated to 'Time to Death'.
-
DIP2B|57609 , CAND1|55832 , IRF2|3660 , PGK1|5230
-
718 genes correlated to 'AGE'.
-
ESR1|2099 , LRFN5|145581 , TFPI2|7980 , TMEFF1|8577 , DBX2|440097 , ...
-
20 genes correlated to 'GENDER'.
-
ZFY|7544 , NLGN4Y|22829 , PRKY|5616 , SYT9|143425 , FOXA1|3169 , ...
-
1 gene correlated to 'RADIATIONS.RADIATION.REGIMENINDICATION'.
-
TMCO3|55002
-
24 genes correlated to 'NEOADJUVANT.THERAPY'.
-
?|57714 , TRIM25|7706 , RGS1|5996 , CEBPD|1052 , DUSP1|1843 , ...
Complete statistical result table is provided in Supplement Table 1
Table 1. Get Full Table This table shows the clinical features, statistical methods used, and the number of genes that are significantly associated with each clinical feature at Q value < 0.05.
| Clinical feature | Statistical test | Significant genes | Associated with | Associated with | ||
|---|---|---|---|---|---|---|
| Time to Death | Cox regression test | N=4 | shorter survival | N=3 | longer survival | N=1 |
| AGE | Spearman correlation test | N=718 | older | N=174 | younger | N=544 |
| GENDER | t test | N=20 | male | N=9 | female | N=11 |
| RADIATIONS RADIATION REGIMENINDICATION | t test | N=1 | yes | N=1 | no | N=0 |
| NEOADJUVANT THERAPY | t test | N=24 | yes | N=14 | no | N=10 |
Table S1. Basic characteristics of clinical feature: 'Time to Death'
| Time to Death | Duration (Months) | 0-223.4 (median=19) |
| censored | N = 656 | |
| death | N = 92 | |
| Significant markers | N = 4 | |
| associated with shorter survival | 3 | |
| associated with longer survival | 1 |
Table S2. Get Full Table List of 4 genes significantly associated with 'Time to Death' by Cox regression test
| HazardRatio | Wald_P | Q | C_index | |
|---|---|---|---|---|
| DIP2B|57609 | 3 | 1.264e-07 | 0.0023 | 0.635 |
| CAND1|55832 | 2.1 | 8.758e-07 | 0.016 | 0.632 |
| IRF2|3660 | 0.27 | 1.448e-06 | 0.026 | 0.327 |
| PGK1|5230 | 2 | 2.099e-06 | 0.038 | 0.686 |
Figure S1. Get High-res Image As an example, this figure shows the association of DIP2B|57609 to 'Time to Death'. four curves present the cumulative survival rates of 4 quartile subsets of patients. P value = 1.26e-07 with univariate Cox regression analysis using continuous log-2 expression values.
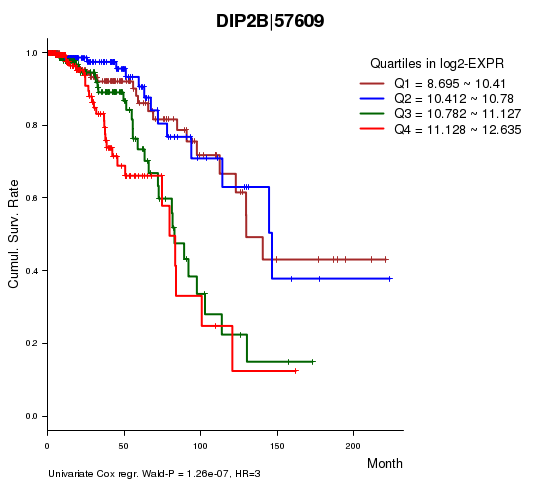
Table S3. Basic characteristics of clinical feature: 'AGE'
| AGE | Mean (SD) | 57.99 (13) |
| Significant markers | N = 718 | |
| pos. correlated | 174 | |
| neg. correlated | 544 |
Table S4. Get Full Table List of top 10 genes significantly correlated to 'AGE' by Spearman correlation test
| SpearmanCorr | corrP | Q | |
|---|---|---|---|
| ESR1|2099 | 0.3577 | 1.296e-25 | 2.37e-21 |
| LRFN5|145581 | -0.2731 | 6.613e-15 | 1.21e-10 |
| TFPI2|7980 | -0.2699 | 9.36e-15 | 1.71e-10 |
| TMEFF1|8577 | -0.2623 | 4.365e-14 | 7.97e-10 |
| DBX2|440097 | -0.2821 | 4.684e-14 | 8.55e-10 |
| SOBP|55084 | -0.2617 | 5.078e-14 | 9.27e-10 |
| DZIP1|22873 | -0.2599 | 7.631e-14 | 1.39e-09 |
| FXYD6|53826 | -0.2571 | 1.433e-13 | 2.62e-09 |
| KIAA1755|85449 | -0.2558 | 1.92e-13 | 3.5e-09 |
| PCDH18|54510 | -0.2521 | 4.269e-13 | 7.79e-09 |
Figure S2. Get High-res Image As an example, this figure shows the association of ESR1|2099 to 'AGE'. P value = 1.3e-25 with Spearman correlation analysis. The straight line presents the best linear regression.
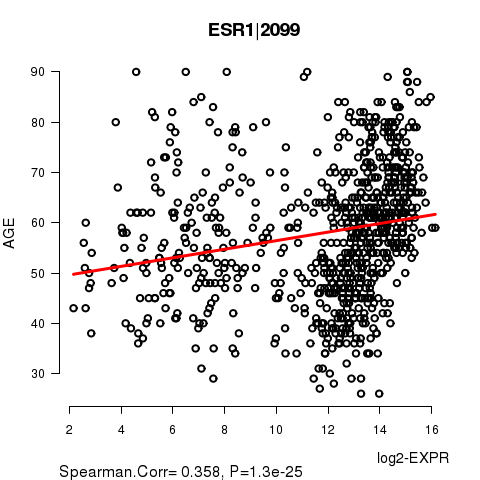
Table S5. Basic characteristics of clinical feature: 'GENDER'
| GENDER | Labels | N |
| FEMALE | 795 | |
| MALE | 8 | |
| Significant markers | N = 20 | |
| Higher in MALE | 9 | |
| Higher in FEMALE | 11 |
Table S6. Get Full Table List of top 10 genes differentially expressed by 'GENDER'
| T(pos if higher in 'MALE') | ttestP | Q | AUC | |
|---|---|---|---|---|
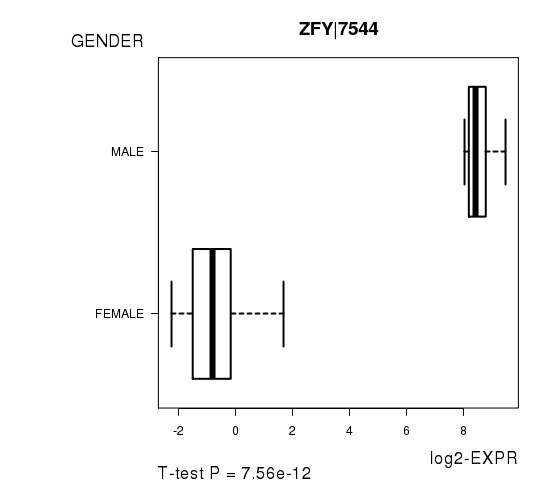
| ZFY|7544 | 54.03 | 7.555e-12 | 1.36e-07 | 1 |
| NLGN4Y|22829 | 43.31 | 1.451e-11 | 2.6e-07 | 1 |
| PRKY|5616 | 26.4 | 7.409e-09 | 0.000133 | 1 |
| SYT9|143425 | 12.88 | 1.437e-08 | 0.000258 | 0.808 |
| FOXA1|3169 | 9.09 | 2.345e-08 | 0.000421 | 0.7055 |
| C7ORF10|79783 | 8.27 | 2.85e-08 | 0.000511 | 0.6596 |
| RND2|8153 | 12.81 | 6.59e-08 | 0.00118 | 0.8524 |
| HTR4|3360 | -11.92 | 7.987e-08 | 0.00143 | 0.7911 |
| SNORA74B|677841 | -11.96 | 9.889e-08 | 0.00177 | 0.8381 |
| LOC731789|731789 | -10.63 | 1.004e-07 | 0.0018 | 0.8658 |
Figure S3. Get High-res Image As an example, this figure shows the association of ZFY|7544 to 'GENDER'. P value = 7.56e-12 with T-test analysis.
One gene related to 'RADIATIONS.RADIATION.REGIMENINDICATION'.
Table S7. Basic characteristics of clinical feature: 'RADIATIONS.RADIATION.REGIMENINDICATION'
| RADIATIONS.RADIATION.REGIMENINDICATION | Labels | N |
| NO | 191 | |
| YES | 612 | |
| Significant markers | N = 1 | |
| Higher in YES | 1 | |
| Higher in NO | 0 |
Table S8. Get Full Table List of one gene differentially expressed by 'RADIATIONS.RADIATION.REGIMENINDICATION'
| T(pos if higher in 'YES') | ttestP | Q | AUC | |
|---|---|---|---|---|
| TMCO3|55002 | 4.78 | 2.583e-06 | 0.0472 | 0.6102 |
Figure S4. Get High-res Image As an example, this figure shows the association of TMCO3|55002 to 'RADIATIONS.RADIATION.REGIMENINDICATION'. P value = 2.58e-06 with T-test analysis.
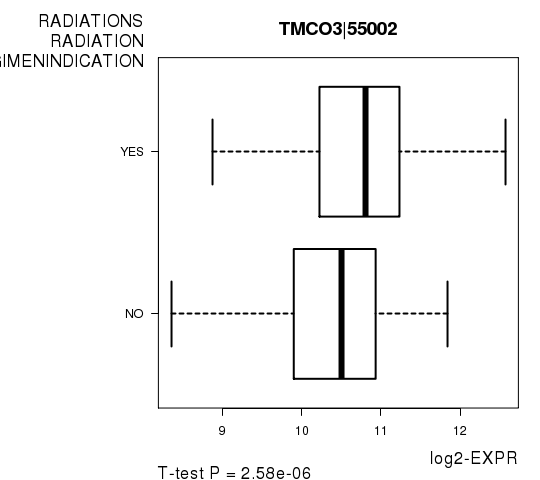
Table S9. Basic characteristics of clinical feature: 'NEOADJUVANT.THERAPY'
| NEOADJUVANT.THERAPY | Labels | N |
| NO | 298 | |
| YES | 505 | |
| Significant markers | N = 24 | |
| Higher in YES | 14 | |
| Higher in NO | 10 |
Table S10. Get Full Table List of top 10 genes differentially expressed by 'NEOADJUVANT.THERAPY'
| T(pos if higher in 'YES') | ttestP | Q | AUC | |
|---|---|---|---|---|
| ?|57714 | 6.12 | 1.665e-09 | 3.04e-05 | 0.625 |
| TRIM25|7706 | 5.62 | 2.674e-08 | 0.000488 | 0.6116 |
| RGS1|5996 | -5.6 | 3.049e-08 | 0.000556 | 0.6078 |
| CEBPD|1052 | -5.47 | 6.319e-08 | 0.00115 | 0.6065 |
| DUSP1|1843 | -5.35 | 1.173e-07 | 0.00214 | 0.6064 |
| ZFP36|7538 | -5.31 | 1.503e-07 | 0.00274 | 0.6183 |
| F2RL3|9002 | -5.28 | 1.843e-07 | 0.00336 | 0.6171 |
| NEU3|10825 | 5.25 | 2.144e-07 | 0.00391 | 0.6108 |
| RNF213|57674 | 5.18 | 2.887e-07 | 0.00527 | 0.6029 |
| FOS|2353 | -5.05 | 5.574e-07 | 0.0102 | 0.602 |
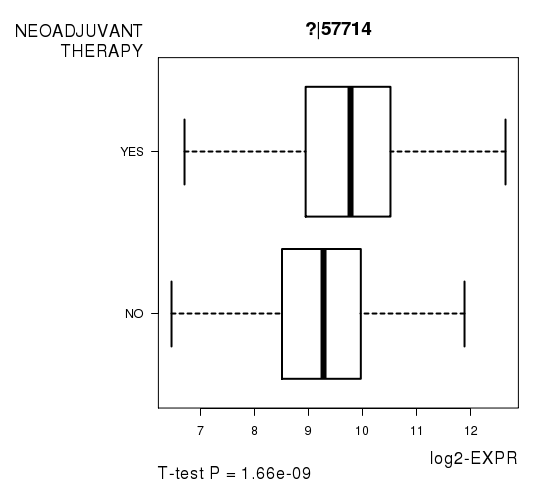
Figure S5. Get High-res Image As an example, this figure shows the association of ?|57714 to 'NEOADJUVANT.THERAPY'. P value = 1.66e-09 with T-test analysis.
-
Expresson data file = BRCA.uncv2.mRNAseq_RSEM_normalized_log2.txt
-
Clinical data file = BRCA.clin.merged.picked.txt
-
Number of patients = 803
-
Number of genes = 18253
-
Number of clinical features = 5
For survival clinical features, Wald's test in univariate Cox regression analysis with proportional hazards model (Andersen and Gill 1982) was used to estimate the P values using the 'coxph' function in R. Kaplan-Meier survival curves were plot using the four quartile subgroups of patients based on expression levels
For continuous numerical clinical features, Spearman's rank correlation coefficients (Spearman 1904) and two-tailed P values were estimated using 'cor.test' function in R
For two-class clinical features, two-tailed Student's t test with unequal variance (Lehmann and Romano 2005) was applied to compare the log2-expression levels between the two clinical classes using 't.test' function in R
For multiple hypothesis correction, Q value is the False Discovery Rate (FDR) analogue of the P value (Benjamini and Hochberg 1995), defined as the minimum FDR at which the test may be called significant. We used the 'Benjamini and Hochberg' method of 'p.adjust' function in R to convert P values into Q values.
This is an experimental feature. The full results of the analysis summarized in this report can be downloaded from the TCGA Data Coordination Center.