This pipeline uses various statistical tests to identify genes whose promoter methylation levels correlated to selected clinical features.
Testing the association between 20235 genes and 5 clinical features across 539 samples, statistically thresholded by Q value < 0.05, 5 clinical features related to at least one genes.
-
5 genes correlated to 'Time to Death'.
-
PLAC4 , PIH1D1 , SH3GL1 , OPN1SW , PRDM15
-
185 genes correlated to 'AGE'.
-
FASN , SNORD32A , SNORA10 , SNORD33 , SNORD36A , ...
-
125 genes correlated to 'GENDER'.
-
ALDOC , SCD , FCHSD1 , WDR17 , CRIP1 , ...
-
1013 genes correlated to 'RADIATIONS.RADIATION.REGIMENINDICATION'.
-
XPA , ABCB10 , GINS2 , SLC35A5 , TIMM17A , ...
-
1883 genes correlated to 'NEOADJUVANT.THERAPY'.
-
XPA , GINS2 , FAHD1 , GNRHR2 , TRNT1 , ...
Complete statistical result table is provided in Supplement Table 1
Table 1. Get Full Table This table shows the clinical features, statistical methods used, and the number of genes that are significantly associated with each clinical feature at Q value < 0.05.
| Clinical feature | Statistical test | Significant genes | Associated with | Associated with | ||
|---|---|---|---|---|---|---|
| Time to Death | Cox regression test | N=5 | shorter survival | N=1 | longer survival | N=4 |
| AGE | Spearman correlation test | N=185 | older | N=173 | younger | N=12 |
| GENDER | t test | N=125 | male | N=8 | female | N=117 |
| RADIATIONS RADIATION REGIMENINDICATION | t test | N=1013 | yes | N=1000 | no | N=13 |
| NEOADJUVANT THERAPY | t test | N=1883 | yes | N=1848 | no | N=35 |
Table S1. Basic characteristics of clinical feature: 'Time to Death'
| Time to Death | Duration (Months) | 0-223.4 (median=17.9) |
| censored | N = 449 | |
| death | N = 61 | |
| Significant markers | N = 5 | |
| associated with shorter survival | 1 | |
| associated with longer survival | 4 |
Table S2. Get Full Table List of 5 genes significantly associated with 'Time to Death' by Cox regression test
| HazardRatio | Wald_P | Q | C_index | |
|---|---|---|---|---|
| PLAC4 | 0.01 | 3.489e-07 | 0.0071 | 0.406 |
| PIH1D1 | 771 | 6.524e-07 | 0.013 | 0.573 |
| SH3GL1 | 0.01 | 1.661e-06 | 0.034 | 0.333 |
| OPN1SW | 0 | 2.273e-06 | 0.046 | 0.369 |
| PRDM15 | 0 | 2.315e-06 | 0.047 | 0.353 |
Figure S1. Get High-res Image As an example, this figure shows the association of PLAC4 to 'Time to Death'. four curves present the cumulative survival rates of 4 quartile subsets of patients. P value = 3.49e-07 with univariate Cox regression analysis using continuous log-2 expression values.
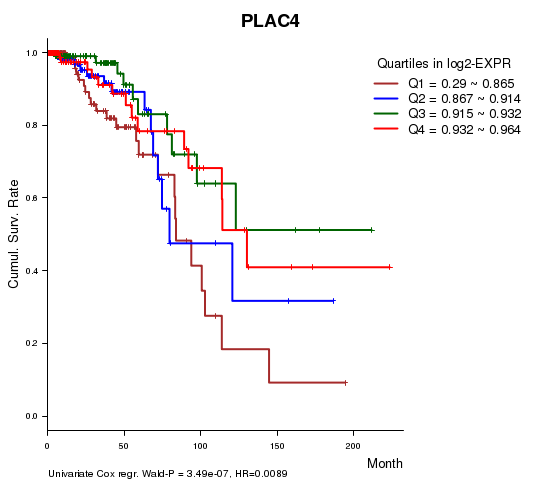
Table S3. Basic characteristics of clinical feature: 'AGE'
| AGE | Mean (SD) | 57.58 (13) |
| Significant markers | N = 185 | |
| pos. correlated | 173 | |
| neg. correlated | 12 |
Table S4. Get Full Table List of top 10 genes significantly correlated to 'AGE' by Spearman correlation test
| SpearmanCorr | corrP | Q | |
|---|---|---|---|
| FASN | 0.2901 | 6.876e-12 | 1.39e-07 |
| SNORD32A | 0.2875 | 1.077e-11 | 2.18e-07 |
| SNORA10 | 0.287 | 1.164e-11 | 2.36e-07 |
| SNORD33 | 0.286 | 1.376e-11 | 2.78e-07 |
| SNORD36A | 0.2849 | 1.653e-11 | 3.34e-07 |
| SNORA64 | 0.2787 | 4.666e-11 | 9.44e-07 |
| BARHL1 | 0.2772 | 6.055e-11 | 1.22e-06 |
| SNORD72 | 0.2729 | 1.211e-10 | 2.45e-06 |
| SNORD82 | 0.2727 | 1.243e-10 | 2.51e-06 |
| SNORD42A | 0.2713 | 1.573e-10 | 3.18e-06 |
Figure S2. Get High-res Image As an example, this figure shows the association of FASN to 'AGE'. P value = 6.88e-12 with Spearman correlation analysis. The straight line presents the best linear regression.
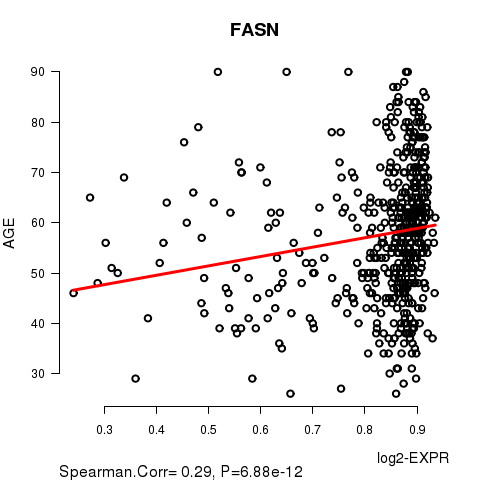
Table S5. Basic characteristics of clinical feature: 'GENDER'
| GENDER | Labels | N |
| FEMALE | 533 | |
| MALE | 6 | |
| Significant markers | N = 125 | |
| Higher in MALE | 8 | |
| Higher in FEMALE | 117 |
Table S6. Get Full Table List of top 10 genes differentially expressed by 'GENDER'
| T(pos if higher in 'MALE') | ttestP | Q | AUC | |
|---|---|---|---|---|
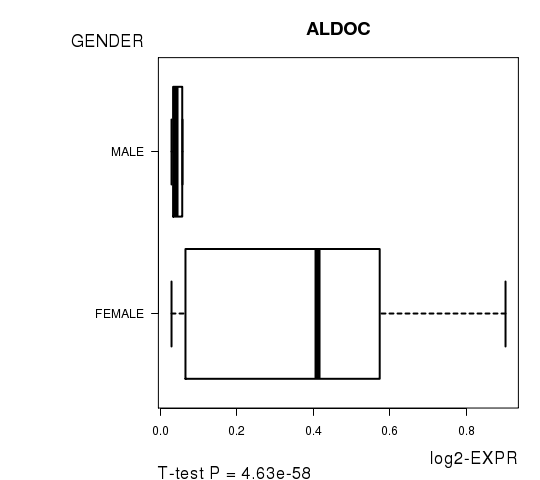
| ALDOC | -26.45 | 4.631e-58 | 9.37e-54 | 0.9162 |
| SCD | -17.54 | 2.596e-46 | 5.25e-42 | 0.859 |
| FCHSD1 | -14.73 | 3.02e-41 | 6.11e-37 | 0.6998 |
| WDR17 | -15.8 | 4.416e-38 | 8.93e-34 | 0.8771 |
| CRIP1 | -17.12 | 4.683e-32 | 9.47e-28 | 0.9174 |
| RND2 | -11.34 | 1.804e-21 | 3.65e-17 | 0.7502 |
| SLCO4C1 | -9.99 | 1.879e-20 | 3.8e-16 | 0.7639 |
| KLHL32 | -14.15 | 3.83e-20 | 7.75e-16 | 0.7724 |
| RAD51AP2 | -14.92 | 9.031e-20 | 1.83e-15 | 0.7417 |
| TET2 | -10.49 | 1.703e-18 | 3.44e-14 | 0.8368 |
Figure S3. Get High-res Image As an example, this figure shows the association of ALDOC to 'GENDER'. P value = 4.63e-58 with T-test analysis.
1013 genes related to 'RADIATIONS.RADIATION.REGIMENINDICATION'.
Table S7. Basic characteristics of clinical feature: 'RADIATIONS.RADIATION.REGIMENINDICATION'
| RADIATIONS.RADIATION.REGIMENINDICATION | Labels | N |
| NO | 134 | |
| YES | 405 | |
| Significant markers | N = 1013 | |
| Higher in YES | 1000 | |
| Higher in NO | 13 |
Table S8. Get Full Table List of top 10 genes differentially expressed by 'RADIATIONS.RADIATION.REGIMENINDICATION'
| T(pos if higher in 'YES') | ttestP | Q | AUC | |
|---|---|---|---|---|
| XPA | 8.32 | 3.434e-15 | 6.95e-11 | 0.7077 |
| ABCB10 | 8.07 | 7.467e-15 | 1.51e-10 | 0.6986 |
| GINS2 | 7.78 | 1.004e-13 | 2.03e-09 | 0.6882 |
| SLC35A5 | 7.45 | 4.33e-13 | 8.76e-09 | 0.6772 |
| TIMM17A | 7.33 | 9.615e-13 | 1.95e-08 | 0.6731 |
| BRPF1 | 7.36 | 1.041e-12 | 2.11e-08 | 0.6539 |
| MDM4 | 7.42 | 1.257e-12 | 2.54e-08 | 0.6962 |
| KIAA0406 | 7.24 | 2.738e-12 | 5.54e-08 | 0.6664 |
| RPRD1B | 7.24 | 2.738e-12 | 5.54e-08 | 0.6664 |
| NUS1 | 7.16 | 2.798e-12 | 5.66e-08 | 0.6844 |
Figure S4. Get High-res Image As an example, this figure shows the association of XPA to 'RADIATIONS.RADIATION.REGIMENINDICATION'. P value = 3.43e-15 with T-test analysis.
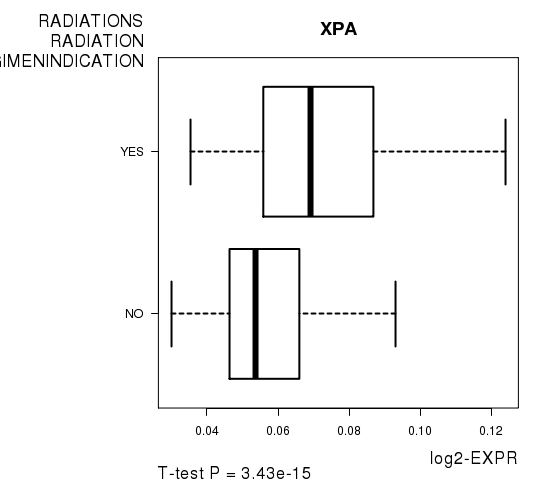
Table S9. Basic characteristics of clinical feature: 'NEOADJUVANT.THERAPY'
| NEOADJUVANT.THERAPY | Labels | N |
| NO | 202 | |
| YES | 337 | |
| Significant markers | N = 1883 | |
| Higher in YES | 1848 | |
| Higher in NO | 35 |
Table S10. Get Full Table List of top 10 genes differentially expressed by 'NEOADJUVANT.THERAPY'
| T(pos if higher in 'YES') | ttestP | Q | AUC | |
|---|---|---|---|---|
| XPA | 9.26 | 6.318e-19 | 1.28e-14 | 0.7145 |
| GINS2 | 9.01 | 3.758e-18 | 7.6e-14 | 0.7106 |
| FAHD1 | 8.79 | 2.1e-17 | 4.25e-13 | 0.6936 |
| GNRHR2 | 8.7 | 4.847e-17 | 9.81e-13 | 0.7037 |
| TRNT1 | 8.62 | 7.609e-17 | 1.54e-12 | 0.7073 |
| UGCG | 8.59 | 1.105e-16 | 2.24e-12 | 0.7065 |
| EIF2S2 | 8.57 | 1.154e-16 | 2.33e-12 | 0.7117 |
| ATXN3 | 8.57 | 1.212e-16 | 2.45e-12 | 0.6928 |
| DDX41 | 8.42 | 3.74e-16 | 7.57e-12 | 0.695 |
| NDUFS1 | 8.38 | 4.737e-16 | 9.58e-12 | 0.6875 |
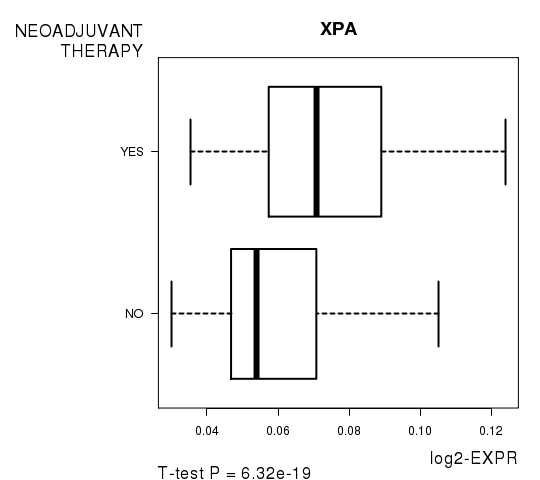
Figure S5. Get High-res Image As an example, this figure shows the association of XPA to 'NEOADJUVANT.THERAPY'. P value = 6.32e-19 with T-test analysis.
-
Expresson data file = BRCA.meth.for_correlation.filtered_data.txt
-
Clinical data file = BRCA.clin.merged.picked.txt
-
Number of patients = 539
-
Number of genes = 20235
-
Number of clinical features = 5
For survival clinical features, Wald's test in univariate Cox regression analysis with proportional hazards model (Andersen and Gill 1982) was used to estimate the P values using the 'coxph' function in R. Kaplan-Meier survival curves were plot using the four quartile subgroups of patients based on expression levels
For continuous numerical clinical features, Spearman's rank correlation coefficients (Spearman 1904) and two-tailed P values were estimated using 'cor.test' function in R
For two-class clinical features, two-tailed Student's t test with unequal variance (Lehmann and Romano 2005) was applied to compare the log2-expression levels between the two clinical classes using 't.test' function in R
For multiple hypothesis correction, Q value is the False Discovery Rate (FDR) analogue of the P value (Benjamini and Hochberg 1995), defined as the minimum FDR at which the test may be called significant. We used the 'Benjamini and Hochberg' method of 'p.adjust' function in R to convert P values into Q values.
This is an experimental feature. The full results of the analysis summarized in this report can be downloaded from the TCGA Data Coordination Center.