This pipeline uses various statistical tests to identify miRs whose expression levels correlated to selected clinical features.
Testing the association between 504 genes and 5 clinical features across 807 samples, statistically thresholded by Q value < 0.05, 4 clinical features related to at least one genes.
-
2 genes correlated to 'Time to Death'.
-
HSA-MIR-874 , HSA-MIR-148B
-
23 genes correlated to 'AGE'.
-
HSA-MIR-424 , HSA-MIR-381 , HSA-MIR-542 , HSA-MIR-99A , HSA-MIR-598 , ...
-
4 genes correlated to 'RADIATIONS.RADIATION.REGIMENINDICATION'.
-
HSA-MIR-374C , HSA-MIR-489 , HSA-MIR-3607 , HSA-MIR-320D-1
-
7 genes correlated to 'NEOADJUVANT.THERAPY'.
-
HSA-MIR-374C , HSA-MIR-3607 , HSA-MIR-1180 , HSA-MIR-3676 , HSA-MIR-361 , ...
-
No genes correlated to 'GENDER'
Complete statistical result table is provided in Supplement Table 1
Table 1. Get Full Table This table shows the clinical features, statistical methods used, and the number of genes that are significantly associated with each clinical feature at Q value < 0.05.
| Clinical feature | Statistical test | Significant genes | Associated with | Associated with | ||
|---|---|---|---|---|---|---|
| Time to Death | Cox regression test | N=2 | shorter survival | N=2 | longer survival | N=0 |
| AGE | Spearman correlation test | N=23 | older | N=2 | younger | N=21 |
| GENDER | t test | N=0 | ||||
| RADIATIONS RADIATION REGIMENINDICATION | t test | N=4 | yes | N=0 | no | N=4 |
| NEOADJUVANT THERAPY | t test | N=7 | yes | N=3 | no | N=4 |
Table S1. Basic characteristics of clinical feature: 'Time to Death'
| Time to Death | Duration (Months) | 0-223.4 (median=19) |
| censored | N = 656 | |
| death | N = 92 | |
| Significant markers | N = 2 | |
| associated with shorter survival | 2 | |
| associated with longer survival | 0 |
Table S2. Get Full Table List of 2 genes significantly associated with 'Time to Death' by Cox regression test
| HazardRatio | Wald_P | Q | C_index | |
|---|---|---|---|---|
| HSA-MIR-874 | 1.62 | 2.615e-06 | 0.0013 | 0.62 |
| HSA-MIR-148B | 1.85 | 2.035e-05 | 0.01 | 0.64 |
Figure S1. Get High-res Image As an example, this figure shows the association of HSA-MIR-874 to 'Time to Death'. four curves present the cumulative survival rates of 4 quartile subsets of patients. P value = 2.62e-06 with univariate Cox regression analysis using continuous log-2 expression values.
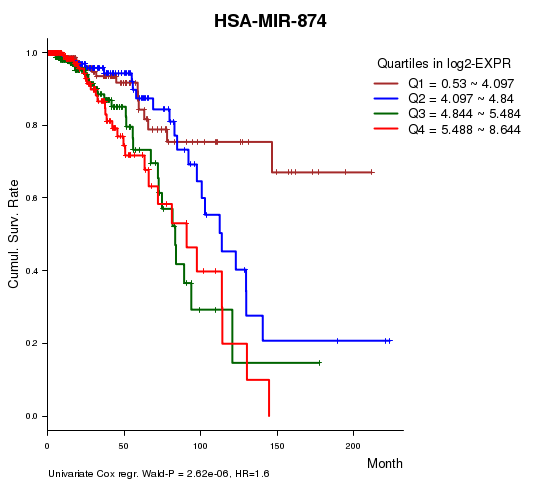
Table S3. Basic characteristics of clinical feature: 'AGE'
| AGE | Mean (SD) | 58.19 (13) |
| Significant markers | N = 23 | |
| pos. correlated | 2 | |
| neg. correlated | 21 |
Table S4. Get Full Table List of top 10 genes significantly correlated to 'AGE' by Spearman correlation test
| SpearmanCorr | corrP | Q | |
|---|---|---|---|
| HSA-MIR-424 | -0.2171 | 4.714e-10 | 2.38e-07 |
| HSA-MIR-381 | -0.2162 | 5.569e-10 | 2.8e-07 |
| HSA-MIR-542 | -0.2115 | 1.321e-09 | 6.63e-07 |
| HSA-MIR-99A | -0.2053 | 4.07e-09 | 2.04e-06 |
| HSA-MIR-598 | -0.2031 | 5.969e-09 | 2.98e-06 |
| HSA-MIR-31 | -0.2052 | 6.367e-09 | 3.18e-06 |
| HSA-MIR-652 | -0.1914 | 4.322e-08 | 2.15e-05 |
| HSA-LET-7C | -0.1805 | 2.492e-07 | 0.000124 |
| HSA-MIR-450B | -0.1717 | 9.534e-07 | 0.000473 |
| HSA-MIR-125B-1 | -0.1632 | 3.182e-06 | 0.00158 |
Figure S2. Get High-res Image As an example, this figure shows the association of HSA-MIR-424 to 'AGE'. P value = 4.71e-10 with Spearman correlation analysis. The straight line presents the best linear regression.
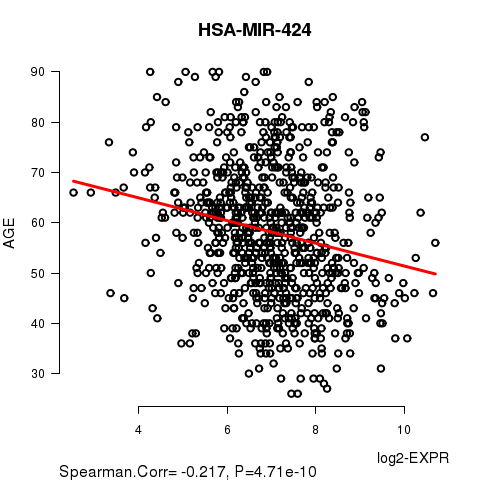
Table S5. Basic characteristics of clinical feature: 'GENDER'
| GENDER | Labels | N |
| FEMALE | 798 | |
| MALE | 9 | |
| Significant markers | N = 0 |
4 genes related to 'RADIATIONS.RADIATION.REGIMENINDICATION'.
Table S6. Basic characteristics of clinical feature: 'RADIATIONS.RADIATION.REGIMENINDICATION'
| RADIATIONS.RADIATION.REGIMENINDICATION | Labels | N |
| NO | 188 | |
| YES | 619 | |
| Significant markers | N = 4 | |
| Higher in YES | 0 | |
| Higher in NO | 4 |
Table S7. Get Full Table List of 4 genes differentially expressed by 'RADIATIONS.RADIATION.REGIMENINDICATION'
| T(pos if higher in 'YES') | ttestP | Q | AUC | |
|---|---|---|---|---|
| HSA-MIR-374C | -4.44 | 1.364e-05 | 0.00687 | 0.6243 |
| HSA-MIR-489 | -4.37 | 2.196e-05 | 0.011 | 0.6338 |
| HSA-MIR-3607 | -4.17 | 3.812e-05 | 0.0191 | 0.5695 |
| HSA-MIR-320D-1 | -4.02 | 7.654e-05 | 0.0383 | 0.611 |
Figure S3. Get High-res Image As an example, this figure shows the association of HSA-MIR-374C to 'RADIATIONS.RADIATION.REGIMENINDICATION'. P value = 1.36e-05 with T-test analysis.
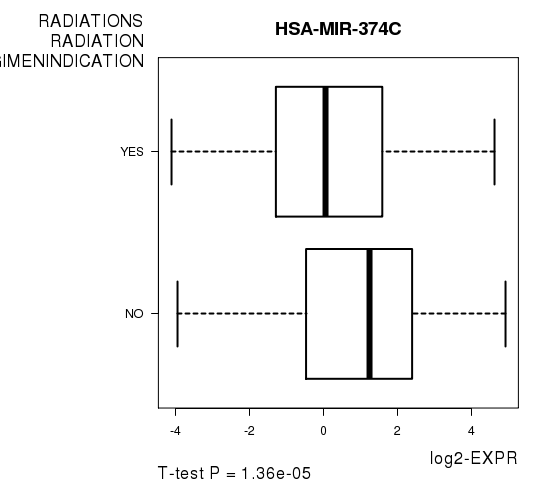
Table S8. Basic characteristics of clinical feature: 'NEOADJUVANT.THERAPY'
| NEOADJUVANT.THERAPY | Labels | N |
| NO | 298 | |
| YES | 509 | |
| Significant markers | N = 7 | |
| Higher in YES | 3 | |
| Higher in NO | 4 |
Table S9. Get Full Table List of 7 genes differentially expressed by 'NEOADJUVANT.THERAPY'
| T(pos if higher in 'YES') | ttestP | Q | AUC | |
|---|---|---|---|---|
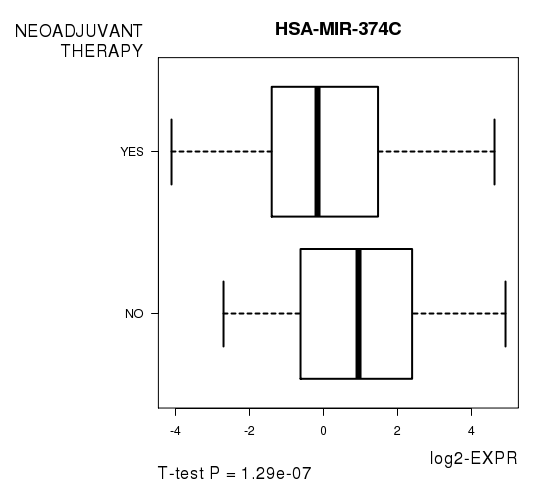
| HSA-MIR-374C | -5.37 | 1.29e-07 | 6.5e-05 | 0.6317 |
| HSA-MIR-3607 | -4.87 | 1.331e-06 | 0.000669 | 0.571 |
| HSA-MIR-1180 | 4.62 | 4.788e-06 | 0.0024 | 0.5946 |
| HSA-MIR-3676 | 4.23 | 2.715e-05 | 0.0136 | 0.5873 |
| HSA-MIR-361 | 4.15 | 3.835e-05 | 0.0192 | 0.5871 |
| HSA-MIR-26A-1 | -4.14 | 3.873e-05 | 0.0193 | 0.5692 |
| HSA-MIR-101-1 | -4.09 | 5.001e-05 | 0.0249 | 0.5961 |
Figure S4. Get High-res Image As an example, this figure shows the association of HSA-MIR-374C to 'NEOADJUVANT.THERAPY'. P value = 1.29e-07 with T-test analysis.
-
Expresson data file = BRCA.miRseq_RPKM_log2.txt
-
Clinical data file = BRCA.clin.merged.picked.txt
-
Number of patients = 807
-
Number of genes = 504
-
Number of clinical features = 5
For survival clinical features, Wald's test in univariate Cox regression analysis with proportional hazards model (Andersen and Gill 1982) was used to estimate the P values using the 'coxph' function in R. Kaplan-Meier survival curves were plot using the four quartile subgroups of patients based on expression levels
For continuous numerical clinical features, Spearman's rank correlation coefficients (Spearman 1904) and two-tailed P values were estimated using 'cor.test' function in R
For two-class clinical features, two-tailed Student's t test with unequal variance (Lehmann and Romano 2005) was applied to compare the log2-expression levels between the two clinical classes using 't.test' function in R
For multiple hypothesis correction, Q value is the False Discovery Rate (FDR) analogue of the P value (Benjamini and Hochberg 1995), defined as the minimum FDR at which the test may be called significant. We used the 'Benjamini and Hochberg' method of 'p.adjust' function in R to convert P values into Q values.
This is an experimental feature. The full results of the analysis summarized in this report can be downloaded from the TCGA Data Coordination Center.