This pipeline computes the correlation between significantly recurrent gene mutations and selected clinical features.
Testing the association between mutation status of 55 genes and 5 clinical features across 507 patients, 2 significant findings detected with Q value < 0.25.
-
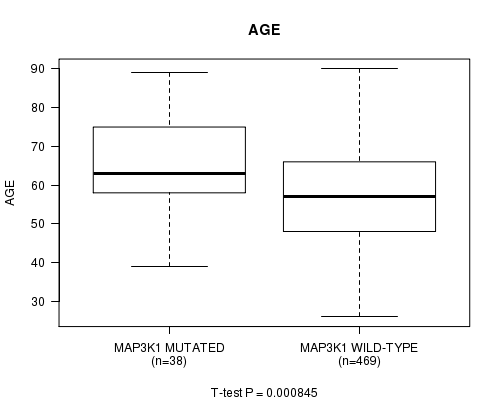
MAP3K1 mutation correlated to 'AGE'.
-
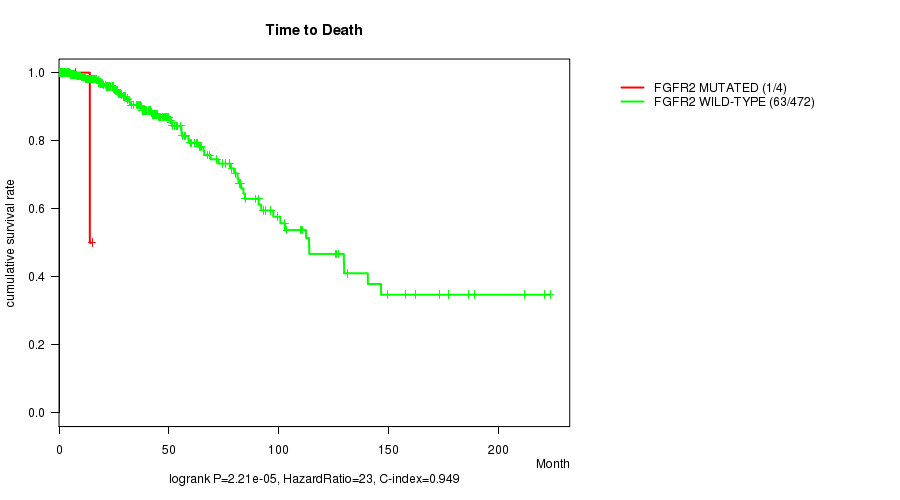
FGFR2 mutation correlated to 'Time to Death'.
Table 1. Get Full Table Overview of the association between mutation status of 55 genes and 5 clinical features. Shown in the table are P values (Q values). Thresholded by Q value < 0.25, 2 significant findings detected.
|
Clinical Features |
Time to Death |
AGE | GENDER |
RADIATIONS RADIATION REGIMENINDICATION |
NEOADJUVANT THERAPY |
||
| nMutated (%) | nWild-Type | logrank test | t-test | Fisher's exact test | Fisher's exact test | Fisher's exact test | |
| MAP3K1 | 38 (7%) | 469 |
0.916 (1.00) |
0.000845 (0.231) |
1 (1.00) |
0.346 (1.00) |
1 (1.00) |
| FGFR2 | 4 (1%) | 503 |
2.21e-05 (0.00604) |
0.219 (1.00) |
1 (1.00) |
1 (1.00) |
0.645 (1.00) |
| GATA3 | 54 (11%) | 453 |
0.812 (1.00) |
0.00918 (1.00) |
0.493 (1.00) |
0.147 (1.00) |
0.381 (1.00) |
| RUNX1 | 18 (4%) | 489 |
0.236 (1.00) |
0.481 (1.00) |
1 (1.00) |
0.422 (1.00) |
1 (1.00) |
| AKT1 | 12 (2%) | 495 |
0.223 (1.00) |
0.548 (1.00) |
1 (1.00) |
0.194 (1.00) |
0.769 (1.00) |
| PIK3CA | 178 (35%) | 329 |
0.455 (1.00) |
0.0485 (1.00) |
1 (1.00) |
1 (1.00) |
0.85 (1.00) |
| TP53 | 184 (36%) | 323 |
0.966 (1.00) |
0.186 (1.00) |
0.0914 (1.00) |
0.47 (1.00) |
0.64 (1.00) |
| MAP2K4 | 20 (4%) | 487 |
0.0878 (1.00) |
0.134 (1.00) |
1 (1.00) |
0.611 (1.00) |
0.166 (1.00) |
| CDH1 | 33 (7%) | 474 |
0.909 (1.00) |
0.0619 (1.00) |
1 (1.00) |
0.84 (1.00) |
0.588 (1.00) |
| PTEN | 17 (3%) | 490 |
0.896 (1.00) |
0.579 (1.00) |
1 (1.00) |
1 (1.00) |
0.453 (1.00) |
| PIK3R1 | 14 (3%) | 493 |
0.213 (1.00) |
0.88 (1.00) |
1 (1.00) |
1 (1.00) |
1 (1.00) |
| MLL3 | 37 (7%) | 470 |
0.301 (1.00) |
0.0094 (1.00) |
1 (1.00) |
0.566 (1.00) |
0.166 (1.00) |
| TBX3 | 13 (3%) | 494 |
0.235 (1.00) |
0.0275 (1.00) |
1 (1.00) |
1 (1.00) |
0.572 (1.00) |
| CBFB | 8 (2%) | 499 |
0.632 (1.00) |
0.367 (1.00) |
1 (1.00) |
1 (1.00) |
0.479 (1.00) |
| CTCF | 13 (3%) | 494 |
0.149 (1.00) |
0.365 (1.00) |
1 (1.00) |
1 (1.00) |
0.78 (1.00) |
| SF3B1 | 10 (2%) | 497 |
0.386 (1.00) |
0.378 (1.00) |
1 (1.00) |
1 (1.00) |
0.534 (1.00) |
| FOXA1 | 8 (2%) | 499 |
0.0014 (0.381) |
0.0133 (1.00) |
1 (1.00) |
1 (1.00) |
0.479 (1.00) |
| C9ORF102 | 5 (1%) | 502 |
0.468 (1.00) |
0.382 (1.00) |
1 (1.00) |
0.618 (1.00) |
0.409 (1.00) |
| TBL1XR1 | 8 (2%) | 499 |
0.811 (1.00) |
0.0425 (1.00) |
1 (1.00) |
0.69 (1.00) |
1 (1.00) |
| KLRG2 | 3 (1%) | 504 |
0.307 (1.00) |
1 (1.00) |
0.184 (1.00) |
0.572 (1.00) |
|
| GPS2 | 6 (1%) | 501 |
0.242 (1.00) |
0.986 (1.00) |
1 (1.00) |
0.668 (1.00) |
1 (1.00) |
| VASN | 6 (1%) | 501 |
0.13 (1.00) |
0.858 (1.00) |
1 (1.00) |
0.668 (1.00) |
1 (1.00) |
| NCOR1 | 17 (3%) | 490 |
0.624 (1.00) |
0.53 (1.00) |
1 (1.00) |
0.58 (1.00) |
0.142 (1.00) |
| ZFP36L1 | 7 (1%) | 500 |
0.951 (1.00) |
0.0859 (1.00) |
1 (1.00) |
0.198 (1.00) |
0.248 (1.00) |
| AFF2 | 13 (3%) | 494 |
0.887 (1.00) |
0.0186 (1.00) |
1 (1.00) |
0.357 (1.00) |
1 (1.00) |
| ERBB2 | 7 (1%) | 500 |
0.298 (1.00) |
0.208 (1.00) |
1 (1.00) |
0.68 (1.00) |
0.045 (1.00) |
| C1ORF65 | 7 (1%) | 500 |
0.254 (1.00) |
0.656 (1.00) |
1 (1.00) |
0.0935 (1.00) |
0.456 (1.00) |
| RPGR | 10 (2%) | 497 |
0.783 (1.00) |
0.81 (1.00) |
1 (1.00) |
0.735 (1.00) |
0.748 (1.00) |
| DALRD3 | 6 (1%) | 501 |
0.613 (1.00) |
0.0641 (1.00) |
1 (1.00) |
0.353 (1.00) |
0.696 (1.00) |
| MYB | 8 (2%) | 499 |
0.219 (1.00) |
0.255 (1.00) |
1 (1.00) |
0.224 (1.00) |
0.285 (1.00) |
| RB1 | 9 (2%) | 498 |
0.69 (1.00) |
0.305 (1.00) |
1 (1.00) |
0.455 (1.00) |
0.318 (1.00) |
| CCDC146 | 6 (1%) | 501 |
0.609 (1.00) |
0.772 (1.00) |
1 (1.00) |
0.353 (1.00) |
0.238 (1.00) |
| CDKN1B | 5 (1%) | 502 |
0.469 (1.00) |
0.982 (1.00) |
1 (1.00) |
1 (1.00) |
0.409 (1.00) |
| LYSMD3 | 4 (1%) | 503 |
0.736 (1.00) |
0.58 (1.00) |
1 (1.00) |
1 (1.00) |
0.645 (1.00) |
| ZNF268 | 4 (1%) | 503 |
0.638 (1.00) |
0.726 (1.00) |
1 (1.00) |
0.303 (1.00) |
1 (1.00) |
| UBC | 7 (1%) | 500 |
0.292 (1.00) |
0.548 (1.00) |
1 (1.00) |
1 (1.00) |
0.132 (1.00) |
| NEK5 | 8 (2%) | 499 |
0.672 (1.00) |
0.106 (1.00) |
1 (1.00) |
0.456 (1.00) |
0.479 (1.00) |
| PRRX1 | 5 (1%) | 502 |
0.505 (1.00) |
0.785 (1.00) |
1 (1.00) |
0.13 (1.00) |
0.653 (1.00) |
| GPR32 | 5 (1%) | 502 |
0.733 (1.00) |
0.155 (1.00) |
1 (1.00) |
1 (1.00) |
1 (1.00) |
| KCNT2 | 9 (2%) | 498 |
0.717 (1.00) |
0.251 (1.00) |
1 (1.00) |
0.455 (1.00) |
0.742 (1.00) |
| KRT38 | 3 (1%) | 504 |
0.518 (1.00) |
0.359 (1.00) |
1 (1.00) |
1 (1.00) |
0.572 (1.00) |
| KRAS | 4 (1%) | 503 |
0.532 (1.00) |
0.209 (1.00) |
1 (1.00) |
0.579 (1.00) |
0.146 (1.00) |
| SAAL1 | 4 (1%) | 503 |
0.0658 (1.00) |
0.957 (1.00) |
1 (1.00) |
1 (1.00) |
0.645 (1.00) |
| AVPI1 | 4 (1%) | 503 |
0.672 (1.00) |
0.5 (1.00) |
1 (1.00) |
1 (1.00) |
1 (1.00) |
| SRGAP1 | 8 (2%) | 499 |
0.959 (1.00) |
0.584 (1.00) |
1 (1.00) |
1 (1.00) |
0.479 (1.00) |
| CHGB | 7 (1%) | 500 |
0.0351 (1.00) |
0.23 (1.00) |
1 (1.00) |
1 (1.00) |
0.248 (1.00) |
| ATN1 | 8 (2%) | 499 |
0.235 (1.00) |
0.72 (1.00) |
1 (1.00) |
0.456 (1.00) |
0.479 (1.00) |
| HIST1H2BC | 4 (1%) | 503 |
0.556 (1.00) |
0.657 (1.00) |
1 (1.00) |
1 (1.00) |
0.312 (1.00) |
| PPEF1 | 7 (1%) | 500 |
0.7 (1.00) |
0.533 (1.00) |
1 (1.00) |
0.68 (1.00) |
0.705 (1.00) |
| DCAF4L2 | 7 (1%) | 500 |
0.595 (1.00) |
0.625 (1.00) |
1 (1.00) |
1 (1.00) |
1 (1.00) |
| CBLB | 9 (2%) | 498 |
0.367 (1.00) |
0.556 (1.00) |
1 (1.00) |
1 (1.00) |
1 (1.00) |
| HIST1H1C | 4 (1%) | 503 |
0.766 (1.00) |
0.979 (1.00) |
0.0466 (1.00) |
0.579 (1.00) |
1 (1.00) |
| HLA-DRB1 | 4 (1%) | 503 |
0.551 (1.00) |
0.616 (1.00) |
1 (1.00) |
0.579 (1.00) |
0.312 (1.00) |
| TRIM6-TRIM34 | 4 (1%) | 503 |
0.803 (1.00) |
0.853 (1.00) |
1 (1.00) |
0.0647 (1.00) |
0.312 (1.00) |
| SLC22A20 | 7 (1%) | 500 |
0.776 (1.00) |
0.84 (1.00) |
1 (1.00) |
0.399 (1.00) |
0.456 (1.00) |
P value = 0.000845 (t-test), Q value = 0.23
Table S1. Gene #9: 'MAP3K1 MUTATION STATUS' versus Clinical Feature #2: 'AGE'
| nPatients | Mean (Std.Dev) | |
|---|---|---|
| ALL | 507 | 57.8 (13.1) |
| MAP3K1 MUTATED | 38 | 64.7 (12.3) |
| MAP3K1 WILD-TYPE | 469 | 57.2 (13.1) |
Figure S1. Get High-res Image Gene #9: 'MAP3K1 MUTATION STATUS' versus Clinical Feature #2: 'AGE'
P value = 2.21e-05 (logrank test), Q value = 0.006
Table S2. Gene #55: 'FGFR2 MUTATION STATUS' versus Clinical Feature #1: 'Time to Death'
| nPatients | nDeath | Duration Range (Median), Month | |
|---|---|---|---|
| ALL | 476 | 64 | 0.1 - 223.4 (24.4) |
| FGFR2 MUTATED | 4 | 1 | 1.1 - 15.1 (10.8) |
| FGFR2 WILD-TYPE | 472 | 63 | 0.1 - 223.4 (24.5) |
Figure S2. Get High-res Image Gene #55: 'FGFR2 MUTATION STATUS' versus Clinical Feature #1: 'Time to Death'
-
Mutation data file = BRCA.mutsig.cluster.txt
-
Clinical data file = BRCA.clin.merged.picked.txt
-
Number of patients = 507
-
Number of significantly mutated genes = 55
-
Number of selected clinical features = 5
-
Exclude genes that fewer than K tumors have mutations, K = 3
For survival clinical features, the Kaplan-Meier survival curves of tumors with and without gene mutations were plotted and the statistical significance P values were estimated by logrank test (Bland and Altman 2004) using the 'survdiff' function in R
For continuous numerical clinical features, two-tailed Student's t test with unequal variance (Lehmann and Romano 2005) was applied to compare the clinical values between tumors with and without gene mutations using 't.test' function in R
For binary or multi-class clinical features (nominal or ordinal), two-tailed Fisher's exact tests (Fisher 1922) were used to estimate the P values using the 'fisher.test' function in R
For multiple hypothesis correction, Q value is the False Discovery Rate (FDR) analogue of the P value (Benjamini and Hochberg 1995), defined as the minimum FDR at which the test may be called significant. We used the 'Benjamini and Hochberg' method of 'p.adjust' function in R to convert P values into Q values.
This is an experimental feature. The full results of the analysis summarized in this report can be downloaded from the TCGA Data Coordination Center.