This pipeline computes the correlation between significant arm-level copy number variations (cnvs) and selected clinical features.
Testing the association between copy number variation 79 arm-level results and 6 clinical features across 544 patients, 10 significant findings detected with Q value < 0.25.
-
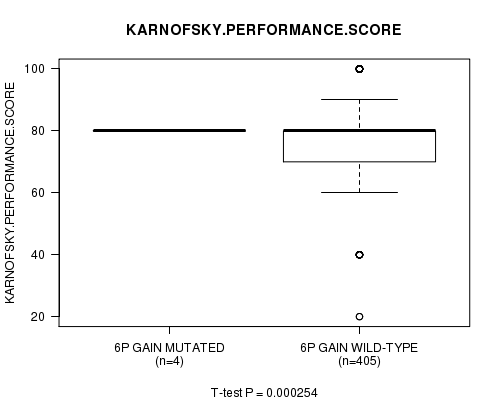
6p gain cnv correlated to 'KARNOFSKY.PERFORMANCE.SCORE'.
-
6q gain cnv correlated to 'KARNOFSKY.PERFORMANCE.SCORE'.
-
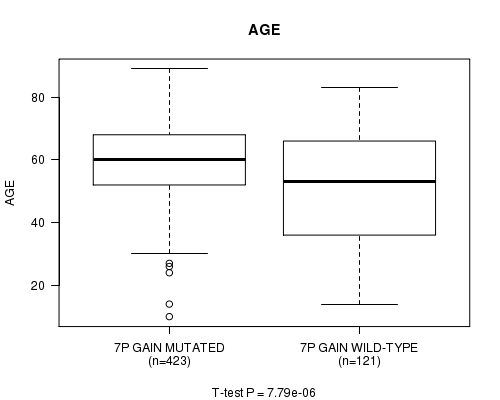
7p gain cnv correlated to 'AGE'.
-
7q gain cnv correlated to 'AGE'.
-
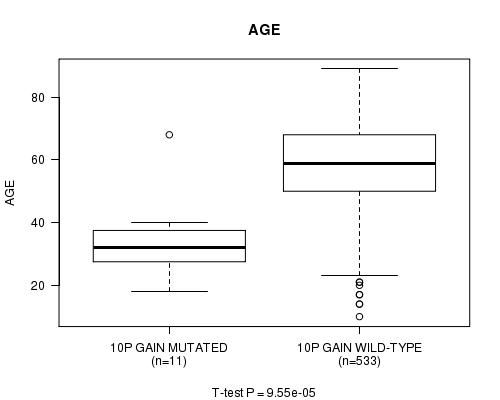
10p gain cnv correlated to 'AGE' and 'KARNOFSKY.PERFORMANCE.SCORE'.
-
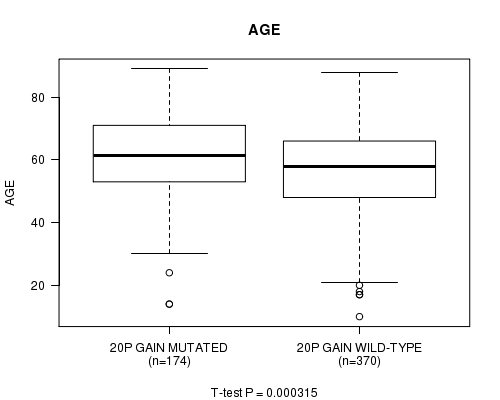
20p gain cnv correlated to 'AGE'.
-
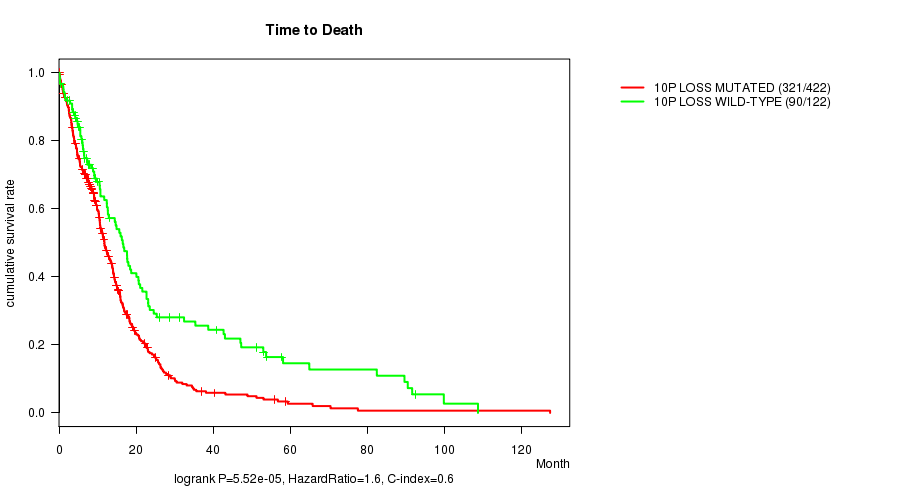
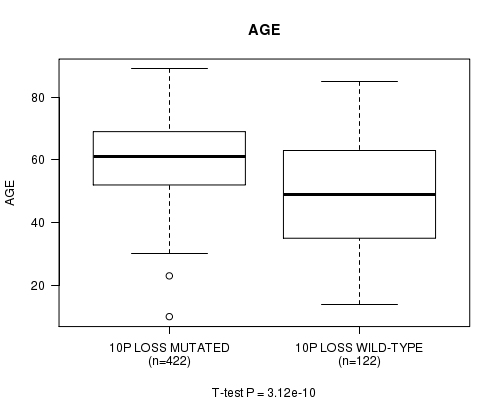
10p loss cnv correlated to 'Time to Death' and 'AGE'.
-
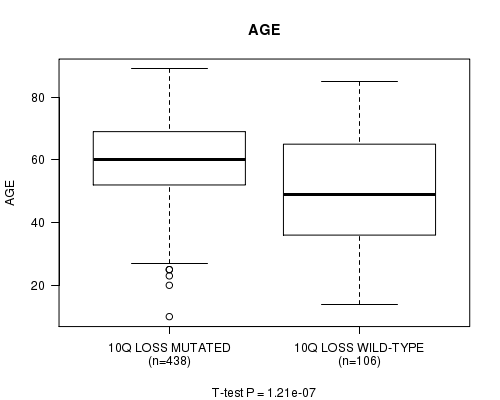
10q loss cnv correlated to 'AGE'.
Table 1. Get Full Table Overview of the association between significant copy number variation of 79 arm-level results and 6 clinical features. Shown in the table are P values (Q values). Thresholded by Q value < 0.25, 10 significant findings detected.
|
Clinical Features |
Time to Death |
AGE | GENDER |
KARNOFSKY PERFORMANCE SCORE |
RADIATIONS RADIATION REGIMENINDICATION |
NEOADJUVANT THERAPY |
||
| nCNV (%) | nWild-Type | logrank test | t-test | Fisher's exact test | t-test | Fisher's exact test | Fisher's exact test | |
| 10p gain | 11 (2%) | 533 |
0.00302 (1.00) |
9.55e-05 (0.0445) |
0.0296 (1.00) |
0.000254 (0.118) |
1 (1.00) |
0.764 (1.00) |
| 10p loss | 422 (78%) | 122 |
5.52e-05 (0.0258) |
3.12e-10 (1.47e-07) |
0.344 (1.00) |
0.332 (1.00) |
0.187 (1.00) |
0.758 (1.00) |
| 6p gain | 7 (1%) | 537 |
0.1 (1.00) |
0.0989 (1.00) |
1 (1.00) |
0.000254 (0.118) |
0.438 (1.00) |
1 (1.00) |
| 6q gain | 9 (2%) | 535 |
0.134 (1.00) |
0.0449 (1.00) |
0.745 (1.00) |
0.000254 (0.118) |
0.725 (1.00) |
0.742 (1.00) |
| 7p gain | 423 (78%) | 121 |
0.00913 (1.00) |
7.79e-06 (0.00365) |
0.916 (1.00) |
0.41 (1.00) |
0.151 (1.00) |
0.68 (1.00) |
| 7q gain | 427 (78%) | 117 |
0.0111 (1.00) |
1.04e-05 (0.00486) |
0.749 (1.00) |
0.457 (1.00) |
0.221 (1.00) |
0.297 (1.00) |
| 20p gain | 174 (32%) | 370 |
0.888 (1.00) |
0.000315 (0.145) |
0.707 (1.00) |
0.371 (1.00) |
0.279 (1.00) |
1 (1.00) |
| 10q loss | 438 (81%) | 106 |
0.000635 (0.293) |
1.21e-07 (5.67e-05) |
0.508 (1.00) |
0.0968 (1.00) |
0.49 (1.00) |
0.45 (1.00) |
| 1p gain | 39 (7%) | 505 |
0.489 (1.00) |
0.535 (1.00) |
0.735 (1.00) |
0.952 (1.00) |
0.477 (1.00) |
0.87 (1.00) |
| 1q gain | 44 (8%) | 500 |
0.881 (1.00) |
0.442 (1.00) |
0.873 (1.00) |
0.808 (1.00) |
0.506 (1.00) |
1 (1.00) |
| 2p gain | 18 (3%) | 526 |
0.577 (1.00) |
0.196 (1.00) |
0.219 (1.00) |
0.301 (1.00) |
0.448 (1.00) |
0.338 (1.00) |
| 2q gain | 16 (3%) | 528 |
0.772 (1.00) |
0.501 (1.00) |
0.44 (1.00) |
0.737 (1.00) |
0.29 (1.00) |
1 (1.00) |
| 3p gain | 29 (5%) | 515 |
0.104 (1.00) |
0.439 (1.00) |
0.847 (1.00) |
0.838 (1.00) |
0.221 (1.00) |
0.254 (1.00) |
| 3q gain | 29 (5%) | 515 |
0.106 (1.00) |
0.353 (1.00) |
0.847 (1.00) |
0.578 (1.00) |
0.221 (1.00) |
0.448 (1.00) |
| 4p gain | 14 (3%) | 530 |
0.133 (1.00) |
0.0693 (1.00) |
1 (1.00) |
0.263 (1.00) |
0.245 (1.00) |
0.181 (1.00) |
| 4q gain | 14 (3%) | 530 |
0.0595 (1.00) |
0.207 (1.00) |
0.789 (1.00) |
0.263 (1.00) |
0.0443 (1.00) |
0.181 (1.00) |
| 5p gain | 28 (5%) | 516 |
0.916 (1.00) |
0.206 (1.00) |
0.697 (1.00) |
0.0435 (1.00) |
0.144 (1.00) |
0.564 (1.00) |
| 5q gain | 21 (4%) | 523 |
0.711 (1.00) |
0.52 (1.00) |
0.497 (1.00) |
0.301 (1.00) |
0.238 (1.00) |
1 (1.00) |
| 8p gain | 25 (5%) | 519 |
0.531 (1.00) |
0.716 (1.00) |
0.678 (1.00) |
0.199 (1.00) |
0.666 (1.00) |
0.686 (1.00) |
| 8q gain | 31 (6%) | 513 |
0.833 (1.00) |
0.205 (1.00) |
0.345 (1.00) |
0.389 (1.00) |
1 (1.00) |
1 (1.00) |
| 9p gain | 17 (3%) | 527 |
0.24 (1.00) |
0.0378 (1.00) |
0.314 (1.00) |
0.00622 (1.00) |
0.6 (1.00) |
0.461 (1.00) |
| 9q gain | 33 (6%) | 511 |
0.0487 (1.00) |
0.0409 (1.00) |
0.0968 (1.00) |
0.0256 (1.00) |
0.701 (1.00) |
0.592 (1.00) |
| 11p gain | 4 (1%) | 540 |
0.568 (1.00) |
0.383 (1.00) |
0.65 (1.00) |
0.841 (1.00) |
1 (1.00) |
0.351 (1.00) |
| 11q gain | 6 (1%) | 538 |
0.167 (1.00) |
0.14 (1.00) |
0.411 (1.00) |
0.112 (1.00) |
0.67 (1.00) |
0.688 (1.00) |
| 12p gain | 39 (7%) | 505 |
0.986 (1.00) |
0.175 (1.00) |
1 (1.00) |
0.686 (1.00) |
0.722 (1.00) |
0.622 (1.00) |
| 12q gain | 29 (5%) | 515 |
0.609 (1.00) |
0.59 (1.00) |
0.563 (1.00) |
0.53 (1.00) |
0.417 (1.00) |
0.568 (1.00) |
| 13q gain | 3 (1%) | 541 |
0.991 (1.00) |
0.104 (1.00) |
0.0612 (1.00) |
0.0329 (1.00) |
0.607 (1.00) |
|
| 14q gain | 6 (1%) | 538 |
0.0771 (1.00) |
0.816 (1.00) |
0.685 (1.00) |
0.514 (1.00) |
1 (1.00) |
1 (1.00) |
| 15q gain | 4 (1%) | 540 |
0.715 (1.00) |
0.304 (1.00) |
0.65 (1.00) |
0.292 (1.00) |
1 (1.00) |
1 (1.00) |
| 16p gain | 17 (3%) | 527 |
0.044 (1.00) |
0.0244 (1.00) |
0.13 (1.00) |
0.71 (1.00) |
0.11 (1.00) |
0.806 (1.00) |
| 16q gain | 17 (3%) | 527 |
0.0449 (1.00) |
0.0676 (1.00) |
0.0422 (1.00) |
0.971 (1.00) |
0.291 (1.00) |
0.806 (1.00) |
| 17p gain | 10 (2%) | 534 |
0.0168 (1.00) |
0.0354 (1.00) |
0.747 (1.00) |
0.0913 (1.00) |
1 (1.00) |
1 (1.00) |
| 17q gain | 19 (3%) | 525 |
0.189 (1.00) |
0.0755 (1.00) |
1 (1.00) |
0.0146 (1.00) |
0.803 (1.00) |
0.361 (1.00) |
| 18p gain | 26 (5%) | 518 |
0.848 (1.00) |
0.929 (1.00) |
1 (1.00) |
0.0964 (1.00) |
0.831 (1.00) |
1 (1.00) |
| 18q gain | 28 (5%) | 516 |
0.82 (1.00) |
0.938 (1.00) |
0.697 (1.00) |
0.301 (1.00) |
0.836 (1.00) |
1 (1.00) |
| 19p gain | 171 (31%) | 373 |
0.196 (1.00) |
0.439 (1.00) |
0.778 (1.00) |
0.78 (1.00) |
0.277 (1.00) |
0.645 (1.00) |
| 19q gain | 148 (27%) | 396 |
0.166 (1.00) |
0.22 (1.00) |
0.694 (1.00) |
0.773 (1.00) |
0.918 (1.00) |
0.387 (1.00) |
| 20q gain | 171 (31%) | 373 |
0.76 (1.00) |
0.000742 (0.341) |
0.706 (1.00) |
0.34 (1.00) |
0.199 (1.00) |
0.927 (1.00) |
| 21q gain | 32 (6%) | 512 |
0.137 (1.00) |
0.856 (1.00) |
1 (1.00) |
0.634 (1.00) |
0.439 (1.00) |
0.586 (1.00) |
| 22q gain | 11 (2%) | 533 |
0.97 (1.00) |
0.391 (1.00) |
1 (1.00) |
0.968 (1.00) |
0.516 (1.00) |
0.764 (1.00) |
| Xq gain | 3 (1%) | 541 |
0.128 (1.00) |
0.593 (1.00) |
1 (1.00) |
1 (1.00) |
1 (1.00) |
|
| 1p loss | 5 (1%) | 539 |
0.0339 (1.00) |
0.844 (1.00) |
0.653 (1.00) |
0.69 (1.00) |
0.659 (1.00) |
0.197 (1.00) |
| 1q loss | 5 (1%) | 539 |
0.896 (1.00) |
0.197 (1.00) |
1 (1.00) |
0.127 (1.00) |
0.659 (1.00) |
0.673 (1.00) |
| 2p loss | 10 (2%) | 534 |
0.179 (1.00) |
0.516 (1.00) |
0.204 (1.00) |
0.76 (1.00) |
1 (1.00) |
1 (1.00) |
| 2q loss | 9 (2%) | 535 |
0.235 (1.00) |
0.743 (1.00) |
0.328 (1.00) |
0.76 (1.00) |
0.725 (1.00) |
1 (1.00) |
| 3p loss | 22 (4%) | 522 |
0.293 (1.00) |
0.0224 (1.00) |
1 (1.00) |
0.846 (1.00) |
0.0184 (1.00) |
0.0791 (1.00) |
| 3q loss | 16 (3%) | 528 |
0.774 (1.00) |
0.231 (1.00) |
0.44 (1.00) |
0.708 (1.00) |
0.29 (1.00) |
0.804 (1.00) |
| 4p loss | 25 (5%) | 519 |
0.14 (1.00) |
0.297 (1.00) |
0.142 (1.00) |
0.825 (1.00) |
0.083 (1.00) |
1 (1.00) |
| 4q loss | 23 (4%) | 521 |
0.162 (1.00) |
0.249 (1.00) |
0.828 (1.00) |
0.15 (1.00) |
0.651 (1.00) |
0.832 (1.00) |
| 5p loss | 21 (4%) | 523 |
0.0545 (1.00) |
0.277 (1.00) |
0.821 (1.00) |
0.503 (1.00) |
0.238 (1.00) |
1 (1.00) |
| 5q loss | 20 (4%) | 524 |
0.0597 (1.00) |
0.294 (1.00) |
0.645 (1.00) |
0.786 (1.00) |
0.33 (1.00) |
1 (1.00) |
| 6p loss | 46 (8%) | 498 |
0.0111 (1.00) |
0.776 (1.00) |
0.875 (1.00) |
0.734 (1.00) |
0.742 (1.00) |
0.76 (1.00) |
| 6q loss | 79 (15%) | 465 |
0.277 (1.00) |
0.656 (1.00) |
0.534 (1.00) |
0.581 (1.00) |
0.897 (1.00) |
0.808 (1.00) |
| 7p loss | 5 (1%) | 539 |
0.514 (1.00) |
0.658 (1.00) |
1 (1.00) |
0.61 (1.00) |
1 (1.00) |
0.673 (1.00) |
| 7q loss | 4 (1%) | 540 |
0.617 (1.00) |
0.362 (1.00) |
1 (1.00) |
1 (1.00) |
0.351 (1.00) |
|
| 8p loss | 34 (6%) | 510 |
0.972 (1.00) |
0.422 (1.00) |
0.209 (1.00) |
0.541 (1.00) |
0.0233 (1.00) |
0.482 (1.00) |
| 8q loss | 21 (4%) | 523 |
0.921 (1.00) |
0.27 (1.00) |
0.497 (1.00) |
0.133 (1.00) |
0.0294 (1.00) |
1 (1.00) |
| 9p loss | 158 (29%) | 386 |
0.628 (1.00) |
0.47 (1.00) |
0.63 (1.00) |
0.427 (1.00) |
0.363 (1.00) |
0.395 (1.00) |
| 9q loss | 62 (11%) | 482 |
0.339 (1.00) |
0.534 (1.00) |
0.0125 (1.00) |
0.384 (1.00) |
0.885 (1.00) |
0.418 (1.00) |
| 11p loss | 64 (12%) | 480 |
0.312 (1.00) |
0.222 (1.00) |
0.221 (1.00) |
0.89 (1.00) |
0.254 (1.00) |
0.895 (1.00) |
| 11q loss | 55 (10%) | 489 |
0.921 (1.00) |
0.903 (1.00) |
0.772 (1.00) |
0.934 (1.00) |
0.0326 (1.00) |
0.2 (1.00) |
| 12p loss | 36 (7%) | 508 |
0.968 (1.00) |
0.434 (1.00) |
1 (1.00) |
0.61 (1.00) |
0.46 (1.00) |
1 (1.00) |
| 12q loss | 33 (6%) | 511 |
0.969 (1.00) |
0.434 (1.00) |
1 (1.00) |
0.372 (1.00) |
0.85 (1.00) |
1 (1.00) |
| 13q loss | 134 (25%) | 410 |
0.783 (1.00) |
0.288 (1.00) |
0.417 (1.00) |
0.538 (1.00) |
0.915 (1.00) |
0.551 (1.00) |
| 14q loss | 120 (22%) | 424 |
0.995 (1.00) |
0.891 (1.00) |
0.752 (1.00) |
0.769 (1.00) |
1 (1.00) |
0.215 (1.00) |
| 15q loss | 62 (11%) | 482 |
0.433 (1.00) |
0.181 (1.00) |
0.132 (1.00) |
0.486 (1.00) |
0.25 (1.00) |
1 (1.00) |
| 16p loss | 23 (4%) | 521 |
0.155 (1.00) |
0.119 (1.00) |
0.514 (1.00) |
0.0929 (1.00) |
1 (1.00) |
0.134 (1.00) |
| 16q loss | 41 (8%) | 503 |
0.0596 (1.00) |
0.995 (1.00) |
1 (1.00) |
0.204 (1.00) |
0.862 (1.00) |
0.0761 (1.00) |
| 17p loss | 34 (6%) | 510 |
0.715 (1.00) |
0.351 (1.00) |
0.59 (1.00) |
0.877 (1.00) |
1 (1.00) |
0.482 (1.00) |
| 17q loss | 19 (3%) | 525 |
0.936 (1.00) |
0.315 (1.00) |
0.815 (1.00) |
0.62 (1.00) |
0.626 (1.00) |
0.649 (1.00) |
| 18p loss | 43 (8%) | 501 |
0.302 (1.00) |
0.768 (1.00) |
0.871 (1.00) |
0.625 (1.00) |
0.612 (1.00) |
1 (1.00) |
| 18q loss | 37 (7%) | 507 |
0.432 (1.00) |
0.577 (1.00) |
0.486 (1.00) |
0.198 (1.00) |
0.468 (1.00) |
1 (1.00) |
| 19p loss | 12 (2%) | 532 |
0.469 (1.00) |
0.316 (1.00) |
0.554 (1.00) |
0.968 (1.00) |
1 (1.00) |
0.563 (1.00) |
| 19q loss | 16 (3%) | 528 |
0.129 (1.00) |
0.945 (1.00) |
0.797 (1.00) |
0.535 (1.00) |
1 (1.00) |
0.31 (1.00) |
| 20p loss | 11 (2%) | 533 |
0.456 (1.00) |
0.14 (1.00) |
0.357 (1.00) |
0.7 (1.00) |
0.752 (1.00) |
0.764 (1.00) |
| 20q loss | 10 (2%) | 534 |
0.473 (1.00) |
0.468 (1.00) |
0.527 (1.00) |
0.612 (1.00) |
0.304 (1.00) |
1 (1.00) |
| 21q loss | 26 (5%) | 518 |
0.978 (1.00) |
0.302 (1.00) |
0.151 (1.00) |
0.629 (1.00) |
0.831 (1.00) |
0.551 (1.00) |
| 22q loss | 138 (25%) | 406 |
0.647 (1.00) |
0.0288 (1.00) |
0.764 (1.00) |
0.613 (1.00) |
1 (1.00) |
0.768 (1.00) |
| Xq loss | 11 (2%) | 533 |
0.23 (1.00) |
0.0255 (1.00) |
0.759 (1.00) |
0.914 (1.00) |
0.516 (1.00) |
0.55 (1.00) |
P value = 0.000254 (t-test), Q value = 0.12
Table S1. Gene #11: '6p gain mutation analysis' versus Clinical Feature #4: 'KARNOFSKY.PERFORMANCE.SCORE'
| nPatients | Mean (Std.Dev) | |
|---|---|---|
| ALL | 409 | 77.3 (14.7) |
| 6P GAIN MUTATED | 4 | 80.0 (0.0) |
| 6P GAIN WILD-TYPE | 405 | 77.3 (14.8) |
Figure S1. Get High-res Image Gene #11: '6p gain mutation analysis' versus Clinical Feature #4: 'KARNOFSKY.PERFORMANCE.SCORE'
P value = 0.000254 (t-test), Q value = 0.12
Table S2. Gene #12: '6q gain mutation analysis' versus Clinical Feature #4: 'KARNOFSKY.PERFORMANCE.SCORE'
| nPatients | Mean (Std.Dev) | |
|---|---|---|
| ALL | 409 | 77.3 (14.7) |
| 6Q GAIN MUTATED | 5 | 80.0 (0.0) |
| 6Q GAIN WILD-TYPE | 404 | 77.3 (14.8) |
Figure S2. Get High-res Image Gene #12: '6q gain mutation analysis' versus Clinical Feature #4: 'KARNOFSKY.PERFORMANCE.SCORE'

P value = 7.79e-06 (t-test), Q value = 0.0037
Table S3. Gene #13: '7p gain mutation analysis' versus Clinical Feature #2: 'AGE'
| nPatients | Mean (Std.Dev) | |
|---|---|---|
| ALL | 544 | 57.8 (14.3) |
| 7P GAIN MUTATED | 423 | 59.7 (12.3) |
| 7P GAIN WILD-TYPE | 121 | 51.4 (18.5) |
Figure S3. Get High-res Image Gene #13: '7p gain mutation analysis' versus Clinical Feature #2: 'AGE'
P value = 1.04e-05 (t-test), Q value = 0.0049
Table S4. Gene #14: '7q gain mutation analysis' versus Clinical Feature #2: 'AGE'
| nPatients | Mean (Std.Dev) | |
|---|---|---|
| ALL | 544 | 57.8 (14.3) |
| 7Q GAIN MUTATED | 427 | 59.6 (12.1) |
| 7Q GAIN WILD-TYPE | 117 | 51.2 (19.0) |
Figure S4. Get High-res Image Gene #14: '7q gain mutation analysis' versus Clinical Feature #2: 'AGE'

P value = 9.55e-05 (t-test), Q value = 0.045
Table S5. Gene #19: '10p gain mutation analysis' versus Clinical Feature #2: 'AGE'
| nPatients | Mean (Std.Dev) | |
|---|---|---|
| ALL | 544 | 57.8 (14.3) |
| 10P GAIN MUTATED | 11 | 34.3 (12.9) |
| 10P GAIN WILD-TYPE | 533 | 58.3 (13.9) |
Figure S5. Get High-res Image Gene #19: '10p gain mutation analysis' versus Clinical Feature #2: 'AGE'
P value = 0.000254 (t-test), Q value = 0.12
Table S6. Gene #19: '10p gain mutation analysis' versus Clinical Feature #4: 'KARNOFSKY.PERFORMANCE.SCORE'
| nPatients | Mean (Std.Dev) | |
|---|---|---|
| ALL | 409 | 77.3 (14.7) |
| 10P GAIN MUTATED | 11 | 80.0 (0.0) |
| 10P GAIN WILD-TYPE | 398 | 77.2 (14.9) |
Figure S6. Get High-res Image Gene #19: '10p gain mutation analysis' versus Clinical Feature #4: 'KARNOFSKY.PERFORMANCE.SCORE'

P value = 0.000315 (t-test), Q value = 0.15
Table S7. Gene #35: '20p gain mutation analysis' versus Clinical Feature #2: 'AGE'
| nPatients | Mean (Std.Dev) | |
|---|---|---|
| ALL | 544 | 57.8 (14.3) |
| 20P GAIN MUTATED | 174 | 60.9 (13.1) |
| 20P GAIN WILD-TYPE | 370 | 56.4 (14.6) |
Figure S7. Get High-res Image Gene #35: '20p gain mutation analysis' versus Clinical Feature #2: 'AGE'
P value = 5.52e-05 (logrank test), Q value = 0.026
Table S8. Gene #58: '10p loss mutation analysis' versus Clinical Feature #1: 'Time to Death'
| nPatients | nDeath | Duration Range (Median), Month | |
|---|---|---|---|
| ALL | 544 | 411 | 0.1 - 127.6 (9.6) |
| 10P LOSS MUTATED | 422 | 321 | 0.1 - 127.6 (9.3) |
| 10P LOSS WILD-TYPE | 122 | 90 | 0.2 - 108.8 (10.8) |
Figure S8. Get High-res Image Gene #58: '10p loss mutation analysis' versus Clinical Feature #1: 'Time to Death'
P value = 3.12e-10 (t-test), Q value = 1.5e-07
Table S9. Gene #58: '10p loss mutation analysis' versus Clinical Feature #2: 'AGE'
| nPatients | Mean (Std.Dev) | |
|---|---|---|
| ALL | 544 | 57.8 (14.3) |
| 10P LOSS MUTATED | 422 | 60.5 (11.7) |
| 10P LOSS WILD-TYPE | 122 | 48.7 (18.2) |
Figure S9. Get High-res Image Gene #58: '10p loss mutation analysis' versus Clinical Feature #2: 'AGE'
P value = 1.21e-07 (t-test), Q value = 5.7e-05
Table S10. Gene #59: '10q loss mutation analysis' versus Clinical Feature #2: 'AGE'
| nPatients | Mean (Std.Dev) | |
|---|---|---|
| ALL | 544 | 57.8 (14.3) |
| 10Q LOSS MUTATED | 438 | 59.9 (12.4) |
| 10Q LOSS WILD-TYPE | 106 | 49.4 (18.2) |
Figure S10. Get High-res Image Gene #59: '10q loss mutation analysis' versus Clinical Feature #2: 'AGE'
-
Mutation data file = broad_values_by_arm.mutsig.cluster.txt
-
Clinical data file = GBM.clin.merged.picked.txt
-
Number of patients = 544
-
Number of significantly arm-level cnvs = 79
-
Number of selected clinical features = 6
-
Exclude genes that fewer than K tumors have mutations, K = 3
For survival clinical features, the Kaplan-Meier survival curves of tumors with and without gene mutations were plotted and the statistical significance P values were estimated by logrank test (Bland and Altman 2004) using the 'survdiff' function in R
For continuous numerical clinical features, two-tailed Student's t test with unequal variance (Lehmann and Romano 2005) was applied to compare the clinical values between tumors with and without gene mutations using 't.test' function in R
For binary or multi-class clinical features (nominal or ordinal), two-tailed Fisher's exact tests (Fisher 1922) were used to estimate the P values using the 'fisher.test' function in R
For multiple hypothesis correction, Q value is the False Discovery Rate (FDR) analogue of the P value (Benjamini and Hochberg 1995), defined as the minimum FDR at which the test may be called significant. We used the 'Benjamini and Hochberg' method of 'p.adjust' function in R to convert P values into Q values.
This is an experimental feature. The full results of the analysis summarized in this report can be downloaded from the TCGA Data Coordination Center.