This pipeline uses various statistical tests to identify genes whose promoter methylation levels correlated to selected clinical features.
Testing the association between 12759 genes and 6 clinical features across 280 samples, statistically thresholded by Q value < 0.05, 5 clinical features related to at least one genes.
-
2 genes correlated to 'Time to Death'.
-
RNF39 , TMEM106A
-
126 genes correlated to 'AGE'.
-
PRKCB , CYYR1 , KLF14 , ZNF540 , SRD5A2 , ...
-
7 genes correlated to 'GENDER'.
-
NUS1 , TLE1 , ZNF770 , BAG1 , GLUD1 , ...
-
2 genes correlated to 'KARNOFSKY.PERFORMANCE.SCORE'.
-
SORBS3 , STXBP6
-
1 gene correlated to 'RADIATIONS.RADIATION.REGIMENINDICATION'.
-
ADCY8
-
No genes correlated to 'NEOADJUVANT.THERAPY'
Complete statistical result table is provided in Supplement Table 1
Table 1. Get Full Table This table shows the clinical features, statistical methods used, and the number of genes that are significantly associated with each clinical feature at Q value < 0.05.
| Clinical feature | Statistical test | Significant genes | Associated with | Associated with | ||
|---|---|---|---|---|---|---|
| Time to Death | Cox regression test | N=2 | shorter survival | N=0 | longer survival | N=2 |
| AGE | Spearman correlation test | N=126 | older | N=110 | younger | N=16 |
| GENDER | t test | N=7 | male | N=1 | female | N=6 |
| KARNOFSKY PERFORMANCE SCORE | Spearman correlation test | N=2 | higher score | N=2 | lower score | N=0 |
| RADIATIONS RADIATION REGIMENINDICATION | t test | N=1 | yes | N=0 | no | N=1 |
| NEOADJUVANT THERAPY | t test | N=0 |
Table S1. Basic characteristics of clinical feature: 'Time to Death'
| Time to Death | Duration (Months) | 0.1-127.6 (median=10) |
| censored | N = 72 | |
| death | N = 208 | |
| Significant markers | N = 2 | |
| associated with shorter survival | 0 | |
| associated with longer survival | 2 |
Table S2. Get Full Table List of 2 genes significantly associated with 'Time to Death' by Cox regression test
| HazardRatio | Wald_P | Q | C_index | |
|---|---|---|---|---|
| RNF39 | 0.12 | 1.59e-06 | 0.02 | 0.432 |
| TMEM106A | 0.18 | 3.435e-06 | 0.044 | 0.449 |
Figure S1. Get High-res Image As an example, this figure shows the association of RNF39 to 'Time to Death'. four curves present the cumulative survival rates of 4 quartile subsets of patients. P value = 1.59e-06 with univariate Cox regression analysis using continuous log-2 expression values.
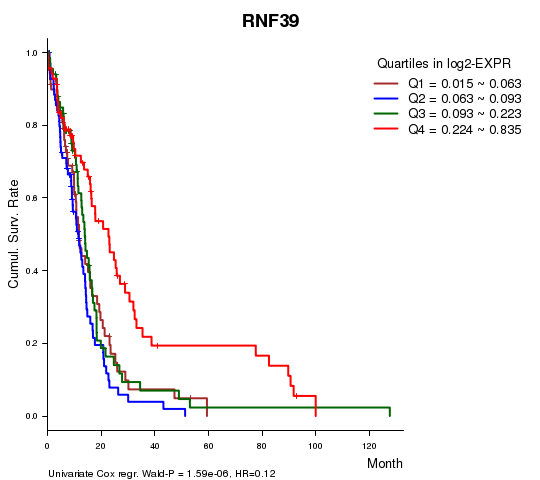
Table S3. Basic characteristics of clinical feature: 'AGE'
| AGE | Mean (SD) | 57.55 (15) |
| Significant markers | N = 126 | |
| pos. correlated | 110 | |
| neg. correlated | 16 |
Table S4. Get Full Table List of top 10 genes significantly correlated to 'AGE' by Spearman correlation test
| SpearmanCorr | corrP | Q | |
|---|---|---|---|
| PRKCB | 0.4226 | 1.485e-13 | 1.89e-09 |
| CYYR1 | 0.4156 | 4.066e-13 | 5.19e-09 |
| KLF14 | 0.3958 | 6.176e-12 | 7.88e-08 |
| ZNF540 | 0.3956 | 6.332e-12 | 8.08e-08 |
| SRD5A2 | 0.3904 | 1.252e-11 | 1.6e-07 |
| HOXD8 | 0.3887 | 1.553e-11 | 1.98e-07 |
| SYT10 | 0.3859 | 2.253e-11 | 2.87e-07 |
| HCN1 | 0.3755 | 8.292e-11 | 1.06e-06 |
| ZNF560 | 0.3749 | 8.98e-11 | 1.15e-06 |
| MACROD2 | 0.3711 | 1.425e-10 | 1.82e-06 |
Figure S2. Get High-res Image As an example, this figure shows the association of PRKCB to 'AGE'. P value = 1.48e-13 with Spearman correlation analysis. The straight line presents the best linear regression.
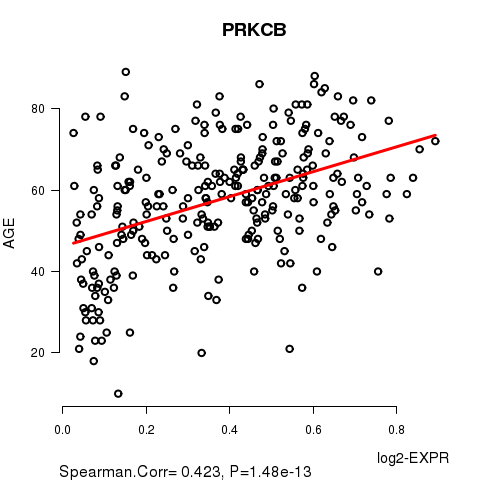
Table S5. Basic characteristics of clinical feature: 'GENDER'
| GENDER | Labels | N |
| FEMALE | 114 | |
| MALE | 166 | |
| Significant markers | N = 7 | |
| Higher in MALE | 1 | |
| Higher in FEMALE | 6 |
Table S6. Get Full Table List of 7 genes differentially expressed by 'GENDER'
| T(pos if higher in 'MALE') | ttestP | Q | AUC | |
|---|---|---|---|---|
| NUS1 | -19.8 | 7.234e-39 | 9.23e-35 | 0.9729 |
| TLE1 | -11.83 | 4.131e-26 | 5.27e-22 | 0.8498 |
| ZNF770 | -9.36 | 5.873e-18 | 7.49e-14 | 0.7976 |
| BAG1 | 7.35 | 3.607e-12 | 4.6e-08 | 0.7828 |
| GLUD1 | -6.02 | 7.549e-09 | 9.63e-05 | 0.7209 |
| RAB9P1 | -5.49 | 9.499e-08 | 0.00121 | 0.7035 |
| SERBP1 | -5.51 | 1.051e-07 | 0.00134 | 0.6823 |
Figure S3. Get High-res Image As an example, this figure shows the association of NUS1 to 'GENDER'. P value = 7.23e-39 with T-test analysis.

2 genes related to 'KARNOFSKY.PERFORMANCE.SCORE'.
Table S7. Basic characteristics of clinical feature: 'KARNOFSKY.PERFORMANCE.SCORE'
| KARNOFSKY.PERFORMANCE.SCORE | Mean (SD) | 75.35 (15) |
| Significant markers | N = 2 | |
| pos. correlated | 2 | |
| neg. correlated | 0 |
Table S8. Get Full Table List of 2 genes significantly correlated to 'KARNOFSKY.PERFORMANCE.SCORE' by Spearman correlation test
| SpearmanCorr | corrP | Q | |
|---|---|---|---|
| SORBS3 | 0.3188 | 2.157e-06 | 0.0275 |
| STXBP6 | 0.3115 | 3.557e-06 | 0.0454 |
Figure S4. Get High-res Image As an example, this figure shows the association of SORBS3 to 'KARNOFSKY.PERFORMANCE.SCORE'. P value = 2.16e-06 with Spearman correlation analysis. The straight line presents the best linear regression.

One gene related to 'RADIATIONS.RADIATION.REGIMENINDICATION'.
Table S9. Basic characteristics of clinical feature: 'RADIATIONS.RADIATION.REGIMENINDICATION'
| RADIATIONS.RADIATION.REGIMENINDICATION | Labels | N |
| NO | 206 | |
| YES | 74 | |
| Significant markers | N = 1 | |
| Higher in YES | 0 | |
| Higher in NO | 1 |
Table S10. Get Full Table List of one gene differentially expressed by 'RADIATIONS.RADIATION.REGIMENINDICATION'
| T(pos if higher in 'YES') | ttestP | Q | AUC | |
|---|---|---|---|---|
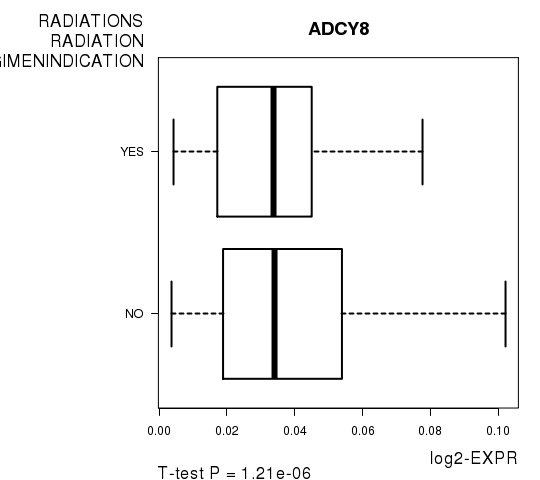
| ADCY8 | -4.99 | 1.212e-06 | 0.0155 | 0.5544 |
Figure S5. Get High-res Image As an example, this figure shows the association of ADCY8 to 'RADIATIONS.RADIATION.REGIMENINDICATION'. P value = 1.21e-06 with T-test analysis.
-
Expresson data file = GBM.meth.for_correlation.filtered_data.txt
-
Clinical data file = GBM.clin.merged.picked.txt
-
Number of patients = 280
-
Number of genes = 12759
-
Number of clinical features = 6
For survival clinical features, Wald's test in univariate Cox regression analysis with proportional hazards model (Andersen and Gill 1982) was used to estimate the P values using the 'coxph' function in R. Kaplan-Meier survival curves were plot using the four quartile subgroups of patients based on expression levels
For continuous numerical clinical features, Spearman's rank correlation coefficients (Spearman 1904) and two-tailed P values were estimated using 'cor.test' function in R
For two-class clinical features, two-tailed Student's t test with unequal variance (Lehmann and Romano 2005) was applied to compare the log2-expression levels between the two clinical classes using 't.test' function in R
For multiple hypothesis correction, Q value is the False Discovery Rate (FDR) analogue of the P value (Benjamini and Hochberg 1995), defined as the minimum FDR at which the test may be called significant. We used the 'Benjamini and Hochberg' method of 'p.adjust' function in R to convert P values into Q values.
This is an experimental feature. The full results of the analysis summarized in this report can be downloaded from the TCGA Data Coordination Center.