This pipeline uses various statistical tests to identify RPPAs whose expression levels correlated to selected clinical features.
Testing the association between 174 genes and 8 clinical features across 212 samples, statistically thresholded by Q value < 0.05, 5 clinical features related to at least one genes.
-
1 gene correlated to 'Time to Death'.
-
SMAD3|SMAD3-R-V
-
2 genes correlated to 'GENDER'.
-
MAPK14|P38_PT180_Y182-R-V , PTGS2|COX-2-R-C
-
6 genes correlated to 'PATHOLOGY.T'.
-
MAPK1 MAPK3|MAPK_PT202_Y204-R-V , RPS6|S6_PS235_S236-R-V , AKT1 AKT2 AKT3|AKT_PS473-R-V , MAPK14|P38_PT180_Y182-R-V , SRC|SRC_PY527-R-V , ...
-
3 genes correlated to 'PATHOLOGY.N'.
-
SRC|SRC_PY416-R-C , ANXA1|ANNEXIN_I-R-V , YAP1|YAP_PS127-R-C
-
3 genes correlated to 'TUMOR.STAGE'.
-
MAPK1 MAPK3|MAPK_PT202_Y204-R-V , RPS6|S6_PS235_S236-R-V , ARID1A|ARID1A-M-V
-
No genes correlated to 'AGE', 'RADIATIONS.RADIATION.REGIMENINDICATION', and 'NEOADJUVANT.THERAPY'.
Complete statistical result table is provided in Supplement Table 1
Table 1. Get Full Table This table shows the clinical features, statistical methods used, and the number of genes that are significantly associated with each clinical feature at Q value < 0.05.
| Clinical feature | Statistical test | Significant genes | Associated with | Associated with | ||
|---|---|---|---|---|---|---|
| Time to Death | Cox regression test | N=1 | shorter survival | N=1 | longer survival | N=0 |
| AGE | Spearman correlation test | N=0 | ||||
| GENDER | t test | N=2 | male | N=1 | female | N=1 |
| PATHOLOGY T | Spearman correlation test | N=6 | higher pT | N=1 | lower pT | N=5 |
| PATHOLOGY N | Spearman correlation test | N=3 | higher pN | N=0 | lower pN | N=3 |
| TUMOR STAGE | Spearman correlation test | N=3 | higher stage | N=1 | lower stage | N=2 |
| RADIATIONS RADIATION REGIMENINDICATION | t test | N=0 | ||||
| NEOADJUVANT THERAPY | t test | N=0 |
Table S1. Basic characteristics of clinical feature: 'Time to Death'
| Time to Death | Duration (Months) | 0.1-210.9 (median=13.2) |
| censored | N = 105 | |
| death | N = 107 | |
| Significant markers | N = 1 | |
| associated with shorter survival | 1 | |
| associated with longer survival | 0 |
Table S2. Get Full Table List of one gene significantly associated with 'Time to Death' by Cox regression test
| HazardRatio | Wald_P | Q | C_index | |
|---|---|---|---|---|
| SMAD3|SMAD3-R-V | 3.5 | 0.0001519 | 0.026 | 0.581 |
Figure S1. Get High-res Image As an example, this figure shows the association of SMAD3|SMAD3-R-V to 'Time to Death'. four curves present the cumulative survival rates of 4 quartile subsets of patients. P value = 0.000152 with univariate Cox regression analysis using continuous log-2 expression values.

Table S3. Basic characteristics of clinical feature: 'AGE'
| AGE | Mean (SD) | 62.12 (12) |
| Significant markers | N = 0 |
Table S4. Basic characteristics of clinical feature: 'GENDER'
| GENDER | Labels | N |
| FEMALE | 62 | |
| MALE | 150 | |
| Significant markers | N = 2 | |
| Higher in MALE | 1 | |
| Higher in FEMALE | 1 |
Table S5. Get Full Table List of 2 genes differentially expressed by 'GENDER'
| T(pos if higher in 'MALE') | ttestP | Q | AUC | |
|---|---|---|---|---|
| MAPK14|P38_PT180_Y182-R-V | -3.89 | 0.0001658 | 0.0289 | 0.6641 |
| PTGS2|COX-2-R-C | 3.85 | 0.0001671 | 0.0289 | 0.6258 |
Figure S2. Get High-res Image As an example, this figure shows the association of MAPK14|P38_PT180_Y182-R-V to 'GENDER'. P value = 0.000166 with T-test analysis.
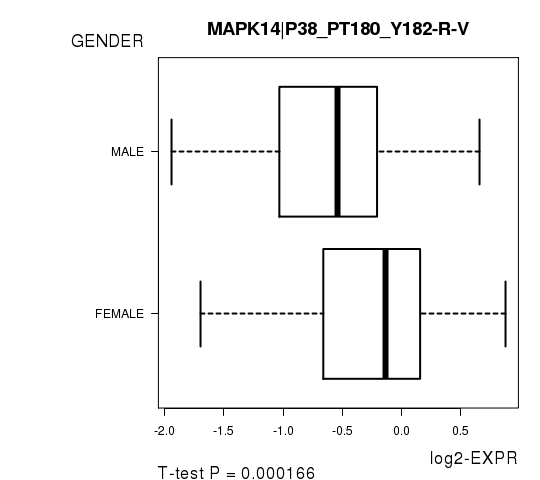
Table S6. Basic characteristics of clinical feature: 'PATHOLOGY.T'
| PATHOLOGY.T | Mean (SD) | 2.97 (0.97) |
| N | ||
| T1 | 13 | |
| T2 | 59 | |
| T3 | 53 | |
| T4 | 79 | |
| Significant markers | N = 6 | |
| pos. correlated | 1 | |
| neg. correlated | 5 |
Table S7. Get Full Table List of 6 genes significantly correlated to 'PATHOLOGY.T' by Spearman correlation test
| SpearmanCorr | corrP | Q | |
|---|---|---|---|
| MAPK1 MAPK3|MAPK_PT202_Y204-R-V | -0.3357 | 9.18e-07 | 0.00016 |
| RPS6|S6_PS235_S236-R-V | -0.3082 | 7.28e-06 | 0.00126 |
| AKT1 AKT2 AKT3|AKT_PS473-R-V | -0.2946 | 1.895e-05 | 0.00326 |
| MAPK14|P38_PT180_Y182-R-V | -0.2753 | 6.742e-05 | 0.0115 |
| SRC|SRC_PY527-R-V | -0.2737 | 7.472e-05 | 0.0127 |
| ARID1A|ARID1A-M-V | 0.2583 | 0.0001914 | 0.0324 |
Figure S3. Get High-res Image As an example, this figure shows the association of MAPK1 MAPK3|MAPK_PT202_Y204-R-V to 'PATHOLOGY.T'. P value = 9.18e-07 with Spearman correlation analysis.
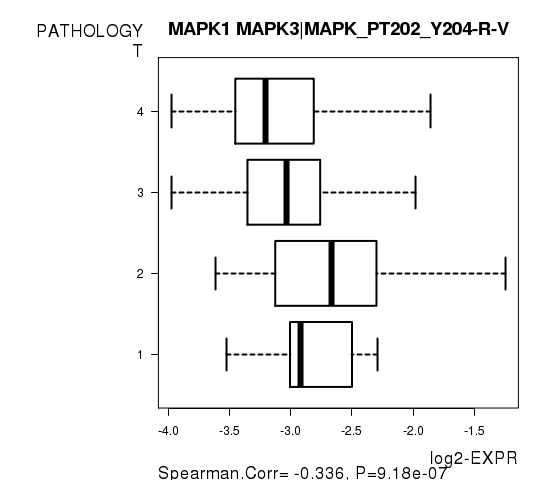
Table S8. Basic characteristics of clinical feature: 'PATHOLOGY.N'
| PATHOLOGY.N | Mean (SD) | 1.08 (0.98) |
| N | ||
| N0 | 73 | |
| N1 | 20 | |
| N2 | 79 | |
| N3 | 4 | |
| Significant markers | N = 3 | |
| pos. correlated | 0 | |
| neg. correlated | 3 |
Table S9. Get Full Table List of 3 genes significantly correlated to 'PATHOLOGY.N' by Spearman correlation test
| SpearmanCorr | corrP | Q | |
|---|---|---|---|
| SRC|SRC_PY416-R-C | -0.3346 | 5.657e-06 | 0.000984 |
| ANXA1|ANNEXIN_I-R-V | -0.333 | 6.325e-06 | 0.00109 |
| YAP1|YAP_PS127-R-C | -0.2977 | 5.998e-05 | 0.0103 |
Figure S4. Get High-res Image As an example, this figure shows the association of SRC|SRC_PY416-R-C to 'PATHOLOGY.N'. P value = 5.66e-06 with Spearman correlation analysis.

Table S10. Basic characteristics of clinical feature: 'TUMOR.STAGE'
| TUMOR.STAGE | Mean (SD) | 3.32 (0.94) |
| N | ||
| Stage 1 | 9 | |
| Stage 2 | 39 | |
| Stage 3 | 31 | |
| Stage 4 | 121 | |
| Significant markers | N = 3 | |
| pos. correlated | 1 | |
| neg. correlated | 2 |
Table S11. Get Full Table List of 3 genes significantly correlated to 'TUMOR.STAGE' by Spearman correlation test
| SpearmanCorr | corrP | Q | |
|---|---|---|---|
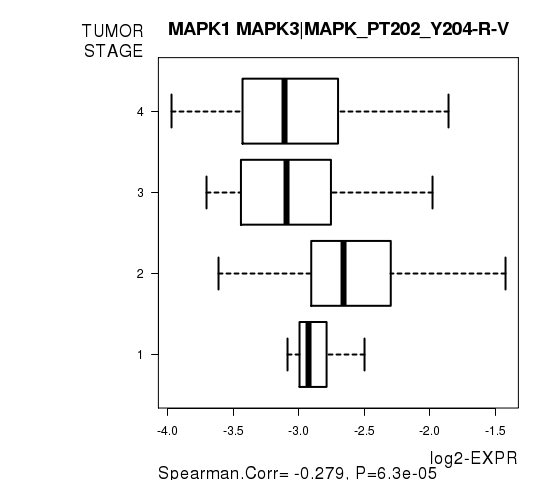
| MAPK1 MAPK3|MAPK_PT202_Y204-R-V | -0.279 | 6.297e-05 | 0.011 |
| RPS6|S6_PS235_S236-R-V | -0.2744 | 8.411e-05 | 0.0146 |
| ARID1A|ARID1A-M-V | 0.2711 | 0.0001032 | 0.0177 |
Figure S5. Get High-res Image As an example, this figure shows the association of MAPK1 MAPK3|MAPK_PT202_Y204-R-V to 'TUMOR.STAGE'. P value = 6.3e-05 with Spearman correlation analysis.
No gene related to 'RADIATIONS.RADIATION.REGIMENINDICATION'.
Table S12. Basic characteristics of clinical feature: 'RADIATIONS.RADIATION.REGIMENINDICATION'
| RADIATIONS.RADIATION.REGIMENINDICATION | Labels | N |
| NO | 56 | |
| YES | 156 | |
| Significant markers | N = 0 |
-
Expresson data file = HNSC.rppa.txt
-
Clinical data file = HNSC.clin.merged.picked.txt
-
Number of patients = 212
-
Number of genes = 174
-
Number of clinical features = 8
For survival clinical features, Wald's test in univariate Cox regression analysis with proportional hazards model (Andersen and Gill 1982) was used to estimate the P values using the 'coxph' function in R. Kaplan-Meier survival curves were plot using the four quartile subgroups of patients based on expression levels
For continuous numerical clinical features, Spearman's rank correlation coefficients (Spearman 1904) and two-tailed P values were estimated using 'cor.test' function in R
For two-class clinical features, two-tailed Student's t test with unequal variance (Lehmann and Romano 2005) was applied to compare the log2-expression levels between the two clinical classes using 't.test' function in R
For multiple hypothesis correction, Q value is the False Discovery Rate (FDR) analogue of the P value (Benjamini and Hochberg 1995), defined as the minimum FDR at which the test may be called significant. We used the 'Benjamini and Hochberg' method of 'p.adjust' function in R to convert P values into Q values.
This is an experimental feature. The full results of the analysis summarized in this report can be downloaded from the TCGA Data Coordination Center.