This pipeline uses various statistical tests to identify mRNAs whose expression levels correlated to selected clinical features.
Testing the association between 18327 genes and 8 clinical features across 229 samples, statistically thresholded by Q value < 0.05, 5 clinical features related to at least one genes.
-
11 genes correlated to 'Time to Death'.
-
CYB5B|80777 , FGD3|89846 , TXNDC9|10190 , ODF3B|440836 , SLC25A45|283130 , ...
-
24 genes correlated to 'GENDER'.
-
XIST|7503 , PRKY|5616 , ZFY|7544 , RPS4Y1|6192 , TSIX|9383 , ...
-
3 genes correlated to 'PATHOLOGY.T'.
-
SAMD8|142891 , LRRC8A|56262 , USP32|84669
-
1 gene correlated to 'TUMOR.STAGE'.
-
SAMD8|142891
-
1 gene correlated to 'NEOADJUVANT.THERAPY'.
-
NBPF14|25832
-
No genes correlated to 'AGE', 'PATHOLOGY.N', and 'RADIATIONS.RADIATION.REGIMENINDICATION'.
Complete statistical result table is provided in Supplement Table 1
Table 1. Get Full Table This table shows the clinical features, statistical methods used, and the number of genes that are significantly associated with each clinical feature at Q value < 0.05.
| Clinical feature | Statistical test | Significant genes | Associated with | Associated with | ||
|---|---|---|---|---|---|---|
| Time to Death | Cox regression test | N=11 | shorter survival | N=4 | longer survival | N=7 |
| AGE | Spearman correlation test | N=0 | ||||
| GENDER | t test | N=24 | male | N=9 | female | N=15 |
| PATHOLOGY T | Spearman correlation test | N=3 | higher pT | N=3 | lower pT | N=0 |
| PATHOLOGY N | Spearman correlation test | N=0 | ||||
| TUMOR STAGE | Spearman correlation test | N=1 | higher stage | N=1 | lower stage | N=0 |
| RADIATIONS RADIATION REGIMENINDICATION | t test | N=0 | ||||
| NEOADJUVANT THERAPY | t test | N=1 | yes | N=0 | no | N=1 |
Table S1. Basic characteristics of clinical feature: 'Time to Death'
| Time to Death | Duration (Months) | 0.1-210.9 (median=14.2) |
| censored | N = 132 | |
| death | N = 96 | |
| Significant markers | N = 11 | |
| associated with shorter survival | 4 | |
| associated with longer survival | 7 |
Table S2. Get Full Table List of top 10 genes significantly associated with 'Time to Death' by Cox regression test
| HazardRatio | Wald_P | Q | C_index | |
|---|---|---|---|---|
| CYB5B|80777 | 2.6 | 3.411e-08 | 0.00063 | 0.647 |
| FGD3|89846 | 0.63 | 1.075e-07 | 0.002 | 0.34 |
| TXNDC9|10190 | 2.2 | 9.283e-07 | 0.017 | 0.612 |
| ODF3B|440836 | 0.55 | 1.653e-06 | 0.03 | 0.37 |
| SLC25A45|283130 | 0.58 | 1.661e-06 | 0.03 | 0.347 |
| TMED2|10959 | 2.4 | 1.982e-06 | 0.036 | 0.663 |
| TOMM34|10953 | 2.3 | 2.219e-06 | 0.041 | 0.64 |
| ZNF266|10781 | 0.43 | 2.339e-06 | 0.043 | 0.354 |
| ZNF541|84215 | 0.79 | 2.556e-06 | 0.047 | 0.319 |
| REC8|9985 | 0.73 | 2.661e-06 | 0.049 | 0.371 |
Figure S1. Get High-res Image As an example, this figure shows the association of CYB5B|80777 to 'Time to Death'. four curves present the cumulative survival rates of 4 quartile subsets of patients. P value = 3.41e-08 with univariate Cox regression analysis using continuous log-2 expression values.
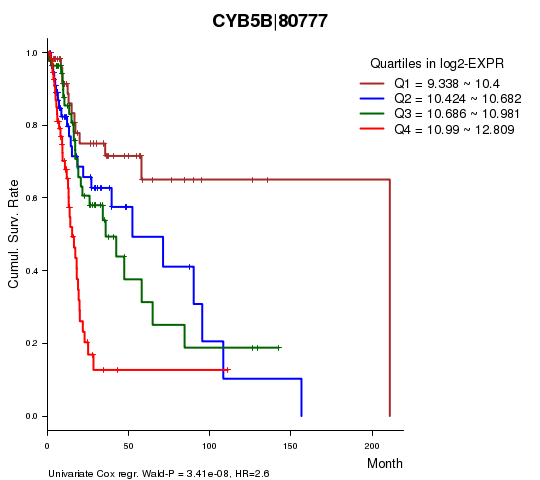
Table S3. Basic characteristics of clinical feature: 'AGE'
| AGE | Mean (SD) | 61.14 (12) |
| Significant markers | N = 0 |
Table S4. Basic characteristics of clinical feature: 'GENDER'
| GENDER | Labels | N |
| FEMALE | 59 | |
| MALE | 170 | |
| Significant markers | N = 24 | |
| Higher in MALE | 9 | |
| Higher in FEMALE | 15 |
Table S5. Get Full Table List of top 10 genes differentially expressed by 'GENDER'
| T(pos if higher in 'MALE') | ttestP | Q | AUC | |
|---|---|---|---|---|
| XIST|7503 | -31.56 | 6.652e-58 | 1.22e-53 | 0.9896 |
| PRKY|5616 | 19.55 | 1.722e-38 | 3.15e-34 | 0.9741 |
| ZFY|7544 | 24.07 | 2.762e-32 | 5.06e-28 | 0.9834 |
| RPS4Y1|6192 | 22.54 | 4.585e-26 | 8.4e-22 | 0.9837 |
| TSIX|9383 | -13.99 | 1.465e-25 | 2.68e-21 | 0.9639 |
| NLGN4Y|22829 | 17.69 | 4.072e-23 | 7.46e-19 | 0.974 |
| DDX3Y|8653 | 19.35 | 6.966e-20 | 1.28e-15 | 0.9733 |
| UTY|7404 | 14.45 | 1.16e-13 | 2.13e-09 | 0.9675 |
| HDHD1A|8226 | -8.24 | 3.306e-13 | 6.06e-09 | 0.8239 |
| USP9Y|8287 | 13.88 | 5.006e-13 | 9.17e-09 | 0.9658 |
Figure S2. Get High-res Image As an example, this figure shows the association of XIST|7503 to 'GENDER'. P value = 6.65e-58 with T-test analysis.

Table S6. Basic characteristics of clinical feature: 'PATHOLOGY.T'
| PATHOLOGY.T | Mean (SD) | 3.02 (0.97) |
| N | ||
| T1 | 12 | |
| T2 | 55 | |
| T3 | 47 | |
| T4 | 82 | |
| Significant markers | N = 3 | |
| pos. correlated | 3 | |
| neg. correlated | 0 |
Table S7. Get Full Table List of 3 genes significantly correlated to 'PATHOLOGY.T' by Spearman correlation test
| SpearmanCorr | corrP | Q | |
|---|---|---|---|
| SAMD8|142891 | 0.3574 | 2.711e-07 | 0.00497 |
| LRRC8A|56262 | 0.3444 | 7.729e-07 | 0.0142 |
| USP32|84669 | 0.3335 | 1.778e-06 | 0.0326 |
Figure S3. Get High-res Image As an example, this figure shows the association of SAMD8|142891 to 'PATHOLOGY.T'. P value = 2.71e-07 with Spearman correlation analysis.
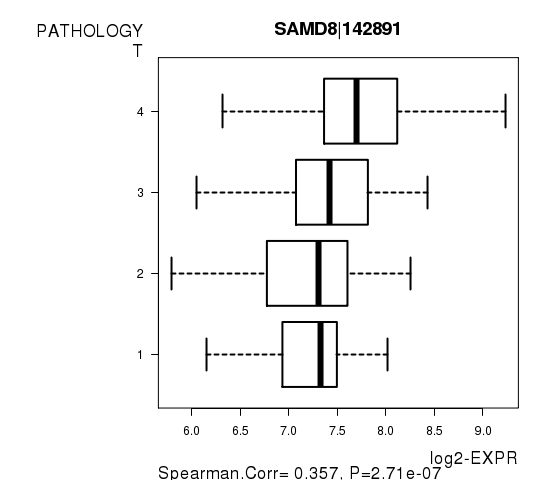
Table S8. Basic characteristics of clinical feature: 'PATHOLOGY.N'
| PATHOLOGY.N | Mean (SD) | 1.05 (0.96) |
| N | ||
| N0 | 73 | |
| N1 | 23 | |
| N2 | 76 | |
| N3 | 3 | |
| Significant markers | N = 0 |
Table S9. Basic characteristics of clinical feature: 'TUMOR.STAGE'
| TUMOR.STAGE | Mean (SD) | 3.36 (0.93) |
| N | ||
| Stage 1 | 9 | |
| Stage 2 | 34 | |
| Stage 3 | 29 | |
| Stage 4 | 121 | |
| Significant markers | N = 1 | |
| pos. correlated | 1 | |
| neg. correlated | 0 |
Table S10. Get Full Table List of one gene significantly correlated to 'TUMOR.STAGE' by Spearman correlation test
| SpearmanCorr | corrP | Q | |
|---|---|---|---|
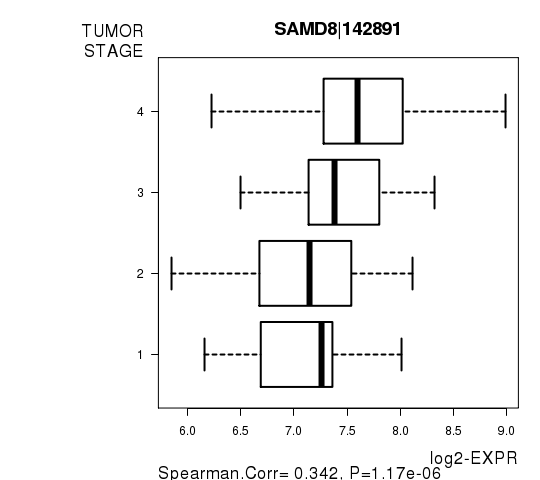
| SAMD8|142891 | 0.3415 | 1.172e-06 | 0.0215 |
Figure S4. Get High-res Image As an example, this figure shows the association of SAMD8|142891 to 'TUMOR.STAGE'. P value = 1.17e-06 with Spearman correlation analysis.
No gene related to 'RADIATIONS.RADIATION.REGIMENINDICATION'.
Table S11. Basic characteristics of clinical feature: 'RADIATIONS.RADIATION.REGIMENINDICATION'
| RADIATIONS.RADIATION.REGIMENINDICATION | Labels | N |
| NO | 62 | |
| YES | 167 | |
| Significant markers | N = 0 |
Table S12. Basic characteristics of clinical feature: 'NEOADJUVANT.THERAPY'
| NEOADJUVANT.THERAPY | Labels | N |
| NO | 38 | |
| YES | 191 | |
| Significant markers | N = 1 | |
| Higher in YES | 0 | |
| Higher in NO | 1 |
Table S13. Get Full Table List of one gene differentially expressed by 'NEOADJUVANT.THERAPY'
| T(pos if higher in 'YES') | ttestP | Q | AUC | |
|---|---|---|---|---|
| NBPF14|25832 | -5.21 | 1.663e-06 | 0.0305 | 0.7224 |
Figure S5. Get High-res Image As an example, this figure shows the association of NBPF14|25832 to 'NEOADJUVANT.THERAPY'. P value = 1.66e-06 with T-test analysis.

-
Expresson data file = HNSC.uncv2.mRNAseq_RSEM_normalized_log2.txt
-
Clinical data file = HNSC.clin.merged.picked.txt
-
Number of patients = 229
-
Number of genes = 18327
-
Number of clinical features = 8
For survival clinical features, Wald's test in univariate Cox regression analysis with proportional hazards model (Andersen and Gill 1982) was used to estimate the P values using the 'coxph' function in R. Kaplan-Meier survival curves were plot using the four quartile subgroups of patients based on expression levels
For continuous numerical clinical features, Spearman's rank correlation coefficients (Spearman 1904) and two-tailed P values were estimated using 'cor.test' function in R
For two-class clinical features, two-tailed Student's t test with unequal variance (Lehmann and Romano 2005) was applied to compare the log2-expression levels between the two clinical classes using 't.test' function in R
For multiple hypothesis correction, Q value is the False Discovery Rate (FDR) analogue of the P value (Benjamini and Hochberg 1995), defined as the minimum FDR at which the test may be called significant. We used the 'Benjamini and Hochberg' method of 'p.adjust' function in R to convert P values into Q values.
This is an experimental feature. The full results of the analysis summarized in this report can be downloaded from the TCGA Data Coordination Center.