This pipeline uses various statistical tests to identify genes whose promoter methylation levels correlated to selected clinical features.
Testing the association between 20233 genes and 8 clinical features across 292 samples, statistically thresholded by Q value < 0.05, 7 clinical features related to at least one genes.
-
1 gene correlated to 'Time to Death'.
-
CYP51A1
-
2 genes correlated to 'AGE'.
-
RIPPLY2 , PBX4
-
4 genes correlated to 'GENDER'.
-
KIF4B , UTP14C , MGC21881 , FRG1B
-
1 gene correlated to 'PATHOLOGY.T'.
-
PRO1768
-
2 genes correlated to 'PATHOLOGY.N'.
-
CD74 , VAMP8
-
1 gene correlated to 'TUMOR.STAGE'.
-
IPO7
-
1 gene correlated to 'RADIATIONS.RADIATION.REGIMENINDICATION'.
-
PTPN1
-
No genes correlated to 'NEOADJUVANT.THERAPY'
Complete statistical result table is provided in Supplement Table 1
Table 1. Get Full Table This table shows the clinical features, statistical methods used, and the number of genes that are significantly associated with each clinical feature at Q value < 0.05.
| Clinical feature | Statistical test | Significant genes | Associated with | Associated with | ||
|---|---|---|---|---|---|---|
| Time to Death | Cox regression test | N=1 | shorter survival | N=1 | longer survival | N=0 |
| AGE | Spearman correlation test | N=2 | older | N=2 | younger | N=0 |
| GENDER | t test | N=4 | male | N=2 | female | N=2 |
| PATHOLOGY T | Spearman correlation test | N=1 | higher pT | N=0 | lower pT | N=1 |
| PATHOLOGY N | Spearman correlation test | N=2 | higher pN | N=2 | lower pN | N=0 |
| TUMOR STAGE | Spearman correlation test | N=1 | higher stage | N=1 | lower stage | N=0 |
| RADIATIONS RADIATION REGIMENINDICATION | t test | N=1 | yes | N=0 | no | N=1 |
| NEOADJUVANT THERAPY | t test | N=0 |
Table S1. Basic characteristics of clinical feature: 'Time to Death'
| Time to Death | Duration (Months) | 0.1-210.9 (median=14.2) |
| censored | N = 169 | |
| death | N = 121 | |
| Significant markers | N = 1 | |
| associated with shorter survival | 1 | |
| associated with longer survival | 0 |
Table S2. Get Full Table List of one gene significantly associated with 'Time to Death' by Cox regression test
| HazardRatio | Wald_P | Q | C_index | |
|---|---|---|---|---|
| CYP51A1 | 7501 | 9.455e-07 | 0.019 | 0.525 |
Figure S1. Get High-res Image As an example, this figure shows the association of CYP51A1 to 'Time to Death'. four curves present the cumulative survival rates of 4 quartile subsets of patients. P value = 9.45e-07 with univariate Cox regression analysis using continuous log-2 expression values.

Table S3. Basic characteristics of clinical feature: 'AGE'
| AGE | Mean (SD) | 61.29 (12) |
| Significant markers | N = 2 | |
| pos. correlated | 2 | |
| neg. correlated | 0 |
Table S4. Get Full Table List of 2 genes significantly correlated to 'AGE' by Spearman correlation test
| SpearmanCorr | corrP | Q | |
|---|---|---|---|
| RIPPLY2 | 0.3198 | 2.281e-08 | 0.000462 |
| PBX4 | 0.2885 | 5.288e-07 | 0.0107 |
Figure S2. Get High-res Image As an example, this figure shows the association of RIPPLY2 to 'AGE'. P value = 2.28e-08 with Spearman correlation analysis. The straight line presents the best linear regression.
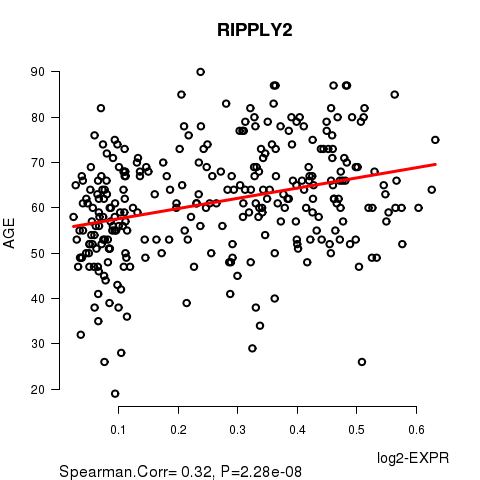
Table S5. Basic characteristics of clinical feature: 'GENDER'
| GENDER | Labels | N |
| FEMALE | 82 | |
| MALE | 210 | |
| Significant markers | N = 4 | |
| Higher in MALE | 2 | |
| Higher in FEMALE | 2 |
Table S6. Get Full Table List of 4 genes differentially expressed by 'GENDER'
| T(pos if higher in 'MALE') | ttestP | Q | AUC | |
|---|---|---|---|---|
| KIF4B | -8.24 | 8.995e-14 | 1.82e-09 | 0.7829 |
| UTP14C | 7.74 | 5.51e-12 | 1.11e-07 | 0.7997 |
| MGC21881 | 5.37 | 2.911e-07 | 0.00589 | 0.6824 |
| FRG1B | -5.3 | 6.541e-07 | 0.0132 | 0.6764 |
Figure S3. Get High-res Image As an example, this figure shows the association of KIF4B to 'GENDER'. P value = 8.99e-14 with T-test analysis.
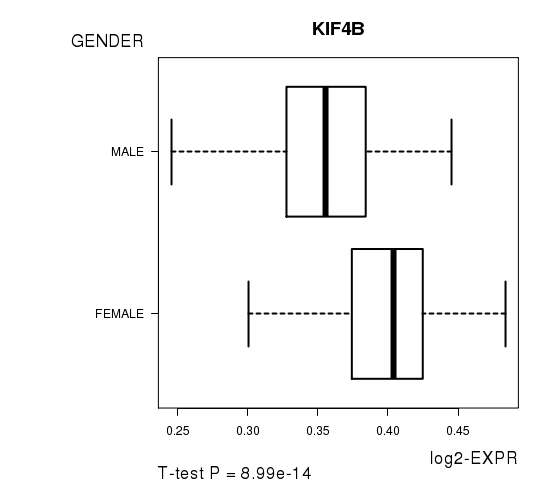
Table S7. Basic characteristics of clinical feature: 'PATHOLOGY.T'
| PATHOLOGY.T | Mean (SD) | 2.93 (1) |
| N | ||
| T1 | 21 | |
| T2 | 76 | |
| T3 | 61 | |
| T4 | 99 | |
| Significant markers | N = 1 | |
| pos. correlated | 0 | |
| neg. correlated | 1 |
Table S8. Get Full Table List of one gene significantly correlated to 'PATHOLOGY.T' by Spearman correlation test
| SpearmanCorr | corrP | Q | |
|---|---|---|---|
| PRO1768 | -0.2907 | 2.128e-06 | 0.0431 |
Figure S4. Get High-res Image As an example, this figure shows the association of PRO1768 to 'PATHOLOGY.T'. P value = 2.13e-06 with Spearman correlation analysis.
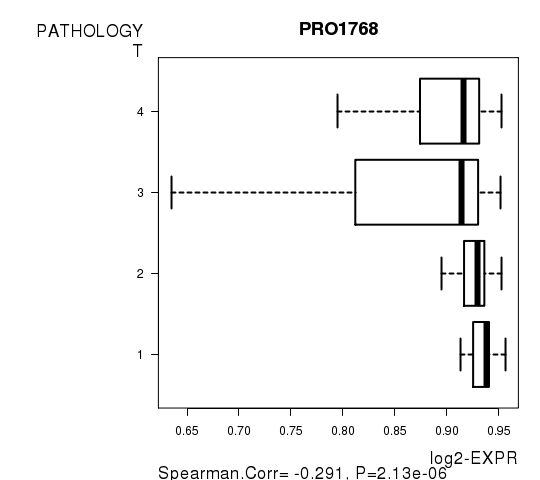
Table S9. Basic characteristics of clinical feature: 'PATHOLOGY.N'
| PATHOLOGY.N | Mean (SD) | 1.04 (0.96) |
| N | ||
| N0 | 96 | |
| N1 | 31 | |
| N2 | 97 | |
| N3 | 4 | |
| Significant markers | N = 2 | |
| pos. correlated | 2 | |
| neg. correlated | 0 |
Table S10. Get Full Table List of 2 genes significantly correlated to 'PATHOLOGY.N' by Spearman correlation test
| SpearmanCorr | corrP | Q | |
|---|---|---|---|
| CD74 | 0.3274 | 4.272e-07 | 0.00864 |
| VAMP8 | 0.3205 | 7.682e-07 | 0.0155 |
Figure S5. Get High-res Image As an example, this figure shows the association of CD74 to 'PATHOLOGY.N'. P value = 4.27e-07 with Spearman correlation analysis.
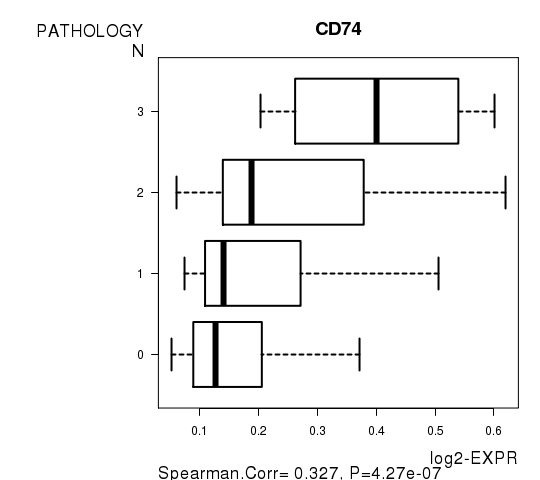
Table S11. Basic characteristics of clinical feature: 'TUMOR.STAGE'
| TUMOR.STAGE | Mean (SD) | 3.3 (0.97) |
| N | ||
| Stage 1 | 15 | |
| Stage 2 | 46 | |
| Stage 3 | 40 | |
| Stage 4 | 151 | |
| Significant markers | N = 1 | |
| pos. correlated | 1 | |
| neg. correlated | 0 |
Table S12. Get Full Table List of one gene significantly correlated to 'TUMOR.STAGE' by Spearman correlation test
| SpearmanCorr | corrP | Q | |
|---|---|---|---|
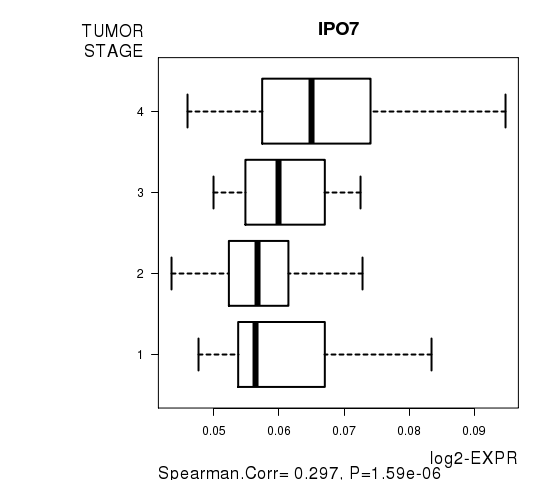
| IPO7 | 0.2969 | 1.594e-06 | 0.0322 |
Figure S6. Get High-res Image As an example, this figure shows the association of IPO7 to 'TUMOR.STAGE'. P value = 1.59e-06 with Spearman correlation analysis.
One gene related to 'RADIATIONS.RADIATION.REGIMENINDICATION'.
Table S13. Basic characteristics of clinical feature: 'RADIATIONS.RADIATION.REGIMENINDICATION'
| RADIATIONS.RADIATION.REGIMENINDICATION | Labels | N |
| NO | 78 | |
| YES | 214 | |
| Significant markers | N = 1 | |
| Higher in YES | 0 | |
| Higher in NO | 1 |
Table S14. Get Full Table List of one gene differentially expressed by 'RADIATIONS.RADIATION.REGIMENINDICATION'
| T(pos if higher in 'YES') | ttestP | Q | AUC | |
|---|---|---|---|---|
| PTPN1 | -5.02 | 1.596e-06 | 0.0323 | 0.6936 |
Figure S7. Get High-res Image As an example, this figure shows the association of PTPN1 to 'RADIATIONS.RADIATION.REGIMENINDICATION'. P value = 1.6e-06 with T-test analysis.

-
Expresson data file = HNSC.meth.for_correlation.filtered_data.txt
-
Clinical data file = HNSC.clin.merged.picked.txt
-
Number of patients = 292
-
Number of genes = 20233
-
Number of clinical features = 8
For survival clinical features, Wald's test in univariate Cox regression analysis with proportional hazards model (Andersen and Gill 1982) was used to estimate the P values using the 'coxph' function in R. Kaplan-Meier survival curves were plot using the four quartile subgroups of patients based on expression levels
For continuous numerical clinical features, Spearman's rank correlation coefficients (Spearman 1904) and two-tailed P values were estimated using 'cor.test' function in R
For two-class clinical features, two-tailed Student's t test with unequal variance (Lehmann and Romano 2005) was applied to compare the log2-expression levels between the two clinical classes using 't.test' function in R
For multiple hypothesis correction, Q value is the False Discovery Rate (FDR) analogue of the P value (Benjamini and Hochberg 1995), defined as the minimum FDR at which the test may be called significant. We used the 'Benjamini and Hochberg' method of 'p.adjust' function in R to convert P values into Q values.
This is an experimental feature. The full results of the analysis summarized in this report can be downloaded from the TCGA Data Coordination Center.