This pipeline uses various statistical tests to identify genes whose promoter methylation levels correlated to selected clinical features.
Testing the association between 20234 genes and 9 clinical features across 283 samples, statistically thresholded by Q value < 0.05, 8 clinical features related to at least one genes.
-
364 genes correlated to 'Time to Death'.
-
CSNK2A1 , DMRT1 , PRDM6 , PAX6 , IL31RA , ...
-
58 genes correlated to 'AGE'.
-
ZFP64 , GSX1 , DRD5 , FOXG1 , SPDYA , ...
-
51 genes correlated to 'GENDER'.
-
C10ORF99 , LRRC41 , UQCRH , SNORA48 , KIF4B , ...
-
1157 genes correlated to 'PATHOLOGY.T'.
-
GSC2 , ZIC1 , FERD3L , BARHL2 , SOX1 , ...
-
4 genes correlated to 'PATHOLOGY.N'.
-
LOC339535 , RECQL4 , RGS19 , GOSR1
-
167 genes correlated to 'PATHOLOGICSPREAD(M)'.
-
C2ORF40 , ITGB6 , OPRK1 , SLC25A2 , TBX20 , ...
-
1234 genes correlated to 'TUMOR.STAGE'.
-
GSC2 , TLX2 , ZIC1 , POU4F2 , NKX6-2 , ...
-
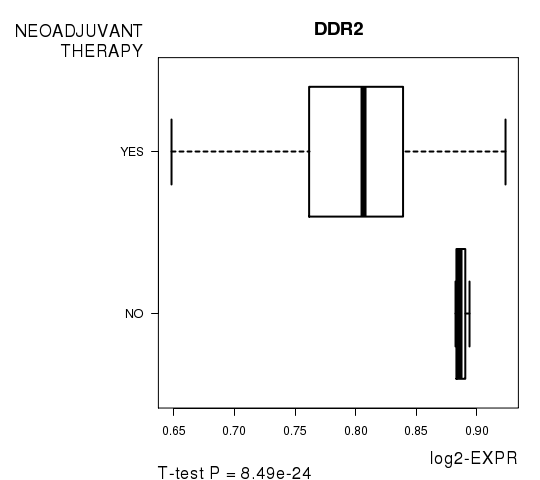
60 genes correlated to 'NEOADJUVANT.THERAPY'.
-
DDR2 , GINS4 , EFHA2 , UQCRH , LCN12 , ...
-
No genes correlated to 'KARNOFSKY.PERFORMANCE.SCORE'
Complete statistical result table is provided in Supplement Table 1
Table 1. Get Full Table This table shows the clinical features, statistical methods used, and the number of genes that are significantly associated with each clinical feature at Q value < 0.05.
| Clinical feature | Statistical test | Significant genes | Associated with | Associated with | ||
|---|---|---|---|---|---|---|
| Time to Death | Cox regression test | N=364 | shorter survival | N=268 | longer survival | N=96 |
| AGE | Spearman correlation test | N=58 | older | N=58 | younger | N=0 |
| GENDER | t test | N=51 | male | N=18 | female | N=33 |
| KARNOFSKY PERFORMANCE SCORE | Spearman correlation test | N=0 | ||||
| PATHOLOGY T | Spearman correlation test | N=1157 | higher pT | N=808 | lower pT | N=349 |
| PATHOLOGY N | t test | N=4 | n1 | N=2 | n0 | N=2 |
| PATHOLOGICSPREAD(M) | t test | N=167 | m1 | N=165 | m0 | N=2 |
| TUMOR STAGE | Spearman correlation test | N=1234 | higher stage | N=1016 | lower stage | N=218 |
| NEOADJUVANT THERAPY | t test | N=60 | yes | N=23 | no | N=37 |
Table S1. Basic characteristics of clinical feature: 'Time to Death'
| Time to Death | Duration (Months) | 0.1-109.9 (median=28.6) |
| censored | N = 186 | |
| death | N = 94 | |
| Significant markers | N = 364 | |
| associated with shorter survival | 268 | |
| associated with longer survival | 96 |
Table S2. Get Full Table List of top 10 genes significantly associated with 'Time to Death' by Cox regression test
| HazardRatio | Wald_P | Q | C_index | |
|---|---|---|---|---|
| CSNK2A1 | 300000001 | 2.697e-13 | 5.5e-09 | 0.714 |
| DMRT1 | 3101 | 6.44e-11 | 1.3e-06 | 0.669 |
| PRDM6 | 571 | 1.178e-10 | 2.4e-06 | 0.678 |
| PAX6 | 111 | 1.656e-10 | 3.3e-06 | 0.677 |
| IL31RA | 0.01 | 2.209e-10 | 4.5e-06 | 0.316 |
| CD300LB | 0.01 | 3.696e-10 | 7.5e-06 | 0.335 |
| BHLHE23 | 35 | 4.032e-10 | 8.2e-06 | 0.675 |
| PTPN22 | 0.01 | 4.04e-10 | 8.2e-06 | 0.344 |
| KCNJ3 | 5600001 | 4.143e-10 | 8.4e-06 | 0.615 |
| IRF4 | 101 | 4.225e-10 | 8.5e-06 | 0.651 |
Figure S1. Get High-res Image As an example, this figure shows the association of CSNK2A1 to 'Time to Death'. four curves present the cumulative survival rates of 4 quartile subsets of patients. P value = 2.7e-13 with univariate Cox regression analysis using continuous log-2 expression values.
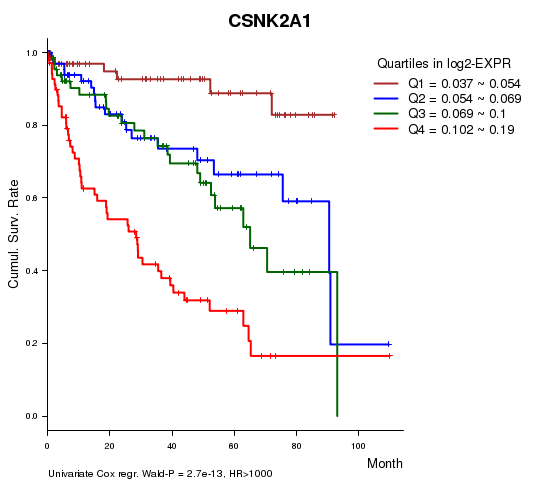
Table S3. Basic characteristics of clinical feature: 'AGE'
| AGE | Mean (SD) | 61.49 (12) |
| Significant markers | N = 58 | |
| pos. correlated | 58 | |
| neg. correlated | 0 |
Table S4. Get Full Table List of top 10 genes significantly correlated to 'AGE' by Spearman correlation test
| SpearmanCorr | corrP | Q | |
|---|---|---|---|
| ZFP64 | 0.3601 | 4.352e-10 | 8.81e-06 |
| GSX1 | 0.3547 | 8.164e-10 | 1.65e-05 |
| DRD5 | 0.3362 | 6.649e-09 | 0.000135 |
| FOXG1 | 0.3359 | 6.838e-09 | 0.000138 |
| SPDYA | 0.3339 | 8.508e-09 | 0.000172 |
| LHFPL4 | 0.3311 | 1.15e-08 | 0.000233 |
| KCNS2 | 0.3308 | 1.182e-08 | 0.000239 |
| CALB1 | 0.3184 | 4.342e-08 | 0.000878 |
| SP8 | 0.3175 | 4.782e-08 | 0.000967 |
| DHX40 | 0.3167 | 5.177e-08 | 0.00105 |
Figure S2. Get High-res Image As an example, this figure shows the association of ZFP64 to 'AGE'. P value = 4.35e-10 with Spearman correlation analysis. The straight line presents the best linear regression.
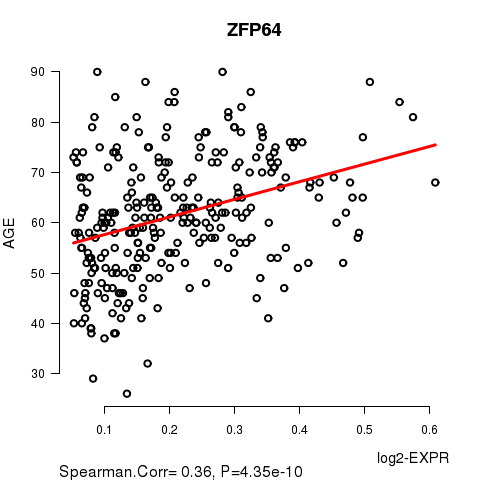
Table S5. Basic characteristics of clinical feature: 'GENDER'
| GENDER | Labels | N |
| FEMALE | 96 | |
| MALE | 187 | |
| Significant markers | N = 51 | |
| Higher in MALE | 18 | |
| Higher in FEMALE | 33 |
Table S6. Get Full Table List of top 10 genes differentially expressed by 'GENDER'
| T(pos if higher in 'MALE') | ttestP | Q | AUC | |
|---|---|---|---|---|
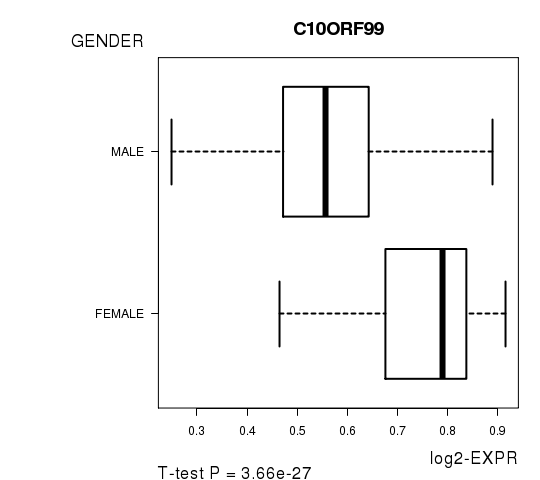
| C10ORF99 | -12.44 | 3.657e-27 | 7.4e-23 | 0.8503 |
| LRRC41 | 10.07 | 5.453e-20 | 1.1e-15 | 0.7435 |
| UQCRH | 9.66 | 1.047e-18 | 2.12e-14 | 0.7445 |
| SNORA48 | -9.57 | 7.952e-18 | 1.61e-13 | 0.815 |
| KIF4B | -9.12 | 6.467e-17 | 1.31e-12 | 0.8063 |
| GLUD1 | -8.93 | 1.578e-15 | 3.19e-11 | 0.8035 |
| FAM35A | -8.79 | 3.195e-15 | 6.46e-11 | 0.7909 |
| C5ORF27 | -7.92 | 4.032e-13 | 8.15e-09 | 0.7672 |
| TUBB4 | 7.46 | 1.955e-12 | 3.96e-08 | 0.7809 |
| NARFL | -7.22 | 5.141e-12 | 1.04e-07 | 0.7175 |
Figure S3. Get High-res Image As an example, this figure shows the association of C10ORF99 to 'GENDER'. P value = 3.66e-27 with T-test analysis.
No gene related to 'KARNOFSKY.PERFORMANCE.SCORE'.
Table S7. Basic characteristics of clinical feature: 'KARNOFSKY.PERFORMANCE.SCORE'
| KARNOFSKY.PERFORMANCE.SCORE | Mean (SD) | 92.5 (8) |
| Score | N | |
| 70 | 1 | |
| 80 | 3 | |
| 90 | 12 | |
| 100 | 12 | |
| Significant markers | N = 0 |
Table S8. Basic characteristics of clinical feature: 'PATHOLOGY.T'
| PATHOLOGY.T | Mean (SD) | 1.97 (0.98) |
| N | ||
| T1 | 132 | |
| T2 | 36 | |
| T3 | 107 | |
| T4 | 8 | |
| Significant markers | N = 1157 | |
| pos. correlated | 808 | |
| neg. correlated | 349 |
Table S9. Get Full Table List of top 10 genes significantly correlated to 'PATHOLOGY.T' by Spearman correlation test
| SpearmanCorr | corrP | Q | |
|---|---|---|---|
| GSC2 | 0.5286 | 8.992e-22 | 1.82e-17 |
| ZIC1 | 0.5277 | 1.085e-21 | 2.19e-17 |
| FERD3L | 0.5253 | 1.792e-21 | 3.63e-17 |
| BARHL2 | 0.5166 | 1.037e-20 | 2.1e-16 |
| SOX1 | 0.5163 | 1.102e-20 | 2.23e-16 |
| ZIC4 | 0.5156 | 1.281e-20 | 2.59e-16 |
| DMRTA2 | 0.5146 | 1.535e-20 | 3.11e-16 |
| NKX6-2 | 0.5141 | 1.718e-20 | 3.48e-16 |
| KCNQ1DN | 0.5077 | 6.052e-20 | 1.22e-15 |
| TLX3 | 0.5023 | 1.714e-19 | 3.47e-15 |
Figure S4. Get High-res Image As an example, this figure shows the association of GSC2 to 'PATHOLOGY.T'. P value = 8.99e-22 with Spearman correlation analysis.
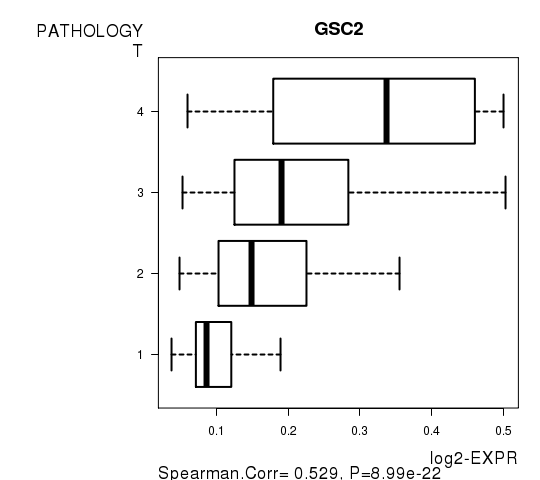
Table S10. Basic characteristics of clinical feature: 'PATHOLOGY.N'
| PATHOLOGY.N | Labels | N |
| N0 | 127 | |
| N1 | 9 | |
| Significant markers | N = 4 | |
| Higher in N1 | 2 | |
| Higher in N0 | 2 |
Table S11. Get Full Table List of 4 genes differentially expressed by 'PATHOLOGY.N'
| T(pos if higher in 'N1') | ttestP | Q | AUC | |
|---|---|---|---|---|
| LOC339535 | 7.52 | 7.544e-08 | 0.00153 | 0.8285 |
| RECQL4 | 5.9 | 2.878e-07 | 0.00582 | 0.6667 |
| RGS19 | -5.53 | 7.076e-07 | 0.0143 | 0.79 |
| GOSR1 | -4.98 | 2.457e-06 | 0.0497 | 0.6597 |
Figure S5. Get High-res Image As an example, this figure shows the association of LOC339535 to 'PATHOLOGY.N'. P value = 7.54e-08 with T-test analysis.
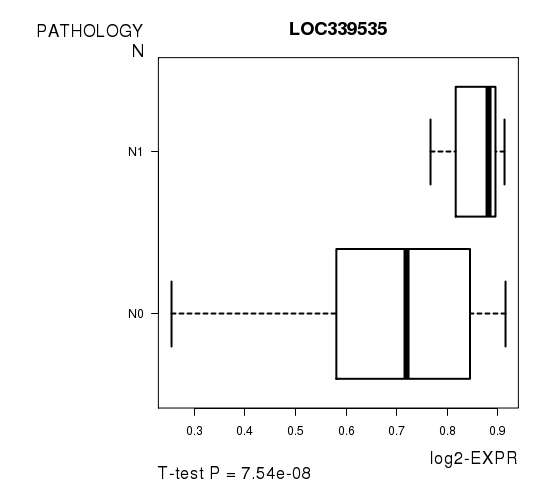
Table S12. Basic characteristics of clinical feature: 'PATHOLOGICSPREAD(M)'
| PATHOLOGICSPREAD(M) | Labels | N |
| M0 | 232 | |
| M1 | 51 | |
| Significant markers | N = 167 | |
| Higher in M1 | 165 | |
| Higher in M0 | 2 |
Table S13. Get Full Table List of top 10 genes differentially expressed by 'PATHOLOGICSPREAD(M)'
| T(pos if higher in 'M1') | ttestP | Q | AUC | |
|---|---|---|---|---|
| C2ORF40 | 7.3 | 1.626e-10 | 3.29e-06 | 0.7699 |
| ITGB6 | 6.66 | 2.5e-10 | 5.06e-06 | 0.6754 |
| OPRK1 | 6.67 | 1.98e-09 | 4.01e-05 | 0.7509 |
| SLC25A2 | 6.35 | 2.086e-09 | 4.22e-05 | 0.6967 |
| TBX20 | 6.8 | 2.183e-09 | 4.42e-05 | 0.7716 |
| ZSCAN18 | 6.38 | 7.296e-09 | 0.000148 | 0.7394 |
| TMEM155 | 6.61 | 7.448e-09 | 0.000151 | 0.7868 |
| SPAG6 | 6.43 | 7.519e-09 | 0.000152 | 0.7393 |
| COMP | 6.39 | 1.269e-08 | 0.000257 | 0.7577 |
| CRMP1 | 6.39 | 1.349e-08 | 0.000273 | 0.7657 |
Figure S6. Get High-res Image As an example, this figure shows the association of C2ORF40 to 'PATHOLOGICSPREAD(M)'. P value = 1.63e-10 with T-test analysis.
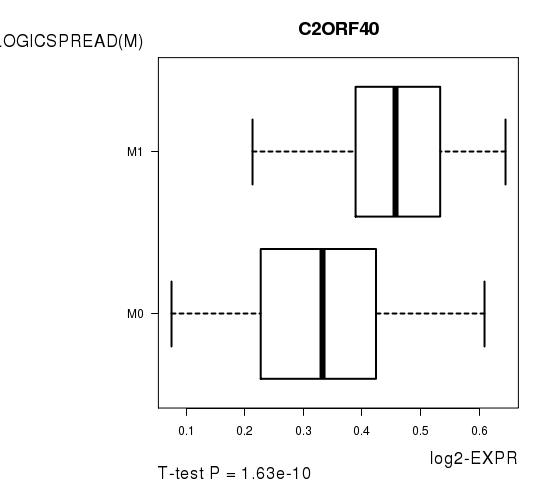
Table S14. Basic characteristics of clinical feature: 'TUMOR.STAGE'
| TUMOR.STAGE | Mean (SD) | 2.19 (1.2) |
| N | ||
| Stage 1 | 130 | |
| Stage 2 | 24 | |
| Stage 3 | 73 | |
| Stage 4 | 56 | |
| Significant markers | N = 1234 | |
| pos. correlated | 1016 | |
| neg. correlated | 218 |
Table S15. Get Full Table List of top 10 genes significantly correlated to 'TUMOR.STAGE' by Spearman correlation test
| SpearmanCorr | corrP | Q | |
|---|---|---|---|
| GSC2 | 0.5533 | 4.239e-24 | 8.58e-20 |
| TLX2 | 0.5397 | 8.631e-23 | 1.75e-18 |
| ZIC1 | 0.5352 | 2.261e-22 | 4.57e-18 |
| POU4F2 | 0.5332 | 3.404e-22 | 6.89e-18 |
| NKX6-2 | 0.5329 | 3.679e-22 | 7.44e-18 |
| TLX3 | 0.5283 | 9.685e-22 | 1.96e-17 |
| ZIC4 | 0.5271 | 1.229e-21 | 2.49e-17 |
| FERD3L | 0.5257 | 1.637e-21 | 3.31e-17 |
| HTR1A | 0.5257 | 1.647e-21 | 3.33e-17 |
| SOX1 | 0.5251 | 1.857e-21 | 3.76e-17 |
Figure S7. Get High-res Image As an example, this figure shows the association of GSC2 to 'TUMOR.STAGE'. P value = 4.24e-24 with Spearman correlation analysis.
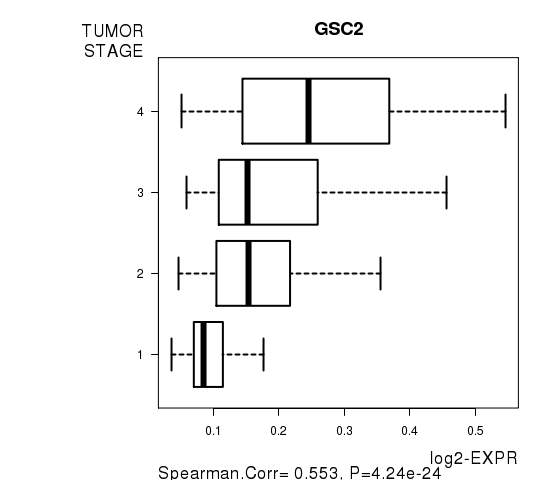
Table S16. Basic characteristics of clinical feature: 'NEOADJUVANT.THERAPY'
| NEOADJUVANT.THERAPY | Labels | N |
| NO | 4 | |
| YES | 279 | |
| Significant markers | N = 60 | |
| Higher in YES | 23 | |
| Higher in NO | 37 |
Table S17. Get Full Table List of top 10 genes differentially expressed by 'NEOADJUVANT.THERAPY'
| T(pos if higher in 'YES') | ttestP | Q | AUC | |
|---|---|---|---|---|
| DDR2 | -17.19 | 8.492e-24 | 1.72e-19 | 0.9409 |
| GINS4 | 16.44 | 9.478e-22 | 1.92e-17 | 0.8683 |
| EFHA2 | 10.15 | 2.654e-17 | 5.37e-13 | 0.6398 |
| UQCRH | 9.03 | 3.552e-16 | 7.19e-12 | 0.5296 |
| LCN12 | -10.36 | 2.107e-14 | 4.26e-10 | 0.8656 |
| DUSP23 | -8.08 | 2.632e-14 | 5.32e-10 | 0.7545 |
| OR10R2 | -9.44 | 6.043e-14 | 1.22e-09 | 0.6389 |
| OR5H15 | -11.92 | 9.727e-14 | 1.97e-09 | 0.7751 |
| MIR543 | -8.28 | 5.828e-13 | 1.18e-08 | 0.7814 |
| LOC154822 | -9.27 | 1.99e-12 | 4.02e-08 | 0.8244 |
Figure S8. Get High-res Image As an example, this figure shows the association of DDR2 to 'NEOADJUVANT.THERAPY'. P value = 8.49e-24 with T-test analysis.
-
Expresson data file = KIRC.meth.for_correlation.filtered_data.txt
-
Clinical data file = KIRC.clin.merged.picked.txt
-
Number of patients = 283
-
Number of genes = 20234
-
Number of clinical features = 9
For survival clinical features, Wald's test in univariate Cox regression analysis with proportional hazards model (Andersen and Gill 1982) was used to estimate the P values using the 'coxph' function in R. Kaplan-Meier survival curves were plot using the four quartile subgroups of patients based on expression levels
For continuous numerical clinical features, Spearman's rank correlation coefficients (Spearman 1904) and two-tailed P values were estimated using 'cor.test' function in R
For two-class clinical features, two-tailed Student's t test with unequal variance (Lehmann and Romano 2005) was applied to compare the log2-expression levels between the two clinical classes using 't.test' function in R
For multiple hypothesis correction, Q value is the False Discovery Rate (FDR) analogue of the P value (Benjamini and Hochberg 1995), defined as the minimum FDR at which the test may be called significant. We used the 'Benjamini and Hochberg' method of 'p.adjust' function in R to convert P values into Q values.
This is an experimental feature. The full results of the analysis summarized in this report can be downloaded from the TCGA Data Coordination Center.