This pipeline uses various statistical tests to identify miRs whose expression levels correlated to selected clinical features.
Testing the association between 467 genes and 9 clinical features across 463 samples, statistically thresholded by Q value < 0.05, 6 clinical features related to at least one genes.
-
64 genes correlated to 'Time to Death'.
-
HSA-MIR-130B , HSA-MIR-223 , HSA-MIR-21 , HSA-MIR-34C , HSA-MIR-365-2 , ...
-
8 genes correlated to 'GENDER'.
-
HSA-MIR-100 , HSA-MIR-708 , HSA-MIR-599 , HSA-MIR-455 , HSA-MIR-31 , ...
-
35 genes correlated to 'PATHOLOGY.T'.
-
HSA-MIR-139 , HSA-MIR-21 , HSA-MIR-625 , HSA-MIR-130B , HSA-MIR-155 , ...
-
18 genes correlated to 'PATHOLOGICSPREAD(M)'.
-
HSA-MIR-193A , HSA-MIR-155 , HSA-MIR-130B , HSA-MIR-28 , HSA-MIR-625 , ...
-
38 genes correlated to 'TUMOR.STAGE'.
-
HSA-MIR-139 , HSA-MIR-155 , HSA-MIR-21 , HSA-MIR-144 , HSA-MIR-625 , ...
-
4 genes correlated to 'NEOADJUVANT.THERAPY'.
-
HSA-MIR-2116 , HSA-MIR-3190 , HSA-MIR-133A-2 , HSA-MIR-627
-
No genes correlated to 'AGE', 'KARNOFSKY.PERFORMANCE.SCORE', and 'PATHOLOGY.N'.
Complete statistical result table is provided in Supplement Table 1
Table 1. Get Full Table This table shows the clinical features, statistical methods used, and the number of genes that are significantly associated with each clinical feature at Q value < 0.05.
| Clinical feature | Statistical test | Significant genes | Associated with | Associated with | ||
|---|---|---|---|---|---|---|
| Time to Death | Cox regression test | N=64 | shorter survival | N=58 | longer survival | N=6 |
| AGE | Spearman correlation test | N=0 | ||||
| GENDER | t test | N=8 | male | N=4 | female | N=4 |
| KARNOFSKY PERFORMANCE SCORE | Spearman correlation test | N=0 | ||||
| PATHOLOGY T | Spearman correlation test | N=35 | higher pT | N=26 | lower pT | N=9 |
| PATHOLOGY N | t test | N=0 | ||||
| PATHOLOGICSPREAD(M) | t test | N=18 | m1 | N=14 | m0 | N=4 |
| TUMOR STAGE | Spearman correlation test | N=38 | higher stage | N=27 | lower stage | N=11 |
| NEOADJUVANT THERAPY | t test | N=4 | yes | N=3 | no | N=1 |
Table S1. Basic characteristics of clinical feature: 'Time to Death'
| Time to Death | Duration (Months) | 0.1-111 (median=33.7) |
| censored | N = 312 | |
| death | N = 148 | |
| Significant markers | N = 64 | |
| associated with shorter survival | 58 | |
| associated with longer survival | 6 |
Table S2. Get Full Table List of top 10 genes significantly associated with 'Time to Death' by Cox regression test
| HazardRatio | Wald_P | Q | C_index | |
|---|---|---|---|---|
| HSA-MIR-130B | 2.2 | 7.438e-15 | 3.5e-12 | 0.666 |
| HSA-MIR-223 | 1.64 | 4.44e-13 | 2.1e-10 | 0.653 |
| HSA-MIR-21 | 2.1 | 1.529e-09 | 7.1e-07 | 0.659 |
| HSA-MIR-34C | 1.27 | 1.575e-09 | 7.3e-07 | 0.638 |
| HSA-MIR-365-2 | 1.7 | 1.357e-08 | 6.3e-06 | 0.637 |
| HSA-MIR-18A | 1.58 | 4.319e-08 | 2e-05 | 0.619 |
| HSA-MIR-10B | 0.56 | 6.785e-08 | 3.1e-05 | 0.368 |
| HSA-MIR-1248 | 1.4 | 7.101e-08 | 3.3e-05 | 0.618 |
| HSA-MIR-365-1 | 1.64 | 8.411e-08 | 3.9e-05 | 0.63 |
| HSA-MIR-101-1 | 0.55 | 1.144e-07 | 5.2e-05 | 0.394 |
Figure S1. Get High-res Image As an example, this figure shows the association of HSA-MIR-130B to 'Time to Death'. four curves present the cumulative survival rates of 4 quartile subsets of patients. P value = 7.44e-15 with univariate Cox regression analysis using continuous log-2 expression values.
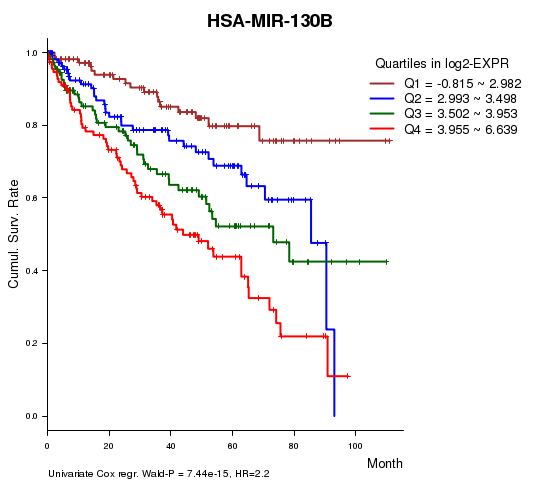
Table S3. Basic characteristics of clinical feature: 'AGE'
| AGE | Mean (SD) | 60.74 (12) |
| Significant markers | N = 0 |
Table S4. Basic characteristics of clinical feature: 'GENDER'
| GENDER | Labels | N |
| FEMALE | 159 | |
| MALE | 304 | |
| Significant markers | N = 8 | |
| Higher in MALE | 4 | |
| Higher in FEMALE | 4 |
Table S5. Get Full Table List of 8 genes differentially expressed by 'GENDER'
| T(pos if higher in 'MALE') | ttestP | Q | AUC | |
|---|---|---|---|---|
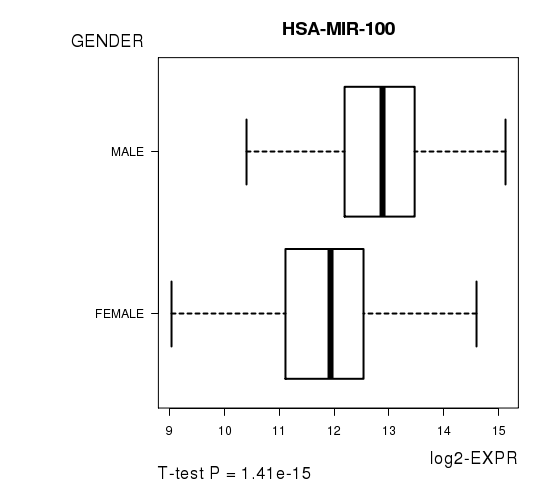
| HSA-MIR-100 | 8.44 | 1.414e-15 | 6.6e-13 | 0.7428 |
| HSA-MIR-708 | 5.17 | 4.198e-07 | 0.000196 | 0.6548 |
| HSA-MIR-599 | -5.04 | 8.81e-07 | 0.00041 | 0.6715 |
| HSA-MIR-455 | -4.82 | 2.1e-06 | 0.000975 | 0.6465 |
| HSA-MIR-31 | 4.07 | 6.19e-05 | 0.0287 | 0.6213 |
| HSA-MIR-30A | -3.99 | 7.963e-05 | 0.0368 | 0.605 |
| HSA-MIR-500B | -3.97 | 8.751e-05 | 0.0403 | 0.612 |
| HSA-MIR-320E | 3.93 | 0.0001083 | 0.0498 | 0.6208 |
Figure S2. Get High-res Image As an example, this figure shows the association of HSA-MIR-100 to 'GENDER'. P value = 1.41e-15 with T-test analysis.
No gene related to 'KARNOFSKY.PERFORMANCE.SCORE'.
Table S6. Basic characteristics of clinical feature: 'KARNOFSKY.PERFORMANCE.SCORE'
| KARNOFSKY.PERFORMANCE.SCORE | Mean (SD) | 88 (23) |
| Score | N | |
| 0 | 2 | |
| 70 | 1 | |
| 80 | 3 | |
| 90 | 13 | |
| 100 | 16 | |
| Significant markers | N = 0 |
Table S7. Basic characteristics of clinical feature: 'PATHOLOGY.T'
| PATHOLOGY.T | Mean (SD) | 1.92 (0.97) |
| N | ||
| T1 | 225 | |
| T2 | 59 | |
| T3 | 169 | |
| T4 | 10 | |
| Significant markers | N = 35 | |
| pos. correlated | 26 | |
| neg. correlated | 9 |
Table S8. Get Full Table List of top 10 genes significantly correlated to 'PATHOLOGY.T' by Spearman correlation test
| SpearmanCorr | corrP | Q | |
|---|---|---|---|
| HSA-MIR-139 | -0.3294 | 3.547e-13 | 1.66e-10 |
| HSA-MIR-21 | 0.275 | 1.764e-09 | 8.22e-07 |
| HSA-MIR-625 | 0.2736 | 2.153e-09 | 1e-06 |
| HSA-MIR-130B | 0.2653 | 6.709e-09 | 3.11e-06 |
| HSA-MIR-155 | 0.2574 | 1.926e-08 | 8.92e-06 |
| HSA-MIR-486 | -0.2491 | 5.558e-08 | 2.57e-05 |
| HSA-MIR-144 | -0.2457 | 8.535e-08 | 3.93e-05 |
| HSA-MIR-9-2 | 0.2281 | 7.05e-07 | 0.000324 |
| HSA-MIR-9-1 | 0.2243 | 1.088e-06 | 5e-04 |
| HSA-MIR-451 | -0.2227 | 1.295e-06 | 0.000593 |
Figure S3. Get High-res Image As an example, this figure shows the association of HSA-MIR-139 to 'PATHOLOGY.T'. P value = 3.55e-13 with Spearman correlation analysis.
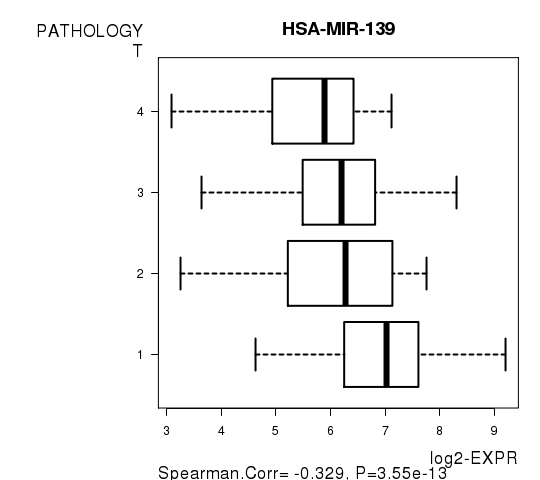
Table S9. Basic characteristics of clinical feature: 'PATHOLOGY.N'
| PATHOLOGY.N | Labels | N |
| N0 | 214 | |
| N1 | 16 | |
| Significant markers | N = 0 |
Table S10. Basic characteristics of clinical feature: 'PATHOLOGICSPREAD(M)'
| PATHOLOGICSPREAD(M) | Labels | N |
| M0 | 391 | |
| M1 | 72 | |
| Significant markers | N = 18 | |
| Higher in M1 | 14 | |
| Higher in M0 | 4 |
Table S11. Get Full Table List of top 10 genes differentially expressed by 'PATHOLOGICSPREAD(M)'
| T(pos if higher in 'M1') | ttestP | Q | AUC | |
|---|---|---|---|---|
| HSA-MIR-193A | 5.72 | 4.428e-08 | 2.07e-05 | 0.6466 |
| HSA-MIR-155 | 5.04 | 1.979e-06 | 0.000922 | 0.6825 |
| HSA-MIR-130B | 5.02 | 1.997e-06 | 0.000929 | 0.67 |
| HSA-MIR-28 | 4.97 | 2.549e-06 | 0.00118 | 0.6563 |
| HSA-MIR-625 | 4.96 | 2.845e-06 | 0.00132 | 0.673 |
| HSA-MIR-144 | -4.97 | 2.887e-06 | 0.00133 | 0.6833 |
| HSA-MIR-27A | 4.79 | 4.513e-06 | 0.00208 | 0.6314 |
| HSA-MIR-106B | 4.54 | 1.19e-05 | 0.00547 | 0.6431 |
| HSA-MIR-130A | 4.53 | 1.444e-05 | 0.00663 | 0.6412 |
| HSA-MIR-454 | 4.47 | 1.83e-05 | 0.00838 | 0.6437 |
Figure S4. Get High-res Image As an example, this figure shows the association of HSA-MIR-193A to 'PATHOLOGICSPREAD(M)'. P value = 4.43e-08 with T-test analysis.
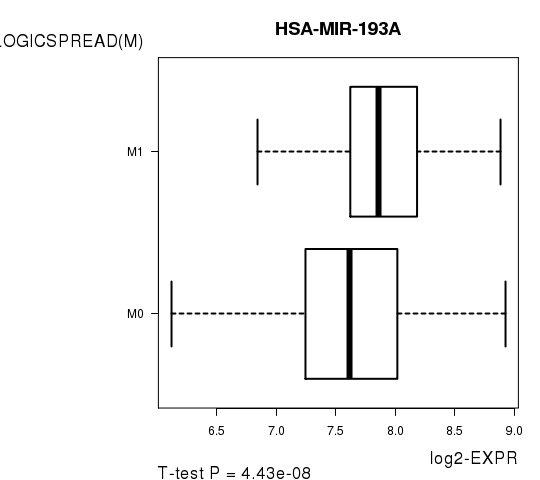
Table S12. Basic characteristics of clinical feature: 'TUMOR.STAGE'
| TUMOR.STAGE | Mean (SD) | 2.11 (1.2) |
| N | ||
| Stage 1 | 221 | |
| Stage 2 | 47 | |
| Stage 3 | 119 | |
| Stage 4 | 76 | |
| Significant markers | N = 38 | |
| pos. correlated | 27 | |
| neg. correlated | 11 |
Table S13. Get Full Table List of top 10 genes significantly correlated to 'TUMOR.STAGE' by Spearman correlation test
| SpearmanCorr | corrP | Q | |
|---|---|---|---|
| HSA-MIR-139 | -0.3433 | 2.998e-14 | 1.4e-11 |
| HSA-MIR-155 | 0.2819 | 6.611e-10 | 3.08e-07 |
| HSA-MIR-21 | 0.278 | 1.153e-09 | 5.36e-07 |
| HSA-MIR-144 | -0.2726 | 2.465e-09 | 1.14e-06 |
| HSA-MIR-625 | 0.2667 | 5.548e-09 | 2.57e-06 |
| HSA-MIR-486 | -0.2633 | 8.841e-09 | 4.08e-06 |
| HSA-MIR-130B | 0.2494 | 5.364e-08 | 2.47e-05 |
| HSA-MIR-451 | -0.2489 | 5.757e-08 | 2.65e-05 |
| HSA-MIR-142 | 0.2423 | 1.31e-07 | 6.01e-05 |
| HSA-MIR-10B | -0.2365 | 2.624e-07 | 0.00012 |
Figure S5. Get High-res Image As an example, this figure shows the association of HSA-MIR-139 to 'TUMOR.STAGE'. P value = 3e-14 with Spearman correlation analysis.
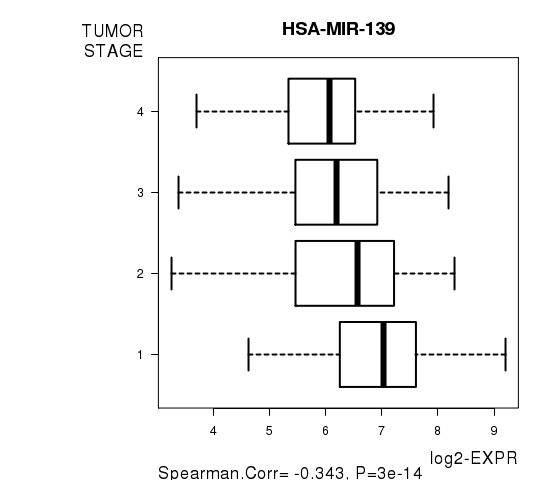
Table S14. Basic characteristics of clinical feature: 'NEOADJUVANT.THERAPY'
| NEOADJUVANT.THERAPY | Labels | N |
| NO | 5 | |
| YES | 458 | |
| Significant markers | N = 4 | |
| Higher in YES | 3 | |
| Higher in NO | 1 |
Table S15. Get Full Table List of 4 genes differentially expressed by 'NEOADJUVANT.THERAPY'
| T(pos if higher in 'YES') | ttestP | Q | AUC | |
|---|---|---|---|---|
| HSA-MIR-2116 | 9.51 | 1.313e-09 | 5.19e-07 | 0.6887 |
| HSA-MIR-3190 | -15.94 | 2.027e-08 | 7.99e-06 | 0.8822 |
| HSA-MIR-133A-2 | 5.9 | 1.068e-05 | 0.0042 | 0.6483 |
| HSA-MIR-627 | 12.3 | 3.566e-05 | 0.014 | 0.8612 |
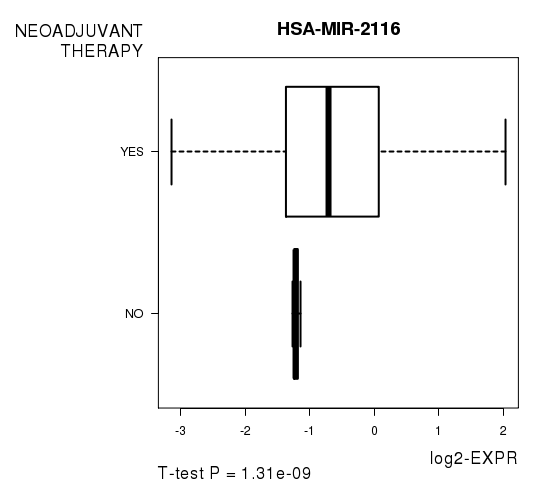
Figure S6. Get High-res Image As an example, this figure shows the association of HSA-MIR-2116 to 'NEOADJUVANT.THERAPY'. P value = 1.31e-09 with T-test analysis.
-
Expresson data file = KIRC.miRseq_RPKM_log2.txt
-
Clinical data file = KIRC.clin.merged.picked.txt
-
Number of patients = 463
-
Number of genes = 467
-
Number of clinical features = 9
For survival clinical features, Wald's test in univariate Cox regression analysis with proportional hazards model (Andersen and Gill 1982) was used to estimate the P values using the 'coxph' function in R. Kaplan-Meier survival curves were plot using the four quartile subgroups of patients based on expression levels
For continuous numerical clinical features, Spearman's rank correlation coefficients (Spearman 1904) and two-tailed P values were estimated using 'cor.test' function in R
For two-class clinical features, two-tailed Student's t test with unequal variance (Lehmann and Romano 2005) was applied to compare the log2-expression levels between the two clinical classes using 't.test' function in R
For multiple hypothesis correction, Q value is the False Discovery Rate (FDR) analogue of the P value (Benjamini and Hochberg 1995), defined as the minimum FDR at which the test may be called significant. We used the 'Benjamini and Hochberg' method of 'p.adjust' function in R to convert P values into Q values.
This is an experimental feature. The full results of the analysis summarized in this report can be downloaded from the TCGA Data Coordination Center.