This pipeline computes the correlation between significant arm-level copy number variations (cnvs) and selected clinical features.
Testing the association between copy number variation 53 arm-level results and 8 clinical features across 95 patients, 7 significant findings detected with Q value < 0.25.
-
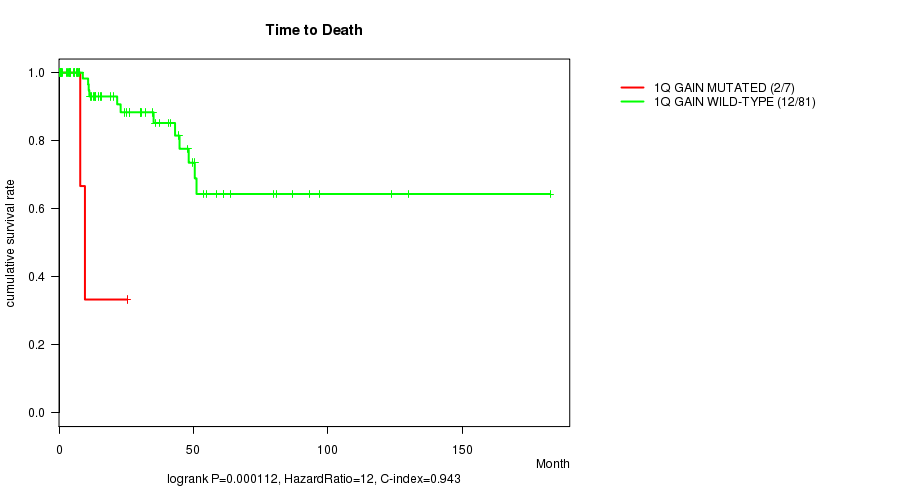
1q gain cnv correlated to 'Time to Death'.
-
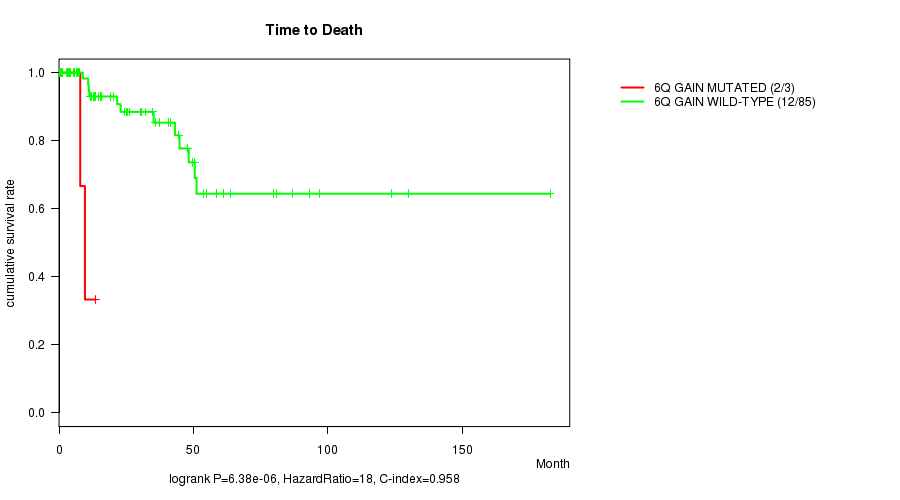
6q gain cnv correlated to 'Time to Death'.
-
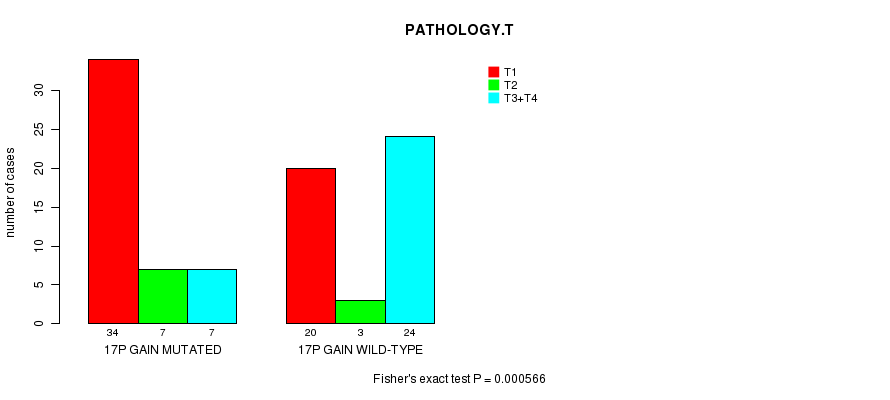
17p gain cnv correlated to 'PATHOLOGY.T' and 'TUMOR.STAGE'.
-
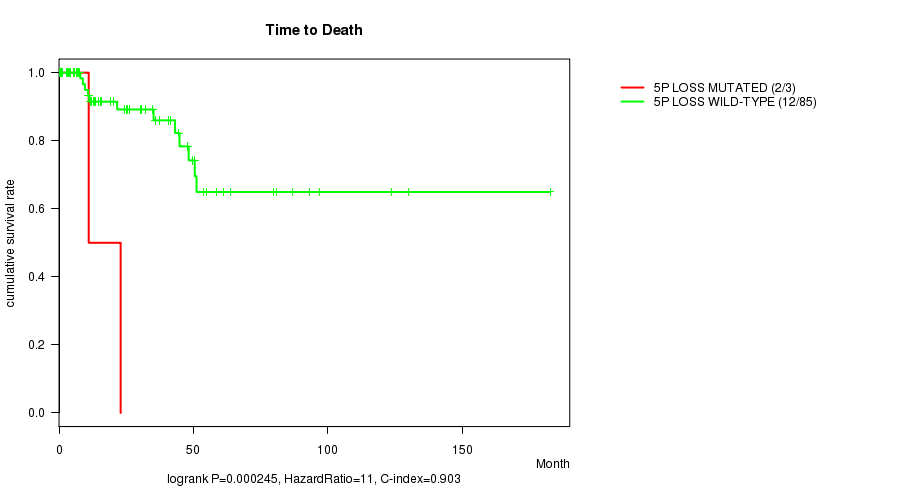
5p loss cnv correlated to 'Time to Death'.
-
11p loss cnv correlated to 'Time to Death'.
-
17p loss cnv correlated to 'Time to Death'.
Table 1. Get Full Table Overview of the association between significant copy number variation of 53 arm-level results and 8 clinical features. Shown in the table are P values (Q values). Thresholded by Q value < 0.25, 7 significant findings detected.
|
Clinical Features |
Time to Death |
AGE | GENDER |
KARNOFSKY PERFORMANCE SCORE |
PATHOLOGY T |
PATHOLOGY N |
PATHOLOGICSPREAD(M) |
TUMOR STAGE |
||
| nCNV (%) | nWild-Type | logrank test | t-test | Fisher's exact test | t-test | Fisher's exact test | Fisher's exact test | Fisher's exact test | Fisher's exact test | |
| 17p gain | 48 (51%) | 47 |
0.213 (1.00) |
0.0264 (1.00) |
0.00707 (1.00) |
0.223 (1.00) |
0.000566 (0.203) |
0.264 (1.00) |
0.0287 (1.00) |
0.000422 (0.151) |
| 1q gain | 8 (8%) | 87 |
0.000112 (0.0406) |
0.725 (1.00) |
0.229 (1.00) |
0.00427 (1.00) |
1 (1.00) |
0.124 (1.00) |
0.00784 (1.00) |
|
| 6q gain | 3 (3%) | 92 |
6.38e-06 (0.00231) |
0.243 (1.00) |
0.553 (1.00) |
0.68 (1.00) |
0.00801 (1.00) |
0.0741 (1.00) |
||
| 5p loss | 3 (3%) | 92 |
0.000245 (0.0881) |
0.189 (1.00) |
0.207 (1.00) |
0.061 (1.00) |
||||
| 11p loss | 6 (6%) | 89 |
0.000578 (0.206) |
0.146 (1.00) |
1 (1.00) |
0.344 (1.00) |
0.335 (1.00) |
0.258 (1.00) |
||
| 17p loss | 4 (4%) | 91 |
2.62e-07 (9.5e-05) |
0.897 (1.00) |
0.0754 (1.00) |
0.154 (1.00) |
0.0754 (1.00) |
0.0682 (1.00) |
||
| 2p gain | 10 (11%) | 85 |
0.196 (1.00) |
0.281 (1.00) |
1 (1.00) |
0.539 (1.00) |
1 (1.00) |
0.219 (1.00) |
0.0317 (1.00) |
0.0413 (1.00) |
| 2q gain | 11 (12%) | 84 |
0.305 (1.00) |
0.528 (1.00) |
0.726 (1.00) |
0.539 (1.00) |
1 (1.00) |
0.053 (1.00) |
0.0832 (1.00) |
0.00966 (1.00) |
| 3p gain | 23 (24%) | 72 |
0.408 (1.00) |
0.926 (1.00) |
0.0653 (1.00) |
0.0981 (1.00) |
0.0187 (1.00) |
1 (1.00) |
0.747 (1.00) |
0.285 (1.00) |
| 3q gain | 25 (26%) | 70 |
0.283 (1.00) |
0.974 (1.00) |
0.0392 (1.00) |
0.219 (1.00) |
0.0458 (1.00) |
1 (1.00) |
0.642 (1.00) |
0.38 (1.00) |
| 4p gain | 4 (4%) | 91 |
0.0729 (1.00) |
0.0368 (1.00) |
1 (1.00) |
0.311 (1.00) |
0.352 (1.00) |
0.0252 (1.00) |
0.0741 (1.00) |
|
| 4q gain | 3 (3%) | 92 |
0.693 (1.00) |
0.0347 (1.00) |
1 (1.00) |
0.319 (1.00) |
||||
| 5p gain | 9 (9%) | 86 |
0.766 (1.00) |
0.174 (1.00) |
0.442 (1.00) |
0.394 (1.00) |
0.0502 (1.00) |
0.816 (1.00) |
0.355 (1.00) |
0.0735 (1.00) |
| 5q gain | 9 (9%) | 86 |
0.318 (1.00) |
0.259 (1.00) |
0.442 (1.00) |
0.394 (1.00) |
0.235 (1.00) |
0.816 (1.00) |
0.655 (1.00) |
0.283 (1.00) |
| 6p gain | 4 (4%) | 91 |
0.0775 (1.00) |
0.332 (1.00) |
0.316 (1.00) |
0.154 (1.00) |
0.509 (1.00) |
0.00878 (1.00) |
0.0682 (1.00) |
|
| 7p gain | 51 (54%) | 44 |
0.0752 (1.00) |
0.569 (1.00) |
0.0764 (1.00) |
0.192 (1.00) |
0.00337 (1.00) |
0.581 (1.00) |
0.101 (1.00) |
0.00319 (1.00) |
| 7q gain | 52 (55%) | 43 |
0.0752 (1.00) |
0.569 (1.00) |
0.176 (1.00) |
0.192 (1.00) |
0.0107 (1.00) |
0.581 (1.00) |
0.116 (1.00) |
0.0112 (1.00) |
| 8p gain | 5 (5%) | 90 |
0.585 (1.00) |
0.263 (1.00) |
0.63 (1.00) |
0.0877 (1.00) |
0.575 (1.00) |
0.75 (1.00) |
0.146 (1.00) |
|
| 8q gain | 7 (7%) | 88 |
0.00545 (1.00) |
0.675 (1.00) |
0.417 (1.00) |
0.0136 (1.00) |
0.166 (1.00) |
0.491 (1.00) |
0.0116 (1.00) |
|
| 10p gain | 3 (3%) | 92 |
1 (1.00) |
0.319 (1.00) |
||||||
| 12p gain | 29 (31%) | 66 |
0.997 (1.00) |
0.95 (1.00) |
0.0937 (1.00) |
0.272 (1.00) |
1 (1.00) |
0.478 (1.00) |
0.181 (1.00) |
0.461 (1.00) |
| 12q gain | 29 (31%) | 66 |
0.997 (1.00) |
0.95 (1.00) |
0.0937 (1.00) |
0.272 (1.00) |
1 (1.00) |
0.478 (1.00) |
0.181 (1.00) |
0.461 (1.00) |
| 13q gain | 10 (11%) | 85 |
0.711 (1.00) |
0.329 (1.00) |
1 (1.00) |
0.219 (1.00) |
0.787 (1.00) |
1 (1.00) |
0.918 (1.00) |
|
| 16p gain | 42 (44%) | 53 |
0.524 (1.00) |
0.478 (1.00) |
0.00601 (1.00) |
0.533 (1.00) |
0.543 (1.00) |
0.446 (1.00) |
0.719 (1.00) |
0.804 (1.00) |
| 16q gain | 39 (41%) | 56 |
0.0993 (1.00) |
0.592 (1.00) |
0.013 (1.00) |
0.279 (1.00) |
0.403 (1.00) |
0.228 (1.00) |
0.185 (1.00) |
0.819 (1.00) |
| 17q gain | 57 (60%) | 38 |
0.744 (1.00) |
0.127 (1.00) |
0.108 (1.00) |
0.569 (1.00) |
0.254 (1.00) |
0.32 (1.00) |
0.0735 (1.00) |
0.164 (1.00) |
| 18p gain | 6 (6%) | 89 |
0.201 (1.00) |
0.551 (1.00) |
0.667 (1.00) |
0.539 (1.00) |
0.831 (1.00) |
0.385 (1.00) |
0.442 (1.00) |
|
| 18q gain | 5 (5%) | 90 |
0.606 (1.00) |
0.921 (1.00) |
1 (1.00) |
0.632 (1.00) |
1 (1.00) |
0.542 (1.00) |
||
| 20p gain | 27 (28%) | 68 |
0.431 (1.00) |
0.0169 (1.00) |
0.455 (1.00) |
0.642 (1.00) |
0.564 (1.00) |
1 (1.00) |
0.559 (1.00) |
0.629 (1.00) |
| 20q gain | 29 (31%) | 66 |
0.431 (1.00) |
0.0435 (1.00) |
0.626 (1.00) |
0.642 (1.00) |
0.372 (1.00) |
1 (1.00) |
0.677 (1.00) |
0.417 (1.00) |
| Xq gain | 4 (4%) | 91 |
0.418 (1.00) |
0.329 (1.00) |
0.0754 (1.00) |
0.758 (1.00) |
0.38 (1.00) |
0.33 (1.00) |
||
| 1p loss | 8 (8%) | 87 |
0.777 (1.00) |
0.815 (1.00) |
1 (1.00) |
0.546 (1.00) |
0.621 (1.00) |
0.298 (1.00) |
||
| 1q loss | 4 (4%) | 91 |
0.745 (1.00) |
0.15 (1.00) |
1 (1.00) |
1 (1.00) |
1 (1.00) |
1 (1.00) |
||
| 3p loss | 5 (5%) | 90 |
0.216 (1.00) |
0.106 (1.00) |
0.317 (1.00) |
0.164 (1.00) |
1 (1.00) |
0.385 (1.00) |
0.105 (1.00) |
|
| 4p loss | 6 (6%) | 89 |
0.133 (1.00) |
0.283 (1.00) |
0.0601 (1.00) |
0.27 (1.00) |
1 (1.00) |
1 (1.00) |
0.144 (1.00) |
|
| 4q loss | 6 (6%) | 89 |
0.705 (1.00) |
0.878 (1.00) |
0.355 (1.00) |
0.698 (1.00) |
1 (1.00) |
0.609 (1.00) |
||
| 5q loss | 3 (3%) | 92 |
0.0288 (1.00) |
0.495 (1.00) |
0.207 (1.00) |
0.68 (1.00) |
||||
| 6p loss | 8 (8%) | 87 |
0.0118 (1.00) |
0.367 (1.00) |
0.229 (1.00) |
0.219 (1.00) |
0.157 (1.00) |
0.213 (1.00) |
1 (1.00) |
0.194 (1.00) |
| 6q loss | 9 (9%) | 86 |
0.217 (1.00) |
0.805 (1.00) |
0.0178 (1.00) |
0.356 (1.00) |
0.111 (1.00) |
0.408 (1.00) |
0.446 (1.00) |
0.308 (1.00) |
| 9p loss | 12 (13%) | 83 |
0.0601 (1.00) |
0.475 (1.00) |
0.00502 (1.00) |
0.422 (1.00) |
0.129 (1.00) |
1 (1.00) |
0.428 (1.00) |
0.341 (1.00) |
| 9q loss | 12 (13%) | 83 |
0.102 (1.00) |
0.448 (1.00) |
0.0369 (1.00) |
0.422 (1.00) |
0.129 (1.00) |
1 (1.00) |
0.643 (1.00) |
0.477 (1.00) |
| 10p loss | 3 (3%) | 92 |
0.0285 (1.00) |
0.774 (1.00) |
1 (1.00) |
0.319 (1.00) |
||||
| 10q loss | 3 (3%) | 92 |
0.000937 (0.334) |
0.758 (1.00) |
0.553 (1.00) |
0.68 (1.00) |
0.124 (1.00) |
0.33 (1.00) |
||
| 11q loss | 7 (7%) | 88 |
0.0121 (1.00) |
0.182 (1.00) |
1 (1.00) |
0.0136 (1.00) |
0.575 (1.00) |
0.307 (1.00) |
0.0263 (1.00) |
|
| 13q loss | 6 (6%) | 89 |
0.0137 (1.00) |
0.688 (1.00) |
0.00801 (1.00) |
0.27 (1.00) |
0.352 (1.00) |
1 (1.00) |
0.361 (1.00) |
|
| 14q loss | 15 (16%) | 80 |
0.973 (1.00) |
0.868 (1.00) |
0.363 (1.00) |
0.422 (1.00) |
0.64 (1.00) |
0.449 (1.00) |
0.602 (1.00) |
0.308 (1.00) |
| 15q loss | 8 (8%) | 87 |
0.0335 (1.00) |
0.248 (1.00) |
0.69 (1.00) |
0.157 (1.00) |
1 (1.00) |
0.621 (1.00) |
0.298 (1.00) |
|
| 16q loss | 3 (3%) | 92 |
0.0237 (1.00) |
0.68 (1.00) |
0.38 (1.00) |
0.33 (1.00) |
||||
| 18p loss | 13 (14%) | 82 |
0.00233 (0.826) |
0.729 (1.00) |
0.749 (1.00) |
0.356 (1.00) |
0.192 (1.00) |
0.49 (1.00) |
0.749 (1.00) |
0.431 (1.00) |
| 18q loss | 14 (15%) | 81 |
0.00233 (0.826) |
0.729 (1.00) |
1 (1.00) |
0.356 (1.00) |
0.108 (1.00) |
0.49 (1.00) |
0.677 (1.00) |
0.245 (1.00) |
| 21q loss | 10 (11%) | 85 |
0.15 (1.00) |
0.0392 (1.00) |
0.474 (1.00) |
0.885 (1.00) |
1 (1.00) |
0.43 (1.00) |
||
| 22q loss | 15 (16%) | 80 |
0.654 (1.00) |
0.537 (1.00) |
0.13 (1.00) |
0.473 (1.00) |
0.13 (1.00) |
1 (1.00) |
0.353 (1.00) |
0.152 (1.00) |
| Xq loss | 3 (3%) | 92 |
0.745 (1.00) |
0.967 (1.00) |
1 (1.00) |
1 (1.00) |
1 (1.00) |
P value = 0.000112 (logrank test), Q value = 0.041
Table S1. Gene #1: '1q gain mutation analysis' versus Clinical Feature #1: 'Time to Death'
| nPatients | nDeath | Duration Range (Median), Month | |
|---|---|---|---|
| ALL | 88 | 14 | 0.0 - 182.7 (15.7) |
| 1Q GAIN MUTATED | 7 | 2 | 0.7 - 25.4 (7.6) |
| 1Q GAIN WILD-TYPE | 81 | 12 | 0.0 - 182.7 (20.1) |
Figure S1. Get High-res Image Gene #1: '1q gain mutation analysis' versus Clinical Feature #1: 'Time to Death'
P value = 6.38e-06 (logrank test), Q value = 0.0023
Table S2. Gene #11: '6q gain mutation analysis' versus Clinical Feature #1: 'Time to Death'
| nPatients | nDeath | Duration Range (Median), Month | |
|---|---|---|---|
| ALL | 88 | 14 | 0.0 - 182.7 (15.7) |
| 6Q GAIN MUTATED | 3 | 2 | 7.9 - 13.6 (9.6) |
| 6Q GAIN WILD-TYPE | 85 | 12 | 0.0 - 182.7 (19.2) |
Figure S2. Get High-res Image Gene #11: '6q gain mutation analysis' versus Clinical Feature #1: 'Time to Death'
P value = 0.000566 (Fisher's exact test), Q value = 0.2
Table S3. Gene #22: '17p gain mutation analysis' versus Clinical Feature #5: 'PATHOLOGY.T'
| nPatients | T1 | T2 | T3+T4 |
|---|---|---|---|
| ALL | 54 | 10 | 31 |
| 17P GAIN MUTATED | 34 | 7 | 7 |
| 17P GAIN WILD-TYPE | 20 | 3 | 24 |
Figure S3. Get High-res Image Gene #22: '17p gain mutation analysis' versus Clinical Feature #5: 'PATHOLOGY.T'
P value = 0.000422 (Fisher's exact test), Q value = 0.15
Table S4. Gene #22: '17p gain mutation analysis' versus Clinical Feature #8: 'TUMOR.STAGE'
| nPatients | I | II | III | IV |
|---|---|---|---|---|
| ALL | 49 | 5 | 22 | 9 |
| 17P GAIN MUTATED | 32 | 2 | 4 | 2 |
| 17P GAIN WILD-TYPE | 17 | 3 | 18 | 7 |
Figure S4. Get High-res Image Gene #22: '17p gain mutation analysis' versus Clinical Feature #8: 'TUMOR.STAGE'

P value = 0.000245 (logrank test), Q value = 0.088
Table S5. Gene #34: '5p loss mutation analysis' versus Clinical Feature #1: 'Time to Death'
| nPatients | nDeath | Duration Range (Median), Month | |
|---|---|---|---|
| ALL | 88 | 14 | 0.0 - 182.7 (15.7) |
| 5P LOSS MUTATED | 3 | 2 | 0.0 - 22.9 (11.1) |
| 5P LOSS WILD-TYPE | 85 | 12 | 0.1 - 182.7 (15.9) |
Figure S5. Get High-res Image Gene #34: '5p loss mutation analysis' versus Clinical Feature #1: 'Time to Death'
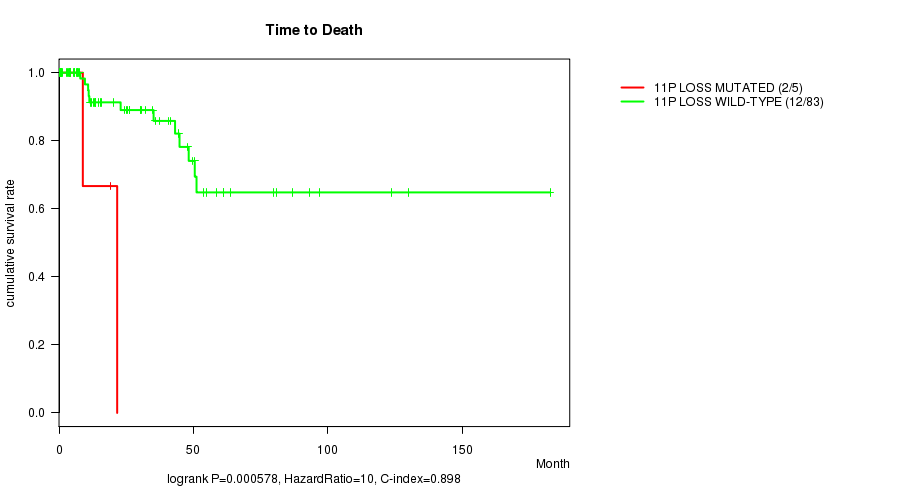
P value = 0.000578 (logrank test), Q value = 0.21
Table S6. Gene #42: '11p loss mutation analysis' versus Clinical Feature #1: 'Time to Death'
| nPatients | nDeath | Duration Range (Median), Month | |
|---|---|---|---|
| ALL | 88 | 14 | 0.0 - 182.7 (15.7) |
| 11P LOSS MUTATED | 5 | 2 | 0.7 - 21.6 (8.8) |
| 11P LOSS WILD-TYPE | 83 | 12 | 0.0 - 182.7 (15.9) |
Figure S6. Get High-res Image Gene #42: '11p loss mutation analysis' versus Clinical Feature #1: 'Time to Death'
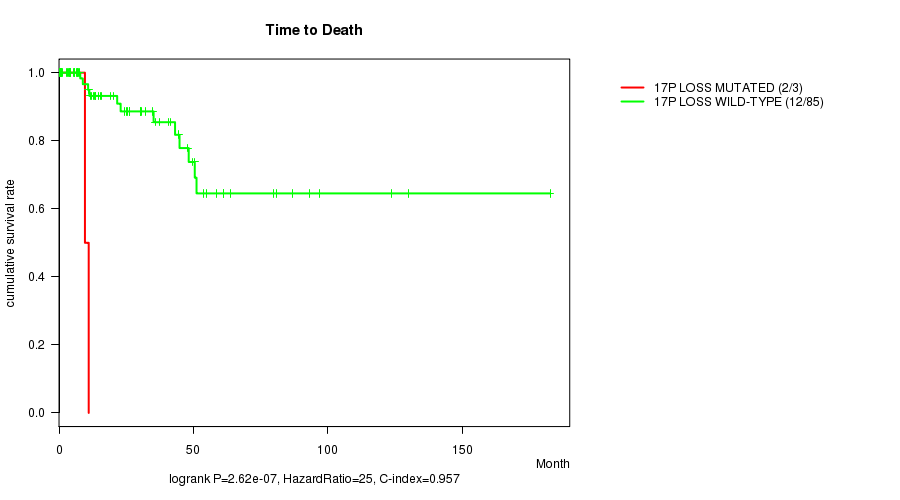
P value = 2.62e-07 (logrank test), Q value = 9.5e-05
Table S7. Gene #48: '17p loss mutation analysis' versus Clinical Feature #1: 'Time to Death'
| nPatients | nDeath | Duration Range (Median), Month | |
|---|---|---|---|
| ALL | 88 | 14 | 0.0 - 182.7 (15.7) |
| 17P LOSS MUTATED | 3 | 2 | 0.7 - 11.1 (9.6) |
| 17P LOSS WILD-TYPE | 85 | 12 | 0.0 - 182.7 (19.2) |
Figure S7. Get High-res Image Gene #48: '17p loss mutation analysis' versus Clinical Feature #1: 'Time to Death'
-
Mutation data file = broad_values_by_arm.mutsig.cluster.txt
-
Clinical data file = KIRP.clin.merged.picked.txt
-
Number of patients = 95
-
Number of significantly arm-level cnvs = 53
-
Number of selected clinical features = 8
-
Exclude genes that fewer than K tumors have mutations, K = 3
For survival clinical features, the Kaplan-Meier survival curves of tumors with and without gene mutations were plotted and the statistical significance P values were estimated by logrank test (Bland and Altman 2004) using the 'survdiff' function in R
For continuous numerical clinical features, two-tailed Student's t test with unequal variance (Lehmann and Romano 2005) was applied to compare the clinical values between tumors with and without gene mutations using 't.test' function in R
For binary or multi-class clinical features (nominal or ordinal), two-tailed Fisher's exact tests (Fisher 1922) were used to estimate the P values using the 'fisher.test' function in R
For multiple hypothesis correction, Q value is the False Discovery Rate (FDR) analogue of the P value (Benjamini and Hochberg 1995), defined as the minimum FDR at which the test may be called significant. We used the 'Benjamini and Hochberg' method of 'p.adjust' function in R to convert P values into Q values.
This is an experimental feature. The full results of the analysis summarized in this report can be downloaded from the TCGA Data Coordination Center.