This pipeline uses various statistical tests to identify mRNAs whose expression levels correlated to selected clinical features.
Testing the association between 18200 genes and 8 clinical features across 63 samples, statistically thresholded by Q value < 0.05, 5 clinical features related to at least one genes.
-
1 gene correlated to 'AGE'.
-
MCCC2|64087
-
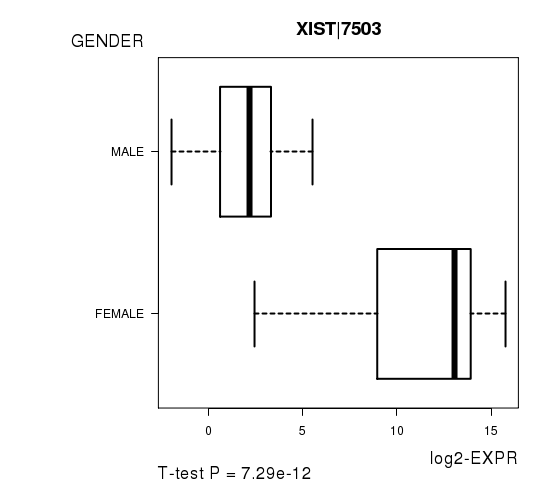
13 genes correlated to 'GENDER'.
-
XIST|7503 , RPS4Y1|6192 , KDM5C|8242 , UBA1|7317 , PRKY|5616 , ...
-
21 genes correlated to 'PATHOLOGY.T'.
-
UCK2|7371 , EIF3E|3646 , MAD2L1|4085 , ACBD6|84320 , PRCC|5546 , ...
-
2 genes correlated to 'PATHOLOGICSPREAD(M)'.
-
CA8|767 , RPIA|22934
-
79 genes correlated to 'TUMOR.STAGE'.
-
MAD2L1|4085 , UCK2|7371 , EIF3E|3646 , PRCC|5546 , PAICS|10606 , ...
-
No genes correlated to 'Time to Death', 'KARNOFSKY.PERFORMANCE.SCORE', and 'PATHOLOGY.N'.
Complete statistical result table is provided in Supplement Table 1
Table 1. Get Full Table This table shows the clinical features, statistical methods used, and the number of genes that are significantly associated with each clinical feature at Q value < 0.05.
| Clinical feature | Statistical test | Significant genes | Associated with | Associated with | ||
|---|---|---|---|---|---|---|
| Time to Death | Cox regression test | N=0 | ||||
| AGE | Spearman correlation test | N=1 | older | N=1 | younger | N=0 |
| GENDER | t test | N=13 | male | N=3 | female | N=10 |
| KARNOFSKY PERFORMANCE SCORE | Spearman correlation test | N=0 | ||||
| PATHOLOGY T | Spearman correlation test | N=21 | higher pT | N=18 | lower pT | N=3 |
| PATHOLOGY N | Spearman correlation test | N=0 | ||||
| PATHOLOGICSPREAD(M) | ANOVA test | N=2 | ||||
| TUMOR STAGE | Spearman correlation test | N=79 | higher stage | N=67 | lower stage | N=12 |
Table S1. Basic characteristics of clinical feature: 'Time to Death'
| Time to Death | Duration (Months) | 0.5-123.6 (median=15.5) |
| censored | N = 50 | |
| death | N = 13 | |
| Significant markers | N = 0 |
Table S2. Basic characteristics of clinical feature: 'AGE'
| AGE | Mean (SD) | 60.33 (13) |
| Significant markers | N = 1 | |
| pos. correlated | 1 | |
| neg. correlated | 0 |
Table S3. Get Full Table List of one gene significantly correlated to 'AGE' by Spearman correlation test
| SpearmanCorr | corrP | Q | |
|---|---|---|---|
| MCCC2|64087 | 0.5619 | 1.65e-06 | 0.03 |
Figure S1. Get High-res Image As an example, this figure shows the association of MCCC2|64087 to 'AGE'. P value = 1.65e-06 with Spearman correlation analysis. The straight line presents the best linear regression.
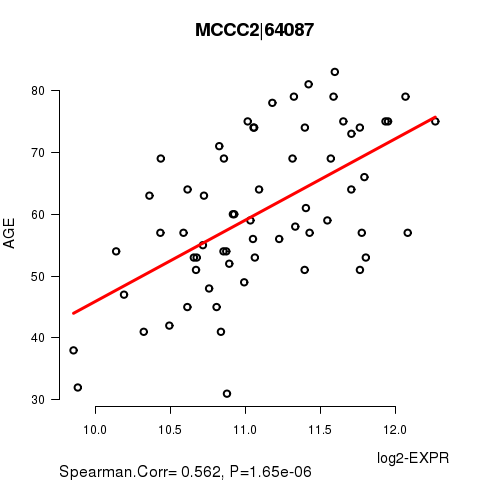
Table S4. Basic characteristics of clinical feature: 'GENDER'
| GENDER | Labels | N |
| FEMALE | 20 | |
| MALE | 43 | |
| Significant markers | N = 13 | |
| Higher in MALE | 3 | |
| Higher in FEMALE | 10 |
Table S5. Get Full Table List of top 10 genes differentially expressed by 'GENDER'
| T(pos if higher in 'MALE') | ttestP | Q | AUC | |
|---|---|---|---|---|
| XIST|7503 | -11.68 | 7.289e-12 | 1.33e-07 | 0.9792 |
| RPS4Y1|6192 | 11.18 | 1.276e-10 | 2.32e-06 | 0.9549 |
| KDM5C|8242 | -8.47 | 1.524e-10 | 2.77e-06 | 0.9465 |
| UBA1|7317 | -6.63 | 5.222e-08 | 0.00095 | 0.8919 |
| PRKY|5616 | 6.99 | 6.204e-08 | 0.00113 | 0.9151 |
| KDM6A|7403 | -5.99 | 3.694e-07 | 0.00672 | 0.8965 |
| TSIX|9383 | -6.71 | 4.703e-07 | 0.00855 | 0.9215 |
| ZFX|7543 | -5.93 | 4.708e-07 | 0.00856 | 0.8721 |
| IGSF9B|22997 | -5.67 | 5.808e-07 | 0.0106 | 0.8477 |
| MAGEE1|57692 | -6.03 | 6.519e-07 | 0.0119 | 0.8663 |
Figure S2. Get High-res Image As an example, this figure shows the association of XIST|7503 to 'GENDER'. P value = 7.29e-12 with T-test analysis.
No gene related to 'KARNOFSKY.PERFORMANCE.SCORE'.
Table S6. Basic characteristics of clinical feature: 'KARNOFSKY.PERFORMANCE.SCORE'
| KARNOFSKY.PERFORMANCE.SCORE | Mean (SD) | 83.75 (34) |
| Score | N | |
| 0 | 1 | |
| 90 | 3 | |
| 100 | 4 | |
| Significant markers | N = 0 |
Table S7. Basic characteristics of clinical feature: 'PATHOLOGY.T'
| PATHOLOGY.T | Mean (SD) | 1.86 (0.93) |
| N | ||
| T1 | 32 | |
| T2 | 8 | |
| T3 | 23 | |
| Significant markers | N = 21 | |
| pos. correlated | 18 | |
| neg. correlated | 3 |
Table S8. Get Full Table List of top 10 genes significantly correlated to 'PATHOLOGY.T' by Spearman correlation test
| SpearmanCorr | corrP | Q | |
|---|---|---|---|
| UCK2|7371 | 0.6685 | 2.14e-09 | 3.9e-05 |
| EIF3E|3646 | 0.6206 | 5.78e-08 | 0.00105 |
| MAD2L1|4085 | 0.6113 | 1.027e-07 | 0.00187 |
| ACBD6|84320 | 0.6034 | 1.661e-07 | 0.00302 |
| PRCC|5546 | 0.6 | 2.03e-07 | 0.00369 |
| NUF2|83540 | 0.595 | 2.709e-07 | 0.00493 |
| GPR19|2842 | 0.5953 | 4.2e-07 | 0.00764 |
| PAICS|10606 | 0.5853 | 4.689e-07 | 0.00853 |
| ENY2|56943 | 0.5844 | 4.946e-07 | 0.009 |
| EPHA1|2041 | -0.5826 | 5.451e-07 | 0.00992 |
Figure S3. Get High-res Image As an example, this figure shows the association of UCK2|7371 to 'PATHOLOGY.T'. P value = 2.14e-09 with Spearman correlation analysis.
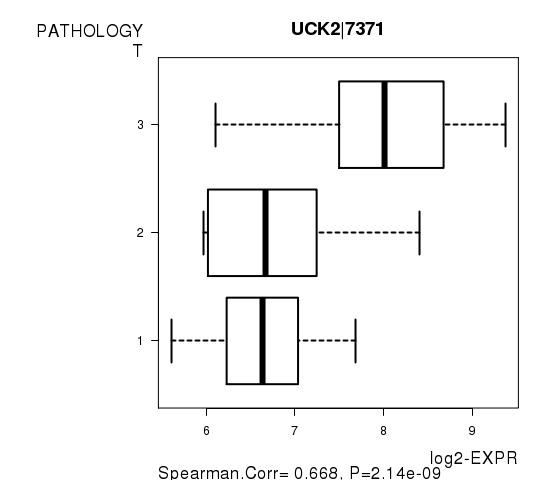
Table S9. Basic characteristics of clinical feature: 'PATHOLOGY.N'
| PATHOLOGY.N | Mean (SD) | 0.58 (0.7) |
| N | ||
| N0 | 14 | |
| N1 | 9 | |
| N2 | 3 | |
| Significant markers | N = 0 |
Table S10. Basic characteristics of clinical feature: 'PATHOLOGICSPREAD(M)'
| PATHOLOGICSPREAD(M) | Labels | N |
| M0 | 42 | |
| M1 | 5 | |
| MX | 9 | |
| Significant markers | N = 2 |
Table S11. Get Full Table List of 2 genes differentially expressed by 'PATHOLOGICSPREAD(M)'
| ANOVA_P | Q | |
|---|---|---|
| CA8|767 | 1.585e-08 | 0.000288 |
| RPIA|22934 | 7.612e-07 | 0.0139 |
Figure S4. Get High-res Image As an example, this figure shows the association of CA8|767 to 'PATHOLOGICSPREAD(M)'. P value = 1.58e-08 with ANOVA analysis.
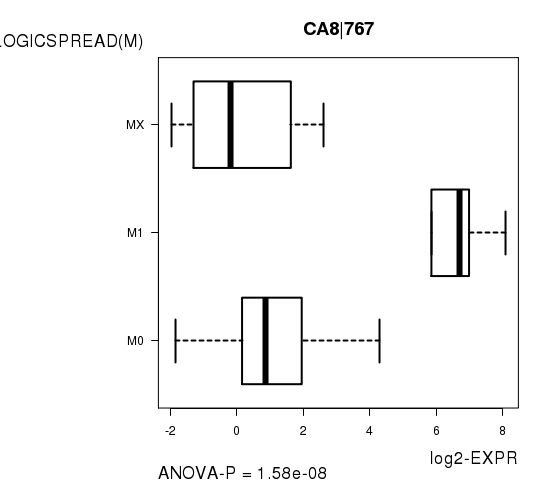
Table S12. Basic characteristics of clinical feature: 'TUMOR.STAGE'
| TUMOR.STAGE | Mean (SD) | 2.02 (1.2) |
| N | ||
| Stage 1 | 29 | |
| Stage 2 | 3 | |
| Stage 3 | 16 | |
| Stage 4 | 7 | |
| Significant markers | N = 79 | |
| pos. correlated | 67 | |
| neg. correlated | 12 |
Table S13. Get Full Table List of top 10 genes significantly correlated to 'TUMOR.STAGE' by Spearman correlation test
| SpearmanCorr | corrP | Q | |
|---|---|---|---|
| MAD2L1|4085 | 0.7346 | 1.729e-10 | 3.15e-06 |
| UCK2|7371 | 0.7256 | 3.678e-10 | 6.69e-06 |
| EIF3E|3646 | 0.7126 | 1.045e-09 | 1.9e-05 |
| PRCC|5546 | 0.7046 | 1.933e-09 | 3.52e-05 |
| PAICS|10606 | 0.6664 | 2.803e-08 | 0.00051 |
| EPR1|8475 | 0.6699 | 3.023e-08 | 0.00055 |
| NUF2|83540 | 0.6584 | 4.667e-08 | 0.000849 |
| PABPC1|26986 | 0.648 | 8.873e-08 | 0.00161 |
| CENPF|1063 | 0.6467 | 9.627e-08 | 0.00175 |
| KIF4A|24137 | 0.6395 | 1.48e-07 | 0.00269 |
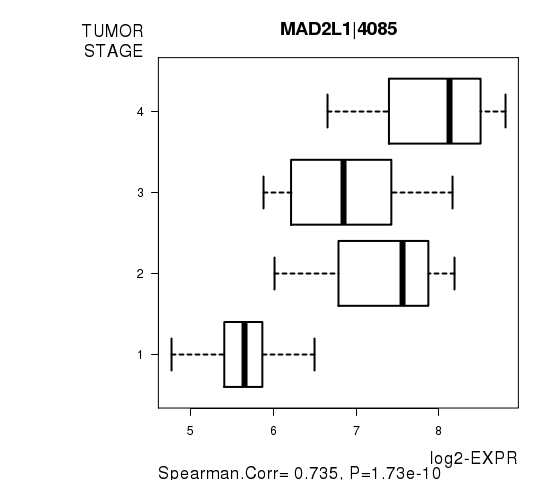
Figure S5. Get High-res Image As an example, this figure shows the association of MAD2L1|4085 to 'TUMOR.STAGE'. P value = 1.73e-10 with Spearman correlation analysis.
-
Expresson data file = KIRP.uncv2.mRNAseq_RSEM_normalized_log2.txt
-
Clinical data file = KIRP.clin.merged.picked.txt
-
Number of patients = 63
-
Number of genes = 18200
-
Number of clinical features = 8
For survival clinical features, Wald's test in univariate Cox regression analysis with proportional hazards model (Andersen and Gill 1982) was used to estimate the P values using the 'coxph' function in R. Kaplan-Meier survival curves were plot using the four quartile subgroups of patients based on expression levels
For continuous numerical clinical features, Spearman's rank correlation coefficients (Spearman 1904) and two-tailed P values were estimated using 'cor.test' function in R
For two-class clinical features, two-tailed Student's t test with unequal variance (Lehmann and Romano 2005) was applied to compare the log2-expression levels between the two clinical classes using 't.test' function in R
For multi-class clinical features (ordinal or nominal), one-way analysis of variance (Howell 2002) was applied to compare the log2-expression levels between different clinical classes using 'anova' function in R
For multiple hypothesis correction, Q value is the False Discovery Rate (FDR) analogue of the P value (Benjamini and Hochberg 1995), defined as the minimum FDR at which the test may be called significant. We used the 'Benjamini and Hochberg' method of 'p.adjust' function in R to convert P values into Q values.
This is an experimental feature. The full results of the analysis summarized in this report can be downloaded from the TCGA Data Coordination Center.