This pipeline uses various statistical tests to identify genes whose promoter methylation levels correlated to selected clinical features.
Testing the association between 20232 genes and 8 clinical features across 79 samples, statistically thresholded by Q value < 0.05, 5 clinical features related to at least one genes.
-
51 genes correlated to 'Time to Death'.
-
KCNF1 , PER1 , ECE2 , FBLN5 , KCNK13 , ...
-
320 genes correlated to 'PATHOLOGY.T'.
-
PAX6 , TRH , ALX3 , TLX3 , OTP , ...
-
1 gene correlated to 'PATHOLOGY.N'.
-
HMX3
-
136 genes correlated to 'PATHOLOGICSPREAD(M)'.
-
HSD3B2 , LOC100132247 , KRAS , ERCC2 , PRR24 , ...
-
384 genes correlated to 'TUMOR.STAGE'.
-
PAX6 , GATA4 , NKX2-6 , TLX3 , OTP , ...
-
No genes correlated to 'AGE', 'GENDER', and 'KARNOFSKY.PERFORMANCE.SCORE'.
Complete statistical result table is provided in Supplement Table 1
Table 1. Get Full Table This table shows the clinical features, statistical methods used, and the number of genes that are significantly associated with each clinical feature at Q value < 0.05.
| Clinical feature | Statistical test | Significant genes | Associated with | Associated with | ||
|---|---|---|---|---|---|---|
| Time to Death | Cox regression test | N=51 | shorter survival | N=51 | longer survival | N=0 |
| AGE | Spearman correlation test | N=0 | ||||
| GENDER | t test | N=0 | ||||
| KARNOFSKY PERFORMANCE SCORE | Spearman correlation test | N=0 | ||||
| PATHOLOGY T | Spearman correlation test | N=320 | higher pT | N=306 | lower pT | N=14 |
| PATHOLOGY N | Spearman correlation test | N=1 | higher pN | N=1 | lower pN | N=0 |
| PATHOLOGICSPREAD(M) | ANOVA test | N=136 | ||||
| TUMOR STAGE | Spearman correlation test | N=384 | higher stage | N=379 | lower stage | N=5 |
Table S1. Basic characteristics of clinical feature: 'Time to Death'
| Time to Death | Duration (Months) | 0-182.7 (median=20.9) |
| censored | N = 60 | |
| death | N = 12 | |
| Significant markers | N = 51 | |
| associated with shorter survival | 51 | |
| associated with longer survival | 0 |
Table S2. Get Full Table List of top 10 genes significantly associated with 'Time to Death' by Cox regression test
| HazardRatio | Wald_P | Q | C_index | |
|---|---|---|---|---|
| KCNF1 | 6401 | 8.158e-08 | 0.0017 | 0.82 |
| PER1 | 4501 | 1.13e-07 | 0.0023 | 0.785 |
| ECE2 | 3801 | 1.478e-07 | 0.003 | 0.867 |
| FBLN5 | 1301 | 1.749e-07 | 0.0035 | 0.719 |
| KCNK13 | 7601 | 1.877e-07 | 0.0038 | 0.775 |
| PTCH1 | 17001 | 2.101e-07 | 0.0043 | 0.862 |
| IGF2AS | 1801 | 3.265e-07 | 0.0066 | 0.899 |
| SORBS3 | 1301 | 3.62e-07 | 0.0073 | 0.768 |
| NRARP | 6001 | 3.881e-07 | 0.0078 | 0.709 |
| DDN | 1101 | 3.942e-07 | 0.008 | 0.63 |
Figure S1. Get High-res Image As an example, this figure shows the association of KCNF1 to 'Time to Death'. four curves present the cumulative survival rates of 4 quartile subsets of patients. P value = 8.16e-08 with univariate Cox regression analysis using continuous log-2 expression values.
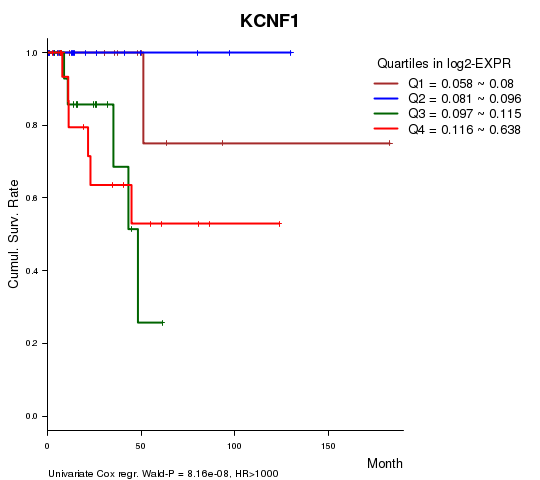
Table S3. Basic characteristics of clinical feature: 'AGE'
| AGE | Mean (SD) | 60.51 (12) |
| Significant markers | N = 0 |
Table S4. Basic characteristics of clinical feature: 'GENDER'
| GENDER | Labels | N |
| FEMALE | 24 | |
| MALE | 55 | |
| Significant markers | N = 0 |
No gene related to 'KARNOFSKY.PERFORMANCE.SCORE'.
Table S5. Basic characteristics of clinical feature: 'KARNOFSKY.PERFORMANCE.SCORE'
| KARNOFSKY.PERFORMANCE.SCORE | Mean (SD) | 92.11 (14) |
| Score | N | |
| 40 | 1 | |
| 90 | 9 | |
| 100 | 9 | |
| Significant markers | N = 0 |
Table S6. Basic characteristics of clinical feature: 'PATHOLOGY.T'
| PATHOLOGY.T | Mean (SD) | 1.78 (0.98) |
| N | ||
| T1 | 47 | |
| T2 | 3 | |
| T3 | 28 | |
| T4 | 1 | |
| Significant markers | N = 320 | |
| pos. correlated | 306 | |
| neg. correlated | 14 |
Table S7. Get Full Table List of top 10 genes significantly correlated to 'PATHOLOGY.T' by Spearman correlation test
| SpearmanCorr | corrP | Q | |
|---|---|---|---|
| PAX6 | 0.7441 | 3.91e-15 | 7.91e-11 |
| TRH | 0.7168 | 1.097e-13 | 2.22e-09 |
| ALX3 | 0.7107 | 2.192e-13 | 4.43e-09 |
| TLX3 | 0.6993 | 7.603e-13 | 1.54e-08 |
| OTP | 0.695 | 1.198e-12 | 2.42e-08 |
| EVX2 | 0.6759 | 8.24e-12 | 1.67e-07 |
| NR5A2 | 0.6751 | 8.872e-12 | 1.79e-07 |
| PHOX2B | 0.6751 | 8.884e-12 | 1.8e-07 |
| NKX2-6 | 0.6683 | 1.714e-11 | 3.47e-07 |
| PPP1R16B | 0.6671 | 1.906e-11 | 3.85e-07 |
Figure S2. Get High-res Image As an example, this figure shows the association of PAX6 to 'PATHOLOGY.T'. P value = 3.91e-15 with Spearman correlation analysis.
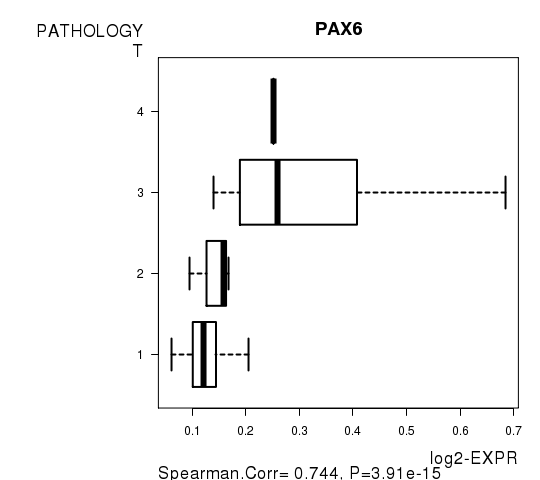
Table S8. Basic characteristics of clinical feature: 'PATHOLOGY.N'
| PATHOLOGY.N | Mean (SD) | 0.52 (0.72) |
| N | ||
| N0 | 19 | |
| N1 | 8 | |
| N2 | 4 | |
| Significant markers | N = 1 | |
| pos. correlated | 1 | |
| neg. correlated | 0 |
Table S9. Get Full Table List of one gene significantly correlated to 'PATHOLOGY.N' by Spearman correlation test
| SpearmanCorr | corrP | Q | |
|---|---|---|---|
| HMX3 | 0.7418 | 1.793e-06 | 0.0363 |
Figure S3. Get High-res Image As an example, this figure shows the association of HMX3 to 'PATHOLOGY.N'. P value = 1.79e-06 with Spearman correlation analysis.
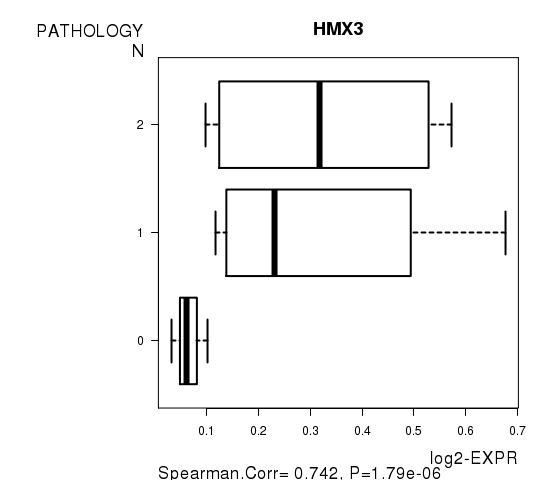
Table S10. Basic characteristics of clinical feature: 'PATHOLOGICSPREAD(M)'
| PATHOLOGICSPREAD(M) | Labels | N |
| M0 | 45 | |
| M1 | 4 | |
| MX | 27 | |
| Significant markers | N = 136 |
Table S11. Get Full Table List of top 10 genes differentially expressed by 'PATHOLOGICSPREAD(M)'
| ANOVA_P | Q | |
|---|---|---|
| HSD3B2 | 8.765e-15 | 1.77e-10 |
| LOC100132247 | 8.163e-12 | 1.65e-07 |
| KRAS | 2.545e-11 | 5.15e-07 |
| ERCC2 | 2.943e-11 | 5.95e-07 |
| PRR24 | 5.299e-11 | 1.07e-06 |
| RNASE4 | 5.624e-11 | 1.14e-06 |
| SPC24 | 6.758e-11 | 1.37e-06 |
| ANG | 7.035e-11 | 1.42e-06 |
| SLC26A2 | 8.433e-11 | 1.71e-06 |
| TMEM25 | 2.659e-10 | 5.38e-06 |
Figure S4. Get High-res Image As an example, this figure shows the association of HSD3B2 to 'PATHOLOGICSPREAD(M)'. P value = 8.76e-15 with ANOVA analysis.
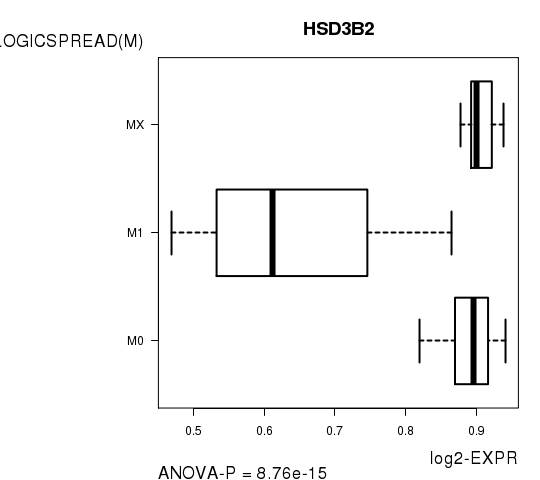
Table S12. Basic characteristics of clinical feature: 'TUMOR.STAGE'
| TUMOR.STAGE | Mean (SD) | 1.91 (1.1) |
| N | ||
| Stage 1 | 44 | |
| Stage 2 | 3 | |
| Stage 3 | 21 | |
| Stage 4 | 8 | |
| Significant markers | N = 384 | |
| pos. correlated | 379 | |
| neg. correlated | 5 |
Table S13. Get Full Table List of top 10 genes significantly correlated to 'TUMOR.STAGE' by Spearman correlation test
| SpearmanCorr | corrP | Q | |
|---|---|---|---|
| PAX6 | 0.7403 | 2.147e-14 | 4.34e-10 |
| GATA4 | 0.7224 | 1.752e-13 | 3.54e-09 |
| NKX2-6 | 0.7016 | 1.668e-12 | 3.38e-08 |
| TLX3 | 0.7003 | 1.908e-12 | 3.86e-08 |
| OTP | 0.6911 | 4.869e-12 | 9.85e-08 |
| TRH | 0.6894 | 5.752e-12 | 1.16e-07 |
| FOXE1 | 0.68 | 1.427e-11 | 2.89e-07 |
| NKX2-5 | 0.6785 | 1.649e-11 | 3.34e-07 |
| NHLH2 | 0.6763 | 2.021e-11 | 4.09e-07 |
| PRDM13 | 0.6761 | 2.056e-11 | 4.16e-07 |
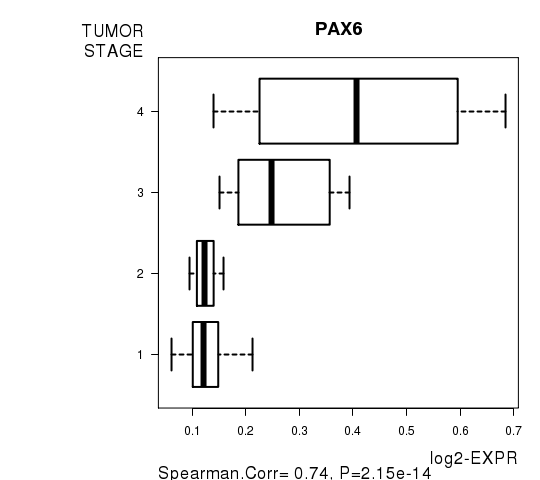
Figure S5. Get High-res Image As an example, this figure shows the association of PAX6 to 'TUMOR.STAGE'. P value = 2.15e-14 with Spearman correlation analysis.
-
Expresson data file = KIRP.meth.for_correlation.filtered_data.txt
-
Clinical data file = KIRP.clin.merged.picked.txt
-
Number of patients = 79
-
Number of genes = 20232
-
Number of clinical features = 8
For survival clinical features, Wald's test in univariate Cox regression analysis with proportional hazards model (Andersen and Gill 1982) was used to estimate the P values using the 'coxph' function in R. Kaplan-Meier survival curves were plot using the four quartile subgroups of patients based on expression levels
For continuous numerical clinical features, Spearman's rank correlation coefficients (Spearman 1904) and two-tailed P values were estimated using 'cor.test' function in R
For two-class clinical features, two-tailed Student's t test with unequal variance (Lehmann and Romano 2005) was applied to compare the log2-expression levels between the two clinical classes using 't.test' function in R
For multi-class clinical features (ordinal or nominal), one-way analysis of variance (Howell 2002) was applied to compare the log2-expression levels between different clinical classes using 'anova' function in R
For multiple hypothesis correction, Q value is the False Discovery Rate (FDR) analogue of the P value (Benjamini and Hochberg 1995), defined as the minimum FDR at which the test may be called significant. We used the 'Benjamini and Hochberg' method of 'p.adjust' function in R to convert P values into Q values.
This is an experimental feature. The full results of the analysis summarized in this report can be downloaded from the TCGA Data Coordination Center.